Lateral Pressure Developed On Piles In Clay
Slopes: Numerical Study
Mohamed A. Sobhey1
Ass. Lecturer in Structural Engineering Department, Tanta University, Egypt
m.sobhey@ f-eng.tanta.edu.eg
Marawan M. Shahien2
Professor in Structural Engineering Department, Tanta University, Egypt
Mostafa El-Sawwaf 3
Professor in Structural Engineering Department, Tanta University, Egypt
Abstract—This paper aims to study the lateral
pressure developed on a row of piles in clay
slopes for different parameters. Extensive
numerical models of homogeneous slopes with piles were carried out to investigate the effect of piles length, piles location, piles diameter, slope angle, piles spacing and shear strength of clay soil on the distribution of lateral pressure acting on piles in slopes. The study was carried out using (2D PLAXIS, version 8.2) and (3D PLAXIS, version 2010) programs. In the analysis, elastic perfectly-plastic Finite Element Models based on Shear Strength Reduction Approach were used. The results were discussed and presented in terms of lateral pressure versus piles length at different cases. Moreover, the comparisons between the lateral pressure distribution using the FEM and that estimated using other methods was performed.
Keywords— Clay Slopes, Piles, Finite Element Method, Lateral Pressure
I. INTRODUCTION
Landslide occurs due to changes in geometry, external forces and loss of shear strength of the slope, the speed of soil movement may range from slow to very rapid or sudden. It might cause death and destruction to livestock and people along the path of movement such as the Holbeck land slide in North East of England in 1993, as shown in Fig. 1. Slope stabilization methods aim to reduce the driving forces, increase the resisting forces or suitably combine both. Row of piles is used as a mean of slope stabilization. It is subjected to lateral forces due to horizontal soil movement above the slip surface. Litterateur review illustrated that the increase of embedded pile length below the slip surface leads to increase the passive resistance pressure, which cause equilibrant state with
Ahmed Farouk4
Assoc. Professor in Structural Engineering Department, Tanta University, Egypt
the acting lateral pressure as shown in Fig. 2.The resultant of the passive resistance pressure (Rf)
provides more stability to the stabilized slope along its failure surface and prevent more excessive movement of soil slope.
Fig. 1.Holbeck landslide in North East of England in 1993. Weerasinghe et al. (2006) [11]
Fig. 2.Distribution of lateral pressure acting on piles in slope. Sobhey et al. (2015) [10]
The lateral pressure acting on a row of piles due to soil movement above the slip surface was estimated using many approaches in the litterateur review. Broms (1964) [2] derived equation (1) to estimate the lateral pressure developed on piles p (z) using (LEM) solution in clay soil slopes. However, these equations are not valid at very close spacing (S < 3D).
Vol. 5 Issue 1, January - 2019
Where, Np = the lateral capacity factor. Np = 2 (1 + z / D) 9
cu = the undrained shear strength parameter for clay soils.
z = the depth where the lateral pressure was evaluated.
Ito and Matsui (1975) [5] illustrated that; piles placed in plastically deforming ground (landslide mass movement) can prevent plastic deformations of soil slope as shown in Fig. 3. From the results, it was showed that the lateral pressures acting on the piles are dependent on the lateral soil movements. After that, Ito et al. (1975) [6] evaluated the lateral pressure p (z) per unit length in cohesive soils using derived equations (2) for rigid piles with infinite length.
P (z) = cu∗ (D1∗ (3 log D1
D2+
D1−D2
D2 ∗ tan
8) −
2(D1− D2)) +∗ z ∗ (D1− D2) (2)
Where, p (z) = lateral pressure.
D1 = spacing between center to center of piles. D2 = free spacing between piles
Z = depth of soil below ground surface
z = the depth that the lateral pressure was evaluated γ = unit weight of the soil
cu = undrained shear strength parameter
Fig. 3.Plastic state of soil just around piles. Ito and Matsui (1975) [5]
De Beer and Carpentier (1977) [3] evaluated the lateral pressure p (z) per unit length acting on a row of piles as following equation (3). In this method, the equations were integrated along the depth (Z) to obtain the total piles resistance (Rf).
These equations were derived for rigid piles with infinite length. In the case of clay soil, the equation was presented as follows:-
p (z) = cu∗ (D1∗ (2 lnD1
D2+
D1−D2
D2 ∗ tan
8) −
3
2(D1− D2)) + D1z (3) Where, D1 = spacing between center to center of
piles.
D2 = free spacing between piles.
Z = depth of soil below ground surface
Poulos (1995) [9] studied the resistances developed on a row of bored piles installed in clay soil slope using a (2D LEM) program. The results showed that
when the piles diameter increases, the resistance also increases. It concluded also, when the piles spacing ratio increase, the resistance decreases.
Kourkoulis et al. (2011) [7] investigated the effect of acting force on a row of piles at different piles spacing and the soil arching phoneme using 3D (FEM). It was showed that soil arching mobilized when the spacing between piles ratio (S/D) was less than 5 (S/D =2, 3 and 4). When (S/D) > 5, the soil flows between the piles and consider as a single separated pile.
Kourkoulis et al. (2012) [8] introduced a hybrid method for slope stability with piles, which combining the 3D Finite Element Model with Limit Equilibrium Method. Several studies estimate approximate values of the lateral pressure acting on a row of piles using different approaches have been reported. However few researchers studied the overall parameters that affecting on the values of the lateral pressure. Therefore, the aim of this research was to study and gain more understanding about the distribution of lateral pressure developed on a row of piles in clay slopes for diversity of parameters
II. NUMERICALMODEL
The numerical model has been validated using results reported by Abbas et al. (2008) [1], that made verification using 3D PLAXIS program of single pile subjected to lateral loading in the field in Kuwait city from Ismael (1998) data. The difference between results was convergent, which didn’t exceed 6 %. Extensive numerical models of slopes with piles were carried out to study distribution of lateral pressure on a row of piles in slopes for different parameters using (2D PLAXIS) and (3D PLAXIS) programs that are based on Shear Strength Reduction Method.
A. Clay Soil Slope Model
The triangular soil element in (2D PLAXIS) program was used to model the soil deposit. A plane strain model was used to model the slope stability geometries with a uniform cross section. The studied slopes consist of a homogeneous clay soil underlain by a bed of rock. Four undrained collected clay soil samples named (A, B, C and D), which were collected from a site near Motobas city, Kafr EL Shiek, Egyp, were considered to estimate the lateral pressure developed on a row of piles in different cases.
The Hardening model was used to model elastic- plastic behavior of the soil slope. The limiting states of stress were described by means of the friction angle Ф, the cohesion c, and the dilatancy angle Ψ. Soil stiffness were described by using four different input stiffness in the Hardening model, as: Plastic straining due to primary loading in the standard drained triaxial test, E50, the triaxial unloading stiffness, Eur , Plastic
straining due to primary compression, Eoed and the
Shear Strength, Atterberg Limits and Odemeter tests were performed to estimate the (HS) clay soils model parameters as shown in Table I.
TABLE I. ESTIMATED (HS) MODEL PARAMETERS OF CLAY SOILS
Soil Cod
e
Undraine d shear strength
(Cu) kPa
Secant stiffnes
s
(𝐸50𝑟𝑒𝑓)
kPa
Tangent stiffnes
s
(𝐸𝑜𝑒𝑑𝑟𝑒𝑓)
kPa
Reloadin g stiffness
(𝐸𝑢𝑟𝑟𝑒𝑓)
kPa
Soil
A 10 1899
2314 5697
Soil
B 14 2241
2724 6723
Soil C
35 6079 7397 18236
Soil D
40 8279 10075 24837
B. Row of piles model
Piles were made from R.C material with different diameters 0.7, 1, 1.2 and 1.5 m. The unit weight of the reinforced concrete (γc) is equal to 24 kN/m
3
, the module of elasticity of each pile is 22*106 kN/m2 and the Poisson's ratio (υc) was taken to be 0.2.
A row of piles with spacing 1D was considered in the 2D PLAXIS model as a continuous bored piles wall with an equivalent thickness (deq) in the long direction.
The equivalent thickness (deq) was determined by the
program according to the equation No. (4). Table II shows the properties of piles in (2D PLAXIS) model. 𝑑𝑒𝑞= √12 ∗
𝐸𝐼
𝐸𝐴 (4) In the other side, the spaced piles model was used in (3D PLAXIS) program as a beam element for case of pile diameter (P2) = 1m with different spacing 1D, 2D and 4D. It was modeled as a slender (one-dimensional) structure in the ground with a flexural rigidity (bending stiffness) and an axial stiffness. Table 3 shows the properties of piles in 3D PLAXIS model.
TABLE II. PILES PARAMETERS IN 2D PLAXIS PROGRAM
Pile s Co de
Piles Diamet ers (m)
Axial Stiffne ss (EA)
kN/m
Flexur al Rigidit
y (EI)
kN.m2/
m
Equival ent Thickn
ess
(deq) m
Weig ht Of plate
(w) kN/m
/m
P1 0.7 1.21e+
07
3.70e+ 05
0.606 14.54
P2 1 1.730e
+07
1.080e +06
0.866 20.7
P3 1.5 2.59e+
07
3.64e+ 06
1.29 31.17
TABLE III. PILES PARAMETERS IN 3D PLAXIS PROGRAM
Piles Code
Piles Diameters
(m)
Young modulus (Es)
kPa
Unit weight
(γc) kN/ m
3
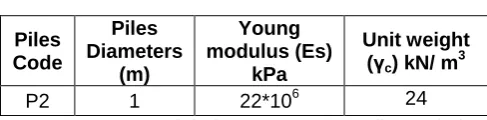
P2 1 22*106 24
Interfaces are special elements for the soil-foundation interaction in 2D PLAXIS and 3D PLAXIS programs. The interface strength was defined by the parameter (Rint). Suitable values of Rint the interaction between
clay soils and R.C piles was found to be 0.7. Gomes (2013) [4]
III. NUMERICAL ANALYSIS
The geometry of the studied clay slopes with piles is shown in Fig. 4. The boundary condition in all cases of clay slopes was evaluated to relief its effect on the results of the numerical model. Ninety seven series of tests were carried out to study the acting pressure on piles in clay slopes for different parameters using 2D and 3D PLAXIS models as shown in Fig. 5 and Fig. 6.
Fig. 4. The model geometry for variable parameters of the clay slope with piles
Fig. 5.The full geometry for 2D PLAXIS model
Vol. 5 Issue 1, January - 2019
The parameters include the piles length ratio (L/Lr), where, Lr is a reference diameter, equal to 1 m , piles diameter ratio (D/Dr), where, Dr is a reference diameter, equal to 1 m, piles spacing ratio (S/D),that modeled using (3D PLAXIS) program, slope angle (α), the undrained shear strength ratio of different clay soils types (cu / γ * H) and the piles location ratio from the slope crest (X * tan α / H) as shown in Table IV. The study was carried out for constant slope height (H) =10 m. Each serious was carried out to study the effect of one parameter while other parameters were kept constant.
TABLE IV. NUMERICAL MODEL TESTING MATRIX OF CLAY SLOPES WITH PILES
IV. RESULTSANDDISCUSSIONS
The depth of soil movement at different locations was measured from the numerical model output using (2D PLAXIS) program of clay slopes without piles. The depth of soil movement ratio (Z/H) , that defined as shown in Fig. 7 was plotted versus the different locations within clay slopes for slope height (H) =10 m, as shown in Fig. 8 . The results showed that the maximum depth of soil movement of clay slope was in the crest with (Z/H) ratio equal to 1.1.
Fig. 7.Definition of depth of soil movement ratio (Z / H).
Fig. 8.The depth of soil movement versus the locations within clay slopes for H/Hr=1.
For piles diameter ratio D/Dr = 0.7, the lateral pressure that developed on a row of piles for piles spacing ratio =1 was estimated using (2D PLAXIS) program and then was plotted versus the length of piles and with the other different studied parameters as the undrained shear strength ratio of clay soils (cu / γ * H), slope angle (α) and the location of piles ratio (X * tan α / H) with constant piles length ratio (L/Lr) =20 as shown in Fig. 9, Fig. 10 and Fig. 11.
Fig. 9.Lateral pressure versus piles length at (X * tan α /
H) = 0 and 0.25 for D/Dr = 0.7.
Fig. 10.Lateral pressure versus piles length at (X * tan α /
H) = 0.5 and 0.75 for D/Dr = 0.7.
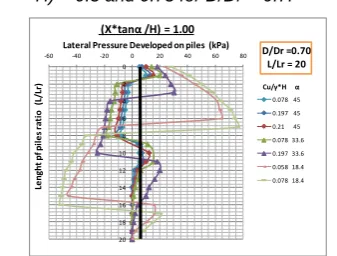
Fig. 11.Lateral pressure versus piles length at (X * tan α /
H) = 1.0 for D/Dr = 0.7.
For piles diameter ratio D/Dr equal to 1.0, the lateral
pressure that developed on piles for piles spacing ratio =1 was estimated using (2D PLAXIS) program, after that was plotted versus the piles length and the other studied parameters (cu / γ * H), (α) and (X * tan
α / H), that equal to 0, 0.25, 0.5 respectively with constant piles length ratio (L/Lr) =20 as shown in
Fig. 12 and Fig. 13. 0
0.2 0.4 0.6 0.8 1 1.2
0 0.25 0.5 0.75 1
De
p
th
o
f s
o
il
m
o
ve
m
e
n
t
(Z
/H)
Different locations within clay slopes (X*tanα/H)
H/Hr =1
0.058 45
0.078 45
0.195 45
0.078 33.6
0.195 33.6
0.058 26.5
0.078 26.5
0.058 18.6
0.078 18.6 Cu /γ*H α
0
2
4
6
8
10
12
14
16
18
20
-60 -40 -20 0 20 40 60 80
Le
n
gh
t
p
f p
il
e
s
ra
ti
o
(L/
Lr
)
Lateral Pressure Developed on piles (kPa)
(X*tanα /H) = 1.00
0.078 45
0.197 45
0.21 45
0.078 33.6
0.197 33.6
0.058 18.4
0.078 18.4
Cu/γ*H α
Fig. 12.Lateral pressure versus piles length at (X * tan α /
H) = 0 and 0.25 for D/Dr = 1.
Fig. 13.Lateral pressure versus piles length at (X * tan α /
H) = 0.50 for D/Dr = 1.
To investigate the effect of piles length ratio (L/Lr), the lateral pressures developed on piles for different (L/Lr) equal to 10 and 30 respectively were estimated using (2D PLAXIS) and plotted versus the length of piles ratios at (X * tan α / H) = 0.5 as shown in Fig. 14. The results showed, when the piles length ratio increases, the lateral pressure has significant increases at the same depth equal to 6 m, as shown in Fig. 15.
Fig. 14.Lateral pressure versus piles length at (X * tan α /
H) = 0.50 for L/Lr = 10 and 30.
Fig. 15.Vriation of lateral pressure versus piles length at (X * tan α / H) = 0.50 for D/Dr = 1.
For D/Dr ratio equal to 1.5, the lateral pressure was
estimated and then was plotted versus the piles length
with the other studied parameters (cu / γ * H), (α) and
(X * tan α / H), that equal to (0, 0.25 and 0.5) respectively at piles length ratio (L/Lr) = 20, as shown
in Fig. 16 and Fig. 17.
Fig. 16.Lateral pressure versus piles length at (X * tan α /
H) = 0 and 0.25 for D/Dr = 1.
Fig. 17.Lateral pressure versus piles length at (X * tan α /
H) = 0.50 for D/Dr = 1.
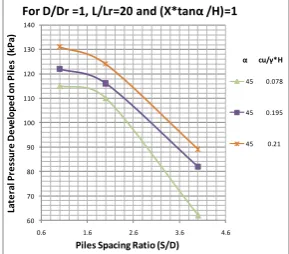
To obtain the effect of the piles spacing ratio (S/D) on the lateral pressured on piles, the (3D PLAXIS) program was used. At D/Dr = 1.0, the lateral pressure on piles was estimated at depth = 6 m to compare between the different pressures at the same level, (X * tan α / H) = 1 and (L/Lr) =20. As shown in Fig. 18, the (S/D) was plotted versus the lateral pressure for different (cu / γ * H) and constant (α) = 450. The Figure shows, the rise of (S/D) ratio leads to decrease the lateral pressure on piles due to the reduction of soil arching mechanism between piles.
Fig. 18.Variation of lateral pressure with piles spacing at (X * tan α / H) = 1, (L/Lr) =20 and D/Dr = 1.
Fig. 19 illustrates the relationship between the lateral pressure developed on piles at length = 6m, to make a comparison at the same level with different piles diameters ratio D/Dr.
The chart was plotted for different cases of the undrained shear strength ratios of clay (cu / γ * H) and 0 2 4 6 8 10 12 14 16 18 20
-160 -120 -80 -40 0 40 80 120 160 200240
Le n gh t p f p il e s ra ti o (L/ Lr )
Lateral Pressure Developed on piles (kPa)
(X*tanα /H) = 0.50
0.078 45 0.197 45 0.21 45 0.078 33.6 0.197 33.6 0.058 18.4 0.078 18.4 Cu/γ*H α
D/Dr = 1.0 L/Lr = 20
0 20 40 60 80 100 120 140 160 180
10 15 20 25 30
La te ra l P re ss u re De ve lo p e d o n p il e s ( kP a)
Lenght pf piles ratios (L/Lr)
(X*tanα /H) = 0.50
0.078 45
0.197 45
0.21 45
0.078 33.6
Cu/γ*H α
D/Dr = 1.0
0 2 4 6 8 10 12 14 16 18 20
-320 -240 -160 -80 0 80 160 240 320
Le n gh t p f p il e s ra ti o (L/ Lr )
Lateral Pressure Developed on piles (kPa)
(X*tanα /H) = 0.50
0.078 45 0.197 45 0.21 45 0.078 33.6 0.197 33.6 0.058 18.4 0.078 18.4 Cu/γ*H α
D/Dr = 1.5 L/Lr = 20
60 70 80 90 100 110 120 130 140
0.6 1.6 2.6 3.6 4.6
La te ra l P re ss u re De ve lo p e d o n P il e s ( kP a)
Piles Spacing Ratio (S/D)
For D/Dr =1, L/Lr=20 and (X*tanα /H)=1
45 0.078
45 0.195
45 0.21
Vol. 5 Issue 1, January - 2019
40 80 120 160 200 240 280
0.6 0.8 1 1.2 1.4 1.6
La
te
ra
l P
re
ss
u
re
De
ve
lo
p
e
d
o
n
P
il
e
s
(
kP
a)
Piles Diameter Ratio (D/Dr)
α = 45 0
0 0.078
0.25 0.078
0.5 0.078
0 0.195
0.25 0.195
0.5 0.195
0 0.21
0.25 0.21
0.5 0.21
(X*tanα /H) cu/γ*H
piles locations ratios (X * tan α / H) at slope angle (α) = 450.
The figure shows, the piles diameters ratio have a significant effect on the lateral pressure developed on piles in clay slopes. The piles diameters ratio (D/Dr)
has a significant effect on the values of lateral pressure, which was reached to be (2.5-3) times the pressure for D/Dr =0.7 in comparison of values at D/Dr
=1.5. From the results, it can be concluded that, the increase of piles stiffness leads to increase the lateral pressure capacity. The increase of the undrained shear strength of clay leads to increase the lateral pressure developed on piles.
In the Fig. 20, the effect of slope angle (α) and locations of piles on the lateral pressure on piles at length = 6 m were explained. The maximum value of lateral pressure on piles occurs at the crest of the slope, where the maximum depth of soil movement exists. When the slope angle decreases, the lateral pressure has significantly increases, as the depth of soil movement increases.
Fig. 19.Lateral pressure at length =6m versus the piles
diameter ratio at α =450
Fig. 20.Lateral pressure at length = 6m versus locations of piles at (cu/ γ *H) =0.078
V. COMPARISONSBETWEEN(FEM)RESULTS
ANDOTHERAPPROCHES
The comparisons between the lateral pressure acting on piles in clay slopes using the (FEM) results and using the other previous methods as Broms (1964), Ito et al. (1975) and De Beer and Carpentier (1977) approaches were carried out.
Fig. 21 shows the distribution of the lateral pressure on piles versus the depth of soil movement above the slip surface for different undrained shear strength of clay soils (cu / γ * H) equal to 0.078,0.197 and 0.21 respectively. The study was performed for slope angle (α) = 450, piles diameter ratio D/Dr =1 and piles spacing ratio S/D =2. The comparisons show that Broms (1964) and Ito et al. (1975) methods have over estimation than the (FEM) results. However, the estimated lateral pressure of De Beer and Carpentier (1977) approach is approximately compatible with the (FEM) results.
Fig. 21.Comparisons between lateral pressure using the (FEM) results and different previous methods a: for (cu / γ * H) = 0.078, b: for (cu / γ * H) = 0.195,
c: for (cu / γ * H) = 0.21
CONCLUSIONS
Extensive numerical models of different clay soil slopes with piles were performed to study the effect of diversity of parameters on the lateral pressure acting on row of piles. From the discussion of the previous results, it can be concluded the following:
As, the piles length ratio (L/Lr) increases, the lateral pressure significantly increases.
The rising of piles spacing ratio leads to decrease the lateral pressure
The piles diameters ratio (D/Dr) has a significant effect on the lateral pressure.
The maximum lateral pressure on piles occurs at the crest of the slope.
As, the slope angle decreases, the lateral pressure increases.
The lateral pressure results of (FEM) are approximately compatible with the De Beer and Carpentier (1977) approach results.
ACKNOWLEDGMENT
This study was supported by Geotechnical lab. in Tanta University and this support was gratefully acknowledged.
0 50 100 150 200 250 300 350 400 450
0 0.1 0.2 0.3 0.4 0.5
La
te
ra
l P
re
ss
u
re
De
ve
lo
p
e
d
o
n
P
il
e
s
(
kP
a)
Different Locations Within Clay Slopes (X*tanα/H)
Cu/γ*H =0.078
0.70 45
0.70 33.6
0.70 18.4
1.00 45
1.00 33.6
1.00 18.4
1.50 45
1.50 33.6
1.50 18.4
REFERENCES
[1] Abbas, M., Shafiqu, M. and Taha, R. (2008), “Effect of Shape and Slenderness Ratio on the Behavior of Laterally Loaded Piles”, the 1st Regional Conference of Eng., Vol.11, pp 19-27. [2] Broms, B.B. (1964), “Lateral Resistance of Piles in
Cohesive Soils”, Journal for Soil Mechanics and Foundation Engineering, ASCE, Vol. 90, SM2, pp. 27-64.3.
[3] De Beer, E. and Carpentier, R. (1977), “Discussions: Methods to Estimate Lateral Force Acting on Stabilizing Piles”, Soils Found, Vol. 17(1), pp. 68-82.
[4] Gomes, M. A. (2013), “Determination of stresses around a cylindrical single pile caused by
horizontal movements of soft soils with the finite element method”, Master of Science Thesis in Stuttgart University, Portugal.
[5] Ito, T. and Matsui, T. (1975), “Methods to estimate lateral force acting on stabilizing piles”, Soil and Foundation, Vol.15 (4), pp.43–60.
[6] Ito, T., Matsui, T. and Hong, W. P. (1975), “Design method for the stability analysis of theslope with landing pier”, Soil and Foundation, Vol. 19(4), pp.43–57.
[7] Kourkoulis, R., Gelagoti, F., and Gazetas, G. (2011), “Slope stabilizing piles and pile-groups”, Geotechnical and Geonvironmental Engineering, Vol. 137(7), pp. 663–678.
[8] Kourkoulis, R., Gelagoti, F., Anastasopoulos, I., and Gazetas, G. (2012), “Hybrid method for analysis and design of slope stabilizing piles”, Geotechnical and Geoenvironmental Engineering Journal, ASCE. Vol. 138, No. 1, pp. 1-14.
[9] Poulos, H. G. (1995), “Design of reinforcing piles to increase slope stability”, Geotechnical Engineering, Vol. 32(5), pp. 808–818.
[10] Sobhey, M., Shahine, M., EL Sawwaf, M., and Farouk, A. (2015) “A numerical study of sandy slopes with piles”, Inter. Con. on Advances in Structural and Geotechnical Eng.
[11] Sobhey, M., EL Sawwaf, M. Shahine, M., and Farouk, A. (2016) “Slope stability with piles”, Master of Science thesis in Tanta University, Egypt.
![Fig. 1. Holbeck landslide in North East of England in 1993. Weerasinghe et al. (2006) [11]](https://thumb-us.123doks.com/thumbv2/123dok_us/8356096.1668937/1.595.340.523.485.583/fig-holbeck-landslide-north-east-england-weerasinghe-et.webp)
![Fig. 3. Plastic state of soil just around piles. Ito and Matsui (1975) [5]](https://thumb-us.123doks.com/thumbv2/123dok_us/8356096.1668937/2.595.42.285.249.500/fig-plastic-state-soil-just-piles-ito-matsui.webp)