Vol. 3 Issue 3, March - 2017
New Method For Determining The Angular
Position Of The Light Reflection Intensity
Minimum Observed In Surface Plasmon
Resonance
Volodymyr Maslov
Department of Physics and technological bases of sensory materials
V.Lashkaryov Institute of Semiconductor Physics NAS of Ukraine
Kyiv, Ukraine e-mail: [email protected]
Yuriy Ushenin
Department of Physics and technological bases of sensory materials
V.Lashkaryov Institute of Semiconductor Physics NAS of Ukraine
Kyiv, Ukraine e-mail: [email protected]
Glib Dorozhinskyi
Department of Physics and technological bases of sensory materials
V.Lashkaryov Institute of Semiconductor Physics NAS of Ukraine
Kyiv, Ukraine
e-mail: [email protected]
Anna Dorozhinska
Department of Scientific, Analytical and Ecological Instruments and Systems
National Technical University f Ukraine “Igor Sikorsky Kyiv Polytechnic Institute”
Kyiv, Ukraine
e-mail: [email protected]
Alexander Kudryavtsev
Department of photochemical phenomena in semiconductors
V.Lashkaryov Institute of Semiconductor Physics NAS of Ukraine
Kyiv, Ukraine
e-mail: [email protected]
Abstract—The method of mean line offered in this work to determine the angular position of minimum in the SPR reflection curve provides more than 6-fold decrease in the measurement error as compared with the known method of polynomial approximation. For the chosen two wavelengths 700 and 970 nm, the value of the absolute error is decreased by 217 and 300 times, respectively, which is obviously related with the geometric shape of reflection characteristic.
Keywords—surface plasmon resonance, angular position of the light reflection intensity minimum
I. INTRODUCTION
Observed in recent decades is intensive development of facilities based on phenomenon of surface plasmon resonance (SPR) [1, 2] both in fundamental researches and in practical determination of small biological or chemical components in gases and liquids [3], molecular recognition, detection of immune diseases etc [4 – 7]. Plasmons are quasi-particles describing oscillations of electron gas in conducting materials [8]. Resonance excitation of these oscillations by an electromagnetic wave in a thin layer of conducting material placed between two media with different refraction indexes obtained the name “surface plasmon resonance” [9].
II. CONDITIONS FOR SPR APPEARANCE
Appearance of SPR is possible when conditions of total internal reflection (TIR) [9] are kept in the system consisting of transparent dielectric material with a high refraction index and a thin gold film covering its surface. The opposite side of the gold film is in contact with the analyzed medium. Preferable usage of gold in these systems is related with its high chemical durability and electrical conduction [10].
Under TIR conditions, the electric field of electromagnetic wave penetrates into the optically less dense medium but only to the distance comparable with the light wavelength. If in this case the boundary between two media contains a layer of conducting material with the thickness less than the exciting light wavelength, then the electric field penetrating into it causes oscillations of free electrons in this material. To realize efficient excitation of these oscillations, the light frequency should be lower than the intrinsic frequency of electron oscillations (i.e., lower than the plasma frequency) [10, 12]. Therefore, to excite SPR in metal films, one should use the light from the visible and near infrared spectral ranges, since the plasma frequency for most of metals lies closer to the ultraviolet range.
Vol. 3 Issue 3, March - 2017
plasmon impulse vector. The parameters of the first vector depend on the frequency of light and its angle of incidence, while those of the second vector depend on the properties of conducting material and refraction indexes of adjacent media. When these resonance conditions are fulfilled, the intensity of reflected light is sharply decreased due to partial transfer of light wave energy to the plasmon one. Minimal departure of the refraction index caused by changes in medium composition near this boundary results in changes of the SPR conditions. It enables, for example, to detect appearance of complexes at this boundary in the real-time mode by registering parameters of the reflected wave. As the registered parameters, one can use the resonance frequency of exciting light for a fixed angle of its incidence or the resonance angle of beam incidence for a fixed light frequency as well as the light amplitude or its phase.
One condition more for efficient plasmon excitation is related with polarization of exciting light. Electron oscillations are mainly excited by the electric component of electromagnetic wave. Thefore, the strongest interaction with electrons in the conducting layer is inherent to the plane-polarized wave, the electric vector of which is parallel to the plane of incidence (p-polarization). Since the s-polarized wave weakly interacts with plasmons, SPR systems mainly use the s-polarized light [14].
The SPR sensitivity to changes in the refraction index depends on the amplitude of the plasma wave field, which exponentially decreases when increasing the distance from the surface. For this reason, SPR is the most sensitive to changes taking place directly at the boundary between both media. To describe the thickness of this sensitive layer, one uses the conception of “field penetration depth”, that is the distance corresponding to the decrease in the field amplitude by e (base of Napierian logarithm) times. This parameter increases with the wavelength. For instance, in the system gold-dielectric with the refraction index value 1.32, it is possible to enhance the penetration depth from 100 up to 600 nm by varying the exciting light wavelength between 600 and 1000 nm [15].
III. CONSTRUCTION OF THE SPR DEVICE AND METHODS FOR MATHEMATICAL PROCESSING THE EXPERIMENTAL RESULTS
The overwhelming majority of SPR devices is created using the Kretschmann geometry (Fig. 1a), the optical scheme of which consists of the laser 1, prism of total internal reflection 2, sensitive element 3 and photodetector 4 [16]. Detemination of the minimum position for the resonant curve (Fig. 1b) is reached by its mathematical processing.
a
b
Fig. 1. (a) Optical setup in accord with the Kretschmann geometry: 1 – laser; 2 – prism; 3 – sensitive element; 4 – photodetector [17]. (b) Angular dependences of the reflected light intensity at the boundary sensitive element – analyte before (–) and after (---) changing the analyte refraction index by the value Δn.
This work is aimed at development of mathematical methods for determination of the minimum angular position R(θ). The authors have offered a new method named by them as the “method of mean line”. This approach enables to reduce the error in calculation of the analyte refraction index. The method does not foresee such an additional processing as approximation or averaging. It allows direct processing the experimental data by using only simple arithmetic, namely, determination of the bisecting point of a segment as well as a cross point for two straight lines.
The absolute error of measuring the angular minimum position R(θ) influences on the value of analyte refraction index. The reflection characteristic is measured with a finite angular step of scanning, which defines the initial value of absolute error that can be reduced using the procedure of its minimum approximation. The absolute error of approximation depends on symmetry and halfwidth of the reflection characteristic minimum.
Vol. 3 Issue 3, March - 2017
considerable limitation of the approximation part height (no higher than 5%).
Studied in [20] was the influence of the approximating polynomial power on the error in determination of the minimum position within the range of wavelengths 650 to 1200 nm. It was shown that the reflection characteristic essentially changes its halfwidth, therefore, the angular range of approximation was chosen in proportion to the reflection characteristic width at the amplitude level 20%. The absolute error diminished along the exponent (δn (λ) = 0.121 ∙ e-0.01λ) with increasing the wavelength from 500 up to 1200 nm. It was within the limits (2...3.5) ∙ 10-5 in the wavelength range 850 to 1200 nm, which was explained by higher symmetry and narrowness of the R(θ) characteristic in the vicinity of its minimum.
Applying this approximation increases the accuracy of measurements but complicates the procedure of calculating the minimum position of R(θ) curve. One deficiency more of this method is an essential dependence of the approximation error on the wavelength when operating in the visible range, which makes this method to be non-universal.
Let us consider the advantage of the method offered in this work when determining the angular minimum position of the SPR reflection curve in comparison with known methods.
Estimation of the influence of mathematical methods on the value of absolute error for the analyte refraction index was performed by plotting a theoretical reflection curve for the multilayer system “transparent substrate (glass) – metal layer – dielectric (analyte) – ambient medium” and p-polarized incident monochromatic radiation. This characteristic R(θ) was calculated as a function of the angle of incidence by using the Fresnel formulae and mathematical formalism of the Jones scattering matrixes [21] as well as methods described in [22, 23].
Compared were two methods for determining the exact SPR minimum position, namely: the new one offered by the authors (method of the mean line) and the method providing approximation with polynomials of the 2-nd and 3-rd powers in accord with the technique described in [20]. Processed in both cases was not the whole reflection characteristic but only its small part around the minimum. The reflection characteristics emulating the real ones were plotted with the step 0.02 degree, which corresponds to the step of angular measurements typical for the device “Plasmon-6” [24].
To determine the minimum position in the method of mean line, the range of angles between ±0.25 to ±0.75 degree near minimum was set experimentally with account of growing wavelength. In doing so, we followed the criterion of a minimal value for the absolute error corresponding to every wavelength value within the range 600 to 1100 nm with the step 25 nm [25 – 27]. When using the method of polynomial approximation, the range of angles was kept constant and equaled to 0.46 degree. As a reference for comparison, we used values of minima in the plots of
reflection characteristics drawn with the step 0.0001 degree for the respective wavelengths.
In the mean-line method, the minimum angular position was determined as a cross point of the coordinate axis for angles of incidence and the straight line drawn through the middles of segments joining the points of equal intensity on the left and right slopes of the reflection curve.
To study reflection and transmission of polarized light in a multilayer film placed between semi-infinite medium and substrate for the case of inclined light incidence, we used the scattering matrix S(1) of the form 2 × 2 [21]. The planar structure of this matrix consists of m parallel layers (designated as 1, 2, 3, ..., j, m) located between two semi-infinite media: the ambient one (0) and substrate (m + 1). Let us assume that these media are linear, homogeneous and isotropic, and the complex refraction index of the j-th layer is Nj, and its thickness is dj. The refraction
indexes of the medium and substrate are N0 and Nm+1,
respectively. ) 1 ( ) 1 ( 2 12 1
10
....
....
I
L
I
L
I
j jL
jL
mI
m mS
(1)
The scattering matrix is defined as a product of matrixes for the boundaries Iab between the adjacent layers a and b as well as matrixes for the respective layers L (2) [21]:
I
rab
rab
ab
1
1
0 0 j j i e i e L (2) where rab is the reflection coefficient for the
respective boundary; βj – phase thickness of the
respective layer (3) [21]
j j
d
N
2
cos
(3) Nj=nj - ikj – complex refraction coefficient of the
layer, dj – angle of incidence inside the j-th layer, dj –
its thickness, λ – wavelength. The integrated Fresnel reflection coefficient for the layered structure and p-polarization is defined by the elements of the first column in the scattering matrix (4) [21]:
Vol. 3 Issue 3, March - 2017
Using the expression for the integrated reflection coefficient Rp, we plotted the reflection characteristics
R(θ) by applying numeric modeling, and these characteristics were further used for a numeric analysis of the error range of the analyte refraction index. This numeric modeling the reflection characteristic R(θ) was performed using the initial parameters of the optical setup inherent to the device “Plasmon-6” (developed in V. Lashkaryov Institute of Semiconductor Physics, NAS of Ukraine) as based on the multilayer model describing light propagation from the laser to photodetector through the system “semi-pentaprism (glass) – metal layer – dielectric external medium (analyte)”.
To apply the multilayer model, we consider the optical system consisting of three plane-parallel layers with the optical parameters n, k, d at the temperature 20 °С for the respective wavelengths. The scheme for SPR excitation arranged in accord with the Kretschmann geometry based on the TIR prism possessing the refraction index np represented the first
layer in the form of semi-infinite medium. The second layer corresponded to metal where the surface plasmons with parameters nМ, kМ, dМ were excited. The third layer was analyte with parameters nv, kv, also
in the form of semi-infinite medium.
Within the framework of offered method, mathematical modeling was performed in the range of wavelengths from 600 up to 1100 nm. In this case, we chose the optimal thickness of the layer (50 nm), where plasmons were excited, to reach the lowest value of the reflection coefficient in the minimum of resonance curve (Fig. 2a). The spectral diapason corresponded to the necessary range of angles observed for the SPR minimum (wider than 7 degrees), since decreasing the wavelength results in the shift of reflection characteristic minimum to the side of larger angles, while the range of measurements in “Plasmon” devices is limited by the value 74 degree (Fig. 2b).
a
b
Fig. 2. Dependences of the optimal metal layer thickness for the SPR sensitive element (a) and dynamic range for measuring the SPR minimum angles (b) on the wavelength of plasmon excitation.
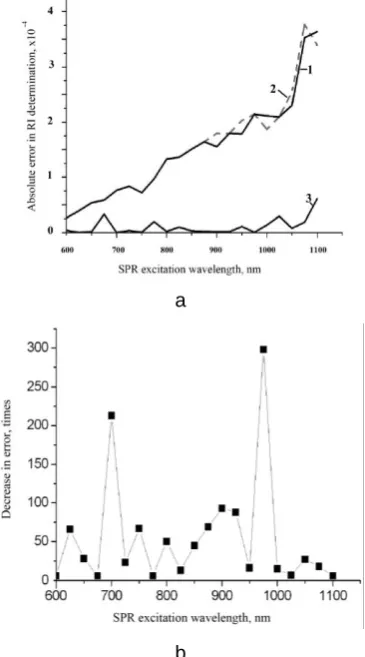
The results of modeling showed that in the method of polynomial approximation the error value grows with increasing the excitation wavelength (Fig. 3a), which is related with non-parabolicity of the reflection characteristic. At the same time, in the mean-line method the absolute error values are, at least, 6-fold lower than in the method of polynomial approximation (Fig. 3b).
a
b
Vol. 3 Issue 3, March - 2017
The highest positive effect of applying the mean-line method has been reached for two wavelengths 700 and 970 nm, which is probably related with the graphic shape of reflection characteristics. The value of the absolute error is decreased by 217 and 300 times for these wavelengths, respectively.
IV. CONCLUSIONS
The method of mean line offered in this work to determine the angular position of minimum in the SPR reflection curve provides more than 6-fold decrease in the measurement error as compared with the known method of polynomial approximation. For the chosen two wavelengths 700 and 970 nm, the value of the absolute error is decreased by 217 and 300 times, respectively, which is obviously related with the geometric shape of reflection characteristic.
REFERENCES
[1] I.D. Voitovich, V.M. Korsunskyi. Sensors based on plasmon resonance: principles, tecnologies, applications. Kyiv, “Stal’”, 2011, 534 p. (in Russian).
[2] Surface Plasmon Resonance Based Sensors/Volume Editor: Jirі Homola. In: Springer Series on Chemical Sensors and Biosensors, Series Editor: O. S.Wolfbeis, Springer-Verlag, Berlin Heidelberg 2006, 253 p.
[3] Yi-Pin Chang, Yen-Ho Chu. Mixture-Based Combinatorial Libraries from Small Individual Peptide Libraries: A Case Study on α1-Antitrypsin Deficiency // Molecules. – 2014. – Vol.19. – PP. 6330-6348.
[4] Paul Roach, David J. McGarvey, Martin R. Lees, Clare Hoskins. Remotely Triggered Scaffolds for Controlled Release of Pharmaceuticals // International Journal of Molecular Sciences. – 2013. – Vol.14. – PP. 8585-8602.
[5] Ktari T., Baccar H., B.Mejri M., and Abdelghani A. Calibration of Surface Plasmon Resonance Imager for Biochemical Detection // International Journal of Electrochemistry. – 2012. – PP.1-5.
[6] L. Mocan, I. Ilie, C. Matea, F. Tabaran, E. Kalman, C. Iancu, T. Mocan. Surface plasmon resonance-induced photoactivation of gold nanoparticles as bactericidal agents against methicillin-resistant Staphylococcus aureus // International Journal of Nanomedicine. – 2014. – Vol.9. – PP. 1453-1461.
[7] Hsu S.-H., Lin Y.-Y., Lu S.-H., Tsai I-F., Lu Y.-T., Ho H.-T. Mycobacterium tuberculosis DNA Detection Using Surface Plasmon Resonance Modulated by Telecommunication Wavelength // Sensors. – 2014. – Vol.14. – PP. 458-467.
[8] D.V. Sotnikov, A.V. Zherdev, B.B. Dzantiyev. Detection of intermolecular interactions based on registration of surface plasmon resonance // Uspekhi biologicheskoi khimii, V. 55, p. 391 – 420, 2015 (in Russian).
[9] Schasfoort R.B.M., Tudos A.J. (eds.). (2008) Handbook of Surface Plasmon Resonance. Cambridge: The Royal Society of Chemistry, 403 p.
[10] Biacore Sensor Surface Handbook. (2005) Uppsala: GE Healthcare Bio-Sciences AB, 100 p.
[11] Lakowicz, J.R. (2006) Plasmonics in biology and plasmon-controlled fluorescence, Plasmonics, 1, 5–33.
[12] Oates, T.W.H., Wormeester, H., Arwin, H. (2011) Characterization of plasmonic effects in thin films and metamaterials using spectroscopic ellipsometry, Progress in Surface, 86, 328-376
[13] Li, M., Cushing, S.K., Wu, N. (2015) Plasmon-enhanced optical sensors: a review, Analyst, 140, 386–406
[14] Brongersma, M.L., Kik, P.G. (eds.). (2007) Surface Plasmon Nano photonics. Springer Series in Optical Sciences. vol. 131. Berlin: Springer Science, 268 p.
[15] Homola, J. (2008) Surface plasmon resonance sensors for detection of chemical and biological species, Chemical Reviews, 108, 462– 493.
[16] Kretschmann, E. and Reather, H. Radiative decay of nonradiative surface plasmon excited by light. Z.Naturf. 23A: 2135-2136; (1968).
[17] Shalabney, A. Electromagnetic field distribution in multilayer thin film structures and the origin of sensitivity enhancement in surface plasmon resonance sensors / A. Shalabney, I. Abdulhalim // Sensors and Actuators A. – 2010. – Vol. 159. – P. 24-32.
[18] G.V. Dorozhinskyi. Sensor devices based on surface plasmon resonance. Monograph / G.V. Dorozhinskyi, V.P. Maslov, Yu.V. Ushenin // Kyiv, National Technical University of Ukraine “KPI”, 2016. 264 p. ISBN 978-966-622-752-5 (in Ukrainian).
[19] Yu.M. Shirshov, A.V. Samoilov, R.V. Khristosenko, Yu.V. Ushenin, V.M. Mirskyi. Analysis and numeric modelling the SPR spectrometers with mechanical scanning by the angle: algorithm for determination of the angular minimum position // Reyestratsiya, zberigannya i obrobka danykh, 6, No 3, p. 3 – 18 (in Ukrainian).
[20] G.V. Dorozhinskyi. Analysis of main errors in measurements of the analyte refraction index by using the device “Plasmon-6” // East European Scientific Journal. – 2016. – Vol. 5. – P.54-61.
[21] R. Azzam. Ellipsometry and polarized light / R. Azzam, N. Bashara. Moscow, “Mir”, 1981, 583 p. (in Russian).
[22] Chegel V. I. Experimental investigations and computer modelling of the photochemical processes in Ag-As2S3 structures using surface plasmon resonance spectroscopy / V. I. Chegel, Yu. M. Shirshov, S. O. Kostyukevich [et al.] // Semiconductor Physics, Quantum Electronics & Optoelectronics. – 2001. – Vol. 4 (4). – PP. 301–306.
[23] P. Drude. Ellipsometrie // Ann. Phys. Chem. – 1890. – Vol.39. - P.481.
[24] Ye. F. Venger. Spectrometer of surface plasmon resonance “Plasmon-6” / Ye. F. Venger, S.A. Zynio, Ye.P. Matsas, A.V. Samoylov, Yu.V. Ushenin et al. // Abstracts of reports of the scientific-practical conference SENSOR-2007 (Odesa, Ukraine), p. 111, 2007.
[25] www.schott.com.
![Fig. 1. (a) Optical setup in accord with the Kretschmann geometry: 1 – laser; 2 – prism; 3 – sensitive element; 4 – photodetector [17]](https://thumb-us.123doks.com/thumbv2/123dok_us/8357168.1669446/2.595.325.542.61.341/optical-setup-accord-kretschmann-geometry-sensitive-element-photodetector.webp)