Bharathi et al. World Journal of Pharmaceutical and Medical Research
METHOD DEVELOPMENT AND VALIDATION FOR SIMULTANEOUS ESTIMATION
OF L-METHYL FOLATE & ESCITALOPRAM BY RP-HPLC METHOD
Vardhanapu Mary Bharathi*, Dr. Devanaboyina Narendra, Gadi Vijaya Lakshmi, Yendamuri Narayudu, Penumantra Venkata Kishore
Department of Pharmaceutical Analysis & Quality Assurance VJ’S College of Pharmacy, Diwancheruvu, Rajamahendravaram, Andhra Pradesh-533296.
Article Received on 02/08/2019 Article Revised on 23/08/2019 Article Accepted on 13/09/2019
INTRODUCTION
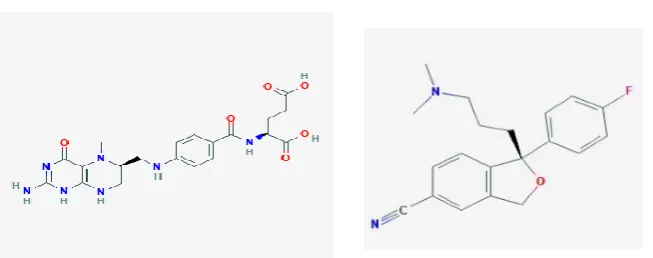
Chemically L-MethylFolate (L-MF) was an 5-methyltetrahydrofolic acid is a methylated derivate of tetrahydrofolate. It is generated by methylenetetra hydrofolate reductase from 5,10-methylenete trahydrofolate and used to recycle homocysteine back to methionine by 5-methyltetrahy drofolate-homocysteine methyltransferases Molecular weight and Molecular formula of L-MF were 459.463 g/mol, C20H25N7O6 respectively. L-methylfolate is the only metabolite of folate that can cross the blood-brain barrier, and it is this form that can directly impact several important CNS reactions, most notably the synthesis of three important neurotransmitters: serotonin, norepinephrine, and dopamine.Structure of the L-MF was shown in figure 1 (A).[1]
Chemically Escitalopram (EST) was an 1S)-1-[3- (dimethylamino)propyl]-1-(4-fluorophenyl)-1,3-dihydro-2-benzofuran-5 -carbonitrile.Molecular weight and Molecular formula of EST were 324.3919g/ mol C20H21FN2O respectively. The upper,
antiobsessive-urgent, and antibulimic activities of escitalopram are attempted to be connected to its hindrance of CNS neuronal take-up of serotonin. Escitalopram obstructs the
reuptake of serotonin at the serotonin reuptake pump of the neuronal film, improving the activities of serotonin on 5HT1A autoreceptors. SSRIs tie with altogether less liking to histamine, acetylcholine, and norepinephrine receptors than tricyclic energizer drugs..Structure of the EST was shown in figure 1 (B).[2]
Literature survey reveals there are several methods to estimated thee drugs in single or in combination of two drugs.[5-9] but there is only very few HPLC methods are available for simultaneous estimation of L-MF and EST, so the scope of developing and alidating an analytical method is to ensure a suitable method for a particular analyte to be more specific, accurate and precise. The main objective for that is to improve the conditions and parameters, which should be followed in the development and validation processes.
ISSN 2455-3301
WJPMR
AND MEDICAL RESEARCH
www.wjpmr.com*Corresponding Author: Vardhanapu Mary Bharathi
Department of Pharmaceutical Analysis & Quality Assurance VJ’S College of Pharmacy, Diwancheruvu, Rajamahendravaram, Andhra Pradesh-533296.
ABSTRACT
A simple, Accurate, precise method was developed for the simultaneous estimation of the L-methyl folate and Escitalopram in Tablet dosage form. Chromatogram was run through Waters C18 150 x 4.6 mm, 5. Mobile phase containing Buffer 0.01N KH2PO4 (3.45pH): Acetonitrile taken in the ratio 50:50 was pumped through column at a flow rate of 1.0 ml/min. Buffer used in this method was 0.01N KH2PO4. Temperature was maintained at 30°C. Optimized wavelength selected was 212 nm. Retention time of L-methyl folate and Escitalopram were found to be 2.263min and 3.079min. %RSD of the L-methyl folate and Escitalopram were and found to be 0.2 and 0.5 respectively. %Recovery was obtained as 99.79% and 100.54% for L-methyl folate and Escitalopram respectively. LOD, LOQ values obtained from regression equations of L-methyl folate and Escitalopram were 0.24, 0.29 and 0.72, 0.87 respectively. Regression equation of L-methyl folate is y = 22979x + 8347. and y = 31569x + 3873. of Escitalopram. Retention times were decreased and run time was decreased, so the method developed was simple and economical that can be adopted in regular Quality control test in Industries.
Figure 1: Structure of (A) L-Methyl Folate (B) Escitalopram.
MATERIALS AND METHODS
Reagents and Chemicals: The pharmaceutical drug samples of L-MethylFolate and Escitalopram were obtained from Spectra Pharma Pvt. Ltd., Hyderabad. All the chemicals and solvents were used as HPLC grade. The pharmaceutical dosage form was purchased from local pharmacy.
Instrumentation: HPLC (waters 2695) system with Empower-2 software and 2996 module photo diode array detector equipped with a quaternary solvent delivery pump, automatic sampler unit, Discovery C18 150x4.6mm, 5m. As part of experimentation, additional equipment such as sonicator (ultrasonic cleaner power sonic 420), pH meter, vacuum oven (wadegati), water bath and other glassware were used for the present investigation.
Chromatographic conditions: The Discovery C18 150x4.6mm, 5m column was used for analytical separation. Potassium dihydrogen ortho phosphate and one drop of triethyl amine in every 100ml of buffer solution (pH3.0) and Acetonitrile was taken in the ratio of (50:50%v/v) mobile phase for the investigation with a flow rate of a 1.0ml/min. The temperature was maintained at 300C. The injection volume was 10μl and the UV detection was achieved at 212nm.
Preparation of potassium dihydrogen ortho phosphate buffer (pH:3.0): Accurately weighed 1.36gm of Potassium dihyrogen Ortho phosphate in a 1000ml of Volumetric flask add about 900ml of milli-Q water added and degas to sonicate and finally make up the volume with water then PH adjusted to 3.45 with dil. Orthophosphoric acid solution.
Preparation of mobile phase
Mixture of 600 ml of 0.01N KH2PO4 buffer (pH-3.5) and
400 ml of Acetonitrile in the ration of 50:50 v/v were mixed and degased in ultrasonic water bath for 15 minutes and filtered through 0.45 µ filter paper. Mobile phase was used as a diluent
Preparation of mixture Standard stock solution: Accurately weighed 7.5 mg of L-methyl folate, 10 mg of Escitalopram and transferred to individual 25 ml volumetric flasks separately. 3/4 th of diluents was added
to both of these flasks and sonicated for 10 minutes. Flasks were made up with diluents and labeled as Standard stock solution 1and 2. (300µg/ml of L-methyl folate and 400µg/ml of Escitalopram).
Preparation of Sample (Tablet) stock solutions: 5 tablets were weighed and the average weight of each tablet was calculated, then the weight equivalent to 1 tablet was transferred into a 50 ml volumetric flask, 5ml of diluents was added and sonicated for 25 min, further the volume was made up with diluent and filtered by HPLC filters (150µg/ml of L-methyl folate and 200µg/ml of Escitalopram).
Optimized chromatographic conditions Column Used: Discovery C18 150 x 4.6 mm, 5.
Mobile phase: buffer: Acetonitrile (50:50 v/v) Flow rate: 1 .0ml/min
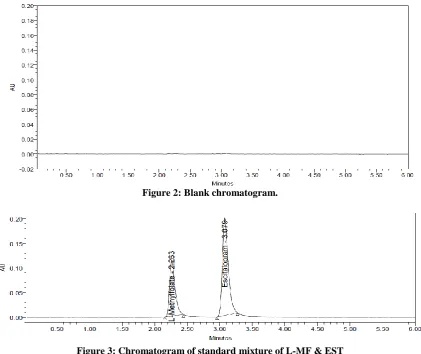
Figure 2: Blank chromatogram.
Figure 3: Chromatogram of standard mixture of L-MF & EST
Peak Name RT Area USP Tailing USP Resolution USP Plate Count
1 L-Methyl Folate 2.263 669291 1.43 5 3758.0
2 Escitalopram 3.079 1279118 1.35 4.9 6040.0
Figure 4: Chromatogram of sample mixture of L-MF & EST.
Validation
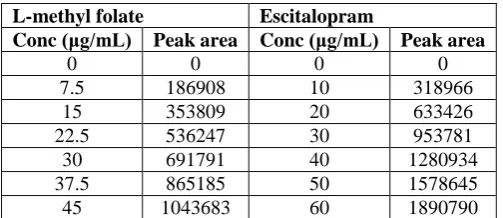
The above optimized chromatographic method has been validated for the assay of L-MF & EST using the following parameters [International Conference on Harmonization (ICH) 1995]. Linearity was studied to find out the relationship of concentration with Peak area. Six different concentrations of L-Methylfolate and Escitalopram (L-MF & EST)drug mixtures respectively. Each concentration of solution was injected into the HPLC and chromatogram was recorded. The calibration graph was constructed by plotting the peak versus the
model mixtures containing 80,100 and 120% of L-Methylfolate & Escitalopram. After the measurement, the Amount found and individual recoveries were calculated. Limit of Detection (LOD) and Limit of Quantification (LOQ) were calculated based on the linearity data using the formulae LOD = 3.3×standard deviation /slope; LOQ = 10×standard deviation /slope. Robustness was performed by following the same method with different flow rate.
RESULTS AND DISCUSSION
The regression equation for L-MF was found to be y = 22979x+8347 (slope, intercept and correlation coefficient were found to be 22979, 8347 and 0.999 respectively) and linear over beer’s range of 5-30 µg/ml. The regression equation for EST was found to be y = 31569x + 3873 (slope, intercept and correlation coefficient were found to be 31569, 3873 and 0.999 respectively) and linear over beer’s range of 12.5-75 µg/ml. Linearity graph of L-MF & EST were shown in Figure 5 , 6 & 7 respectively. Linearity data was shown in table 1. The precision and ruggedness were determined using the % RSD of the peak area for six replicate preparations of the drug. %RSD of system precision for L-Methylfolate and Escitalopram were and found to be 0.2 and 0.5 respectively. %RSD of method
precision for L-Methylfolate and Escitalopram were and found to be 0.3 and 0.3 respectively. % recovery was obtained as 99.78% and 100.54% for L-Methylfolate and Escitalopram respectively. The calculated RSD values were less than 1. Precision and ruggedness data are presented in Table 2. In order to verify the accuracy of the described method, recovery studies were carried out by analyzing model mixtures contained 50%, 100% and 150% of standard solution of drug L-MF & EST and along with 5 μg/mL of placebo solution within the linearity ranges. The mean percentage recoveries were found to be 99.78% and 100.54%w/w for 50%, 100% and 150% respectively.. The results of accuracy were shown that the developed method have a good percentage recovery at different concentrations of drugs. LOD for L-MF and EST was found to be 0.24 μg and 0.29 μg respectively. LOQ for L-MF and EST was found to be 0.72 μg and 0.87 μg respectively. Summary of all the validation parameter shown in table 4.
Degradation
Degradation studies were performed with the formulation and the degraded samples were injected. Assay of the injected samples was calculated and all the samples passed the limits of degradation.
Table 1: Linearity table for L-MF and EST.
L-methyl folate Escitalopram
Conc (μg/mL) Peak area Conc (μg/mL) Peak area
0 0 0 0
7.5 186908 10 318966
15 353809 20 633426
22.5 536247 30 953781
30 691791 40 1280934
37.5 865185 50 1578645
45 1043683 60 1890790
Table 2: System precision table of L-MF & EST.
S. No Area of L-methyl folate Area of Escitalopram
1. 670443 1278518
2. 667529 1275071
3. 669678 1273444
4. 668112 1286570
5. 670475 1281259
6. 669511 1270440
Mean 669291 1277550
Table 3: degradation data of L-MF & EST.
Type of degradation
L-methyl folate Escitalopram
AREA % Recovered % Degraded AREA %Recovered % Degraded
Acid 621255 92.45 7.55 1176708 91.92 8.08
Base 643728 95.80 4.20 1180516 92.22 7.78
Peroxide 646620 96.23 3.77 1203381 94.01 5.99
Thermal 653460 97.24 2.76 1248035 97.49 2.51
Uv 658733 98.03 1.97 1257566 98.24 1.76
Table 4: summary of validation data of L-MF & EST.
Parameters L-methyl folate Escitalopram LIMIT
Linearity Range (µg/ml) 7.5-30µg/ml 10-40 µg/ml R< 1
Regressioncoefficient 0.999 0.999
Slope(m) 22979 31569
Intercept(c) 8347 3873
Regression equation (Y=mx+c) y = 22979x + 8347. y = 31569x + 3873.
Assay (% mean assay) 99.41% 99.58% 90-110%
Specificity Specific Specific No interference of any peak
System precision %RSD 0.2 0.5 NMT 2.0%
Method precision %RSD 0.3 0.3 NMT 2.0%
Accuracy %recovery 99.78% 10054% 98-102%
LOD 0.24 0.29 NMT 3
LOQ 0.72 0.87 NMT 10
Robustness
FM 0.4 0.7
% RSD NMT 2.0
FP 0.4 0.9
MM 1.7 1.0
MP 0.5 0.7
TM 0.5 0.4
TP 0.3 0.6
Fig. 5: Linearity curve of L-Methyl Folate.
Fig. 6: Linearity curve of Escitalopram.
CONCLUSION
A simple, accurate, precise method was developed for the simultaneous estimation of the L-Methylfolate and Escitalopram in Tablet dosage form was developed and the proposed method as suitable for routine analysis of L-MF & EST.
A) L-MethylFolate (B) Escitalopram
REFERENCES
1. L-MethylFolate monograph (Online) available on URL: https://www.drugbank.ca/drugs/DB04789 2. Pantoprazole monograph (Online) available on
URL:
4. R. S. Satoskar, S. D. Bhandarkar and S. S. Ainapure. “Pharmacology and Pharmacotherapeutics”, 17th edition, Popular Prakashan, Mumbai, India, 2001. 5. “Burger’s Medicinal Chemistry and drug
discovery”, 6 th edition, Wiley Interscience, New Jersey, 2007.
6. “Wilson and Gisvold’s Textbook of Organic Medicinal and Pharmaceutical Chemistry”, 11th edition, Lippincott Williams & Wilkins, New york, 2004.
A. Korolkovas. “Essentials of Medicinal Chemistry”, 2nd edition, Wiley Interscience, New Jersey, 1988. 7. “Goodman and Gilman’s The Pharmacological
Basis of Therapeutics”, 9th edition, McGraw-Hill health professions division, New york, 1996. 8. Foye’s “Principles of Medicinal Chemistry”, 6th
edition, Lippincott Williams & Wilkins, New york, 2008.
9. Drugs & Cosmetics Act, 1940 & Rules, 1945, 2nd edition, Susmit publishers, Mumbai, India, 2000. 10. Indian Pharmacopoeia, Ministry of Health & Family