COLLOIDS IN SEPTIC TANK EFFLUENT AND THEIR INFLUENCE ON FILTER
PERMEABILITY
Marcin Spychała1,Jakub Nieć1, Natalia Walczak1, Anna Marciniak2
1 Faculty of Land Reclamation and Environmental Engineering Department of Hydraulic and Sanitary Engine-ering, University of Life Sciences in Poznan, Wojska Polskiego St. 28, 60-637 Poznań, Poland, e-mai: marsp@ au.poznan.pl; [email protected]; [email protected]
2 Firma Instalacyjno-Budowlana Jerzy Czwordon, Powstania Listopadowego St. 20, 63-400 Ostrów Wielkopolski, Poland, e-mail: [email protected]
INTRODUCTION
Colloids are particles of diameter measuring 1 nm – 1 micrometer and can be observed to be very common in nature. These include contami-nants in the water, milk (protein and fat droplets in water), butter (colloidal fraction of water in a fat), protein solutions, jellies, mist (water drops or suspension ice in the air) and others. The con-cept of a colloidal substance refers to emulsions,
suspensions present in the water, fibers, polymers
and fumes[Górski 1953].
Whereas the solutes in wastewater have
main-ly an indirect effect on the permeability of the filter
acting on biomass growth, solid and colloidal par-ticles are a direct mechanical factor limiting
per-meability. However, the septic tank effluent (STE)
content and the mechanisms of particle retention
on or inside the filter are poorly recognized.
Journal of Ecological Engineering
Volume 16, Issue 4, Oct. 2015, pages 74–80
DOI: 10.12911/22998993/59352 Research Article
ABSTRACT
The aim of the study was to evaluate the content of colloids in septic tank effluent and their impact on textile filter permeability. Measurements were performed on septic tank effluent without suspended solids but containing colloids and without colloids – including only dissolved substances (filtered by micro-filters and centri -fuged). The study was conducted on unclogged and clogged textile filter coupons. During the study the following measurements were conducted: turbidity, chemical oxygen demand and hydraulic conductivity of textile filter coupons. The colloid size range was assumed to be less than 1.2 microns according to the literature. Despite the relatively low content in the septic tank effluent the colloids played an important role in the clogging process. Both the filtering media, filled with low (unclogged) and high content of biomass (clogged) were sensitive to the clogging process ac-celeration due to the possibility of small diameter pore closure and oxygen access termination. Moreover, small size pores were probably sensitive to closing or bridg -ing by small size colloidal particles.
Keywords: colloids, clogging, hydraulic conductivity, non-woven textile, turbidity. Received: 2015.06.02
Accepted: 2015.08.31 Published: 2015.10.01
Colloids are commonly found, as well as
liq-uids, solids and gases. They can be characterized by a specific range of fragmentation of the com -ponents contained therein. Colloidal particles are unable to pass through the biological membrane (cell membrane). However, it should be noted that they belong to a heterogeneous mixture in the
form of suspension [Drapała 1996]. The diversity of colloids makes it difficult to formulate a clear definition of colloidal particles.
It has been shown that substances may take the form of colloids, suspensions, or a real solu-tion, depending on the dispersion media and the
fragmentation of the mixture [Drapała 1996].
The scholarly literature indicates a common
assumption that colloidal particles have a size
of less than about 1 micron, while some authors reported a maximum dimension of 0.45 µm and
and Carrera 1999]. In most cases they are
char-acterized by a very high surface area, resulting
in the suspension of colloidal particles impacted by surface physico-chemical forces; in particular such as the attraction of London-van der Waals and electrostatic attractive forces. The distance of impact is very small, and the effects are
sig-nificant when the particles cross the energy bar
-rier [Smith 2007].
Brownian diffusion also plays an important role in the behavior of these particles in porous media. In comparison with real solutions, colloi-dal suspensions consist of much bigger particles, thereby extending the time of diffusion and con-tributing to a low osmotic pressure of the solu-tion in quessolu-tion. A careful analysis of the optical properties can assess how it is affected by media dispersion. This phenomenon is known as the dispersion Tyndall effect where the light beam behaves quite differently in the case of colloidal suspensions than in real solutions that exhibit optical homogeneity. In the former case it is dis-sipated by the dispersion medium. One example would be the sunlight passing through a narrow
gap where the dust floating in space scatters the
beam of sunlight showing its path. It should aslo be noted that the dispersion of light takes place in various directions [Bijok and Bijok 1974].
In raw wastewater colloids may reach up to 21–22% of chemical oxygen demand (COD) and most are (up to 19–20% of COD) readily
biode-gradable [Makowska and Spychała 2014]. The
high range of biodegradable fraction of colloids can result in their concentration changeability.
Kubiak [2014] reported colloids as a COD
con-tent (identified as the difference between domestic wastewater filtered by 1.0 µm and 0.22 µm micro
-filters) as being between 0.6% and 8.2%, on aver -age: 5.5±1.75% (n=4). This value was calculated
by excluding values below zero (three of seven). The particles of size 1–30 microns are con
-sidered as intermediate particles [Perez-Paricio and Carrera 1999] and are therefore influenced by
both the particles and volume of surface forces.
Some authors assume that surface forces can be
omitted in the case of particles larger than 10
mi-crons [Sanford and Gates 1956]. Other research -ers draw attention to the role of van der Waals
forces [Mintz 1964, Mackrle 1960] and even that
electro-kinetic forces should be taken into
ac-count [Stanley 1955, O’Melia and Crapps 1964,
Ives 1965]. In the general context, the sedimenta-tion of these particles is quessedimenta-tioned orconsidered
by some authors [Camp 1937, Fair 1951, Ives
1961] and ignored by others [Stein 1940, O’Melia and Crapps 1964, Smith 1967].
For large particles, it is believed that the size
(greater than 30 microns) is subject only to the forces of volume in respect to process sedimen-tation, straining, and hydrodynamic conditions
[Perez-Paricio and Carrera 1999].
Comprehensive information on a particular sample (e.g. colloids) cannot be based solely on one method. The following are used for the deter-mination of colloids. Nephelometry and turbidim-etry, which allows the determination of the
func-tion of particle size distribufunc-tion in respect to the
dispersed phase of substances. In this context light beam scattering plays a decisive role.
Ultra-microscopy, which is applicable only to a solution showing the Tyndall effect and is rel-evant for liophobic substances, where the differ-ence between the refractive factor of the medium and the refractive factor of the system
(constitut-ed by colloidal particles) is significant.
Electron microscopy, involving the use of an
electron beam instead of visible light, where the
electron beam is characterized by a small wave -length. For this purpose, lenses have been
re-placed by an electromagnetic field, which allows
for the collapsing of the electron pathway. The two most popular types of electron microscope are scanning and transmission.
Ultracentrifuge, is centrifuge performing for several or tens of thousands rotations. Due to the
different particle size distribution in the STE and
due to the presence of relatively small particles (several micrometers), the possibility of the for-mation of the smallest particle aggregates (less than 10 microns) by the action of surface forces
(van der Waals) or electro-kinetic [Malinowskaja
et al. 1986] should be taken into consideration. An aggregate may behave as a single particle or
as a floc, which is unstable and undergoes defor
-mation under the influence of external forces such
as a pressure gradient. A disadvantage of septic
tank (ST) outflow is its high variability in terms
of both quantity and quality.
The composition of the STE has an impact on the quality and durability of filters (e.g. non-wo -ven) correspondingly both to dissolved and sus-pended substances. Wherein the former (as easily absorbed) have an impact on the development of live biomass, while the latter – act on permeabil-ity reduction – as the result of accumulation in the
-Journal of Ecological Engineering vol. 16(4), 2015
tion of a filter cake). Previous studies on the STE
showed the high differentiation of total
suspend-ed solids (TSS) concentration [Spychała et al.
2013]. Until now some guidelines for acceptable
maximum TSS concentration for sand filters sup
-plied with STE have been proposed. The effect of particle size and shape distribution on the filter (sand or non-woven textile filters) is practically unrecognized in the pore blocking (clogging) pro
-cess. Particle size distribution in STE and their qualitative relation to the raw wastewater inflow
-ing into the ST is also little known. In opposition to most sand filters non-woven textile ones have a relatively small available pore size, therefore the impact of particle size on filter performance (hy -draulic capacity) is all the more important.
The particles in the wastewater
(includ-ing STE) can be dist(includ-inguished into several size
fractions [Dulekgurgen et al. 2006]: dissolved (<0.001 µm), colloidal (0.001–1 µm), “supra” colloidal (1–100 µm) and settling (> 100 µm).
To date, several studies were carried out on
the determination of particle size distribution in
municipal, industrial and agricultural
wastewa-ter but not in the STE [Sophonsiri and Morgen -roth, 2004]. Authors investigated the relation-ship between chemical composition and particle
size distribution. In this context one should note
that total suspended solids are composed mainly of organic matter and have a density of about 1 g/cm3 or less, which makes it relatively
dif-ficult to remove by sedimentation and easier to remove by filtration.
The suspended solids concentration
deter-mined by the filtration on a cellulose filter can
provide important information about the minimum
particle size as long as the pore size of the filter is
known and reported. However, this is not common situation. Additionally the complication is that the guidelines in various countries differ in this matter. Despite the relatively high proportion of the organ-ic fraction in suspension in general, some authors suggest that this is a matter of very low
suscepti-bility to degradation [Siegrist 1987], where it was
found that about half of the total suspended solids
in STE is low-biodegradable or inert.
The STE contains many kinds of particles,
originating from various materials such as toilet paper, tampons, paper napkins, paper towels,
cot-ton or wool fibers, cigarette filters, and many oth
-ers [Friedler et al. 1996, Seabloom et al. 2005].
One of the more frequently occurring
parti-cles in the STE are fibers or partiparti-cles of a fibrous
shape [Spychała et al. 2013], including fibers de -rived from toilet paper.
Some published studies [Friedler et al. 1996]
indicate a relatively high proportion by weight of waste toilet paper produced by one person per day on average – more than 10% (13 paper leaves, 0.55 g of weight each giving about 7.2 g dry weight per person per day). The interpretation of
these results is difficult due to the probable large
variation of the amount of paper wasted by one person, which depends on various factors, such as gender [Friedler et al. 1996] or age [van der Wijst
and Groot-Marcus 1999], and perhaps also other
individual characteristics.
Jönsson et al. [2005] showed that 48% of the weight of toilet paper consists of carbon, and the
fibers are composed mainly of cellulose and
hemi-cellulose. These authors also determined the rate of medium and slowly degradable carbohydrates in toilet paper (83% and 17%, respectively).
Becker [1994] and Becker and Pearson [2002]
estimated the average daily weight of fiber in the Swedish diet, of 15.0 g/PE and 17.0 g/PE, respec -tively. To date the published research results on
particle size distribution of suspended solids in the STE have been few and far between. One of
the more interesting results was presented by Pal-lares et al. [2011]. These studies have shown a
relatively wide range of the length of fibrous par -ticles originating from toilet paper: 180–540 µm.
The size distribution of particles occurring or those likely to be present in the STE is charac
-terized by a high variability in both the average and ranges of values. Sizes are in the range from
a few to several hundred. In practical terms the probability of non-woven textile pore blockage
(typical pore size of medium thickness non-wo -ven textiles is about 90–120 µm) at the surface of
non-woven textile in the form of a filter cake can occur in the case of toilet paper fibers and large
fractions of potato starch. Knowledge related to
particle size and shape distribution in the STE ap -pears to be necessary for the design and
model-ling of filters, including non-woven textile ones
[Pallares et al. 2011], as well as for the
identi-fication of processes, including biological filters
performance [Dulekgurgen et al. 2006, Levine
et al. 1991, Sophonsiri and Morgenroth 2004]. Such knowledge has been seen to be also useful
for biochemical process description, e.g. for the
relationship between particle size distribution and
the COD of the organic substrate [Dulekgurgen et
Journal of Ecological Engineering vol. 16(4), 2015
Another important problem is the content of
non-fibrous particles originating from toilet paper in the STE [Spychała et al. 2013].
The most of particles kinds referred above
can change into the colloids under specific con -ditions, e.g. as the result of the composition by relatively high bacteria number.
The aim of the study was to verify the
hypoth-esis that colloids can prove to be a significant fac
-tor in filter permeability.
METHODS
The research was conducted on wastewater collected from a single chamber septic tank of 3.0 m3 volume (length: 1.85 m, width: 1.34 m)
equipped with an outflow filter. The STE origi -nated from a four-people household (two adults
and two children). The STE was initially filtered by a filter of 10 µm pores.The turbidity and COD was measured in each sample.
Hydraulic conductivity determination
Aiming to avoid damage or disturbance of
the clogging layer, the STE level at the start
of measurement was sustained 10 cm above the
filter layer surface.Six transparent experimen
-tal pipes were used (three unclogged textile fil
-ters and three clogged textile fil-ters). After the
stable water surface level reached the measure-ments of water surface level fall-time were
per-formed for STE with and without colloids.All the measurements were done in several from 5 to 8 replications.
The flow rate and hydraulic conductivity cal -culation was based on the determination of
fall-ing water surface level durfall-ing filtration through
the clogged and unclogged non-woven textile
filter (four layers of TS 20 textile type). The
hydraulic conductivity was determined and cal-culated according to equation no. (1) presented by Lambe [1987], using the method described
by Li et al. [2005] and confirmed by Nieć and Spychała [2014]:
4
particle size distribution and the COD of the organi
c substra
te [Dulekgurgen et al. 2006, Ekama et
al. 1986, Henze et al.
2000].
Another important problem is the content of non-fibrous particles originating from toilet
paper in the STE
[Spychała et al. 2013].
The aim of the study was to verify the hypothesis that colloids can prove to be a significant
factor in filter permeability.
METHODS
The research was conducted on wastewater collected from a single chamber septic tank of
3.0 m
3volume (length: 1.85, width: 1.34 m) equipped with an outflow filter. The
STE
originated
from a four-people household (two adults and two children). The
STE
was initially filtered by a
filter of 10 µm pores.
The turbidity and COD was measured in each sample.
Hydraulic conductivity determination
Aiming to avoid damage or disturbance of the clogging layer, the
STE
level at the start of
measurement was sustained 10 cm above the filter layer surface.
Tap water was added to the
experimental pipes. After the stable water surface level reached the measurements of water surface
level fall-
time were performed for STE with and without colloids.
All the measurements were done
in several from 5 to 8 replications.
The flow rate and hydraulic conductivity calculation was based on the determination of
falling water surface
(FHM)
level during filtration through the clogged and unclogged non-woven
textile filter. The hydraulic conductivity was determined and calculated according to equation no.
(1) presented by Lambe [1987], using the method described by Li et al. [2005] and confirmed by
Nieć and Spychała [2014]:
t us tl HH
K 2.3 log 0
(1)
where:
K
us- hydraulic conductivity is estimated at unsteady state flow, m/d
l
- thickness of filtration layer, m
t
- fall-time of water surface level from
H
oto
H
t, d
H
o-
height of water surface level at the start of measurement, m
H
t- height of water surface level at the end of measurement, m
After filtration by filter of 10 µm
pores
(removal of TSS) the STE was filtered by mic
ro-porous filter of pores 1.2 µm and then centrifuged during 30 minutes at 6000 RPM.
Measurements were performed in two series: unclogged
-textile filter series and clogged-textile filter
series.
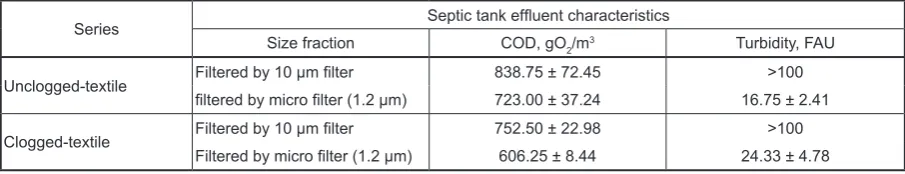
The basic information related to sample data and methods was collected in table 1.
Table 1. The basic information related to sample data and methods
The hydraulic load of textile filter coupons with filter
STE
without colloids (filtered by 1.2
µm micro filters and centrifuged) and
those with colloids (filtered by
1.2 µm micro filters) was
measured at 30 cm
3and 26 cm
3, respectively.
The surface area of filter layer sample during unclogged non-woven textile filtration
experiment was 0.5 cm
2. The filters were practically free of TSS. Only about 180 cm
3of STE was
filtered by filters before the unclogged non-woven textile experiment for the purposes of wetting the
filtering layer.
(1)
where: Kus– hydraulic conductivity; estimated at
unsteady state flow, m/d;
l – thickness of filtration layer, m;
t – fall-time of water surface level from Ho to Ht, d;
Ho – height of water surface level at the start of measurement, m;
Ht – height of water surface level at the end of measurement, m.
After filtration by filter of 10 µm pores (re
-moval of TSS) the STE was filtered by micro-porous filter of pores 1.2 µm and then centrifuged during 30 minutes at 6000 RPM.Measurements
were performed in two series: unclogged-textile
filtration series and clogged-textile filtration se -ries. The basic information related to sample data and methods was collected in Table 1.
The hydraulic load of textile filter coupons with filter STE without colloids (filtered by 1.2 µm micro filters and centrifuged) and those with col
-loids (filtered by 1.2 µm micro filters) was 30 cm3
and 26 cm3, respectively.
The surface area of filter layer sample during unclogged non-woven textile filtration experi -ment was 0.5 cm2. The filters were practically free
of TSS. Only about 180 cm3 of STE was filtered
by filters before the unclogged non-woven textile experiment for the purposes of wetting the filter -ing layer.
The research on clogged filter was conducted
on a transparent pipes with an 0.8 cm diameter and 40 cm in height. The surface area of clogged
filter coupons was 0.83±0.5 cm2. The clogged
non-woven textile was fastened at the base edge
of the pipes. Accumulated mass (measured as TS) on the surface and inside the filter layer sample –
24.0±2.87 cm2 on average indicated an advanced
clogging process.
Table 1. The basic information related to sample data and methods
Series Septic tank effluent characteristics
Size fraction COD, gO2/m3 Turbidity, FAU
Unclogged-textile Filtered by 10 µm filter 838.75 ± 72.45 >100
filtered by micro filter (1.2 µm) 723.00 ± 37.24 16.75 ± 2.41
Clogged-textile Filtered by 10 µm filter 752.50 ± 22.98 >100
Journal of Ecological Engineering vol. 16(4), 2015
RESULT AND DISCUSSION
Colloids content in septic tank effluent
The colloids were identified by COD and tur
-bidity difference between STE filtered by a 1.2 µm micro filter (without suspended solids but with colloids) and STE centrifuged (without sus -pended solids and without colloids).
A significant difference in COD between STE
with colloids and without colloids was observed
during clogged-textile filtration experiment:
606.25±8.44 gO2/m3 and 562.50 ±9.56 gO 2/m3
respectively (Figure 1). Unfortunately no
statisti-cally significant difference was observed in COD between STE with colloids and STE without col
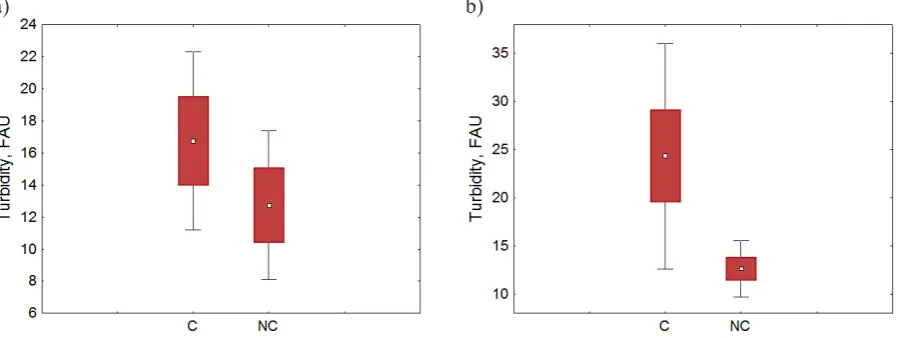
-loids during unclogged textile filtration experi -ment. An evident difference was observed in
col-loids content identified by turbidity between STE with colloids and STE without colloids during unclogged and clogged textile filtration experi
-ment: 24% and 14%, respectively. The results are presented in Figure 2.
Statistical analysis (t – student’s test) at the significance level α = 0.05, confirmed a significant difference in turbidity between STE with colloids (C) and STE without colloids (NC) in both, un
-clogged and -clogged textile filtration experiment. The observed content of colloids in STE, both during unclogged and clogged textile filtra -tion experiment were relatively low and unstable. This corresponds to results obtained by Kubiak [2014] and was probably related to raw
waste-water content (wastewaste-water inflowing into the ST)
and biochemical processes occurring inside the
ST. Importantly, these processes have not been fully recognized yet.
Colloids impact on unclogged and clogged textile filter hydraulic conductivity
The hydraulic conductivity of filters num-ber 2 and numnum-ber 3 (Figure 3) confirmed (at
the level α = 0.05) the significant impact of
colloids on unclogged and clogged textile fil-ter hydraulic conductivity (e.g. filfil-ter number 2 without and with colloids: 0.186±0.003 and 0.132±0.002 m/d, respectively, filter number 3 without and with colloids: 0.052±0.003 and 0.036± 0.001 m/d, respectively). Unfortunate-ly the results of hydraulic conductivity of filter number one did not show the significant
im-pact of colloids (at the level α = 0.05). This
could be related to the local variability of tex-tile porosity. This problem was earlier reported
by Spychała and Łucyk [2015, in press].
Despite the relatively low content in the
STE, colloids can play an important role in the
Figure 2. Turbidity in septic tank effluent with colloids (C) and without colloids (NC) during unclogged non-woven textile filter (left) clogged non-non-woven textile filter (right) experiment
Figure 1. COD in septic tank effluent with colloids (C) and without colloids (NC) clogged non-woven textile filter experiment
clogging process. Filtering media filled with
a high content of biomass (partly clogged) is sensitive to clogging process acceleration due to the possibility of small diameter pore
block-age and oxygen access termination. Moreover, small size pores are sensitive to blocking or bridging by small size particles. The impact of STE with and without colloids on the perme -ability of unclogged and clogged non-woven textile was observed.
CONCLUSIONS
The following conclusions can be drawn based on this research:
• the observed values and content of colloids in
STE, both during unclogged and clogged non-woven textile filtration experiment was rela -tively low and unstable
• the identification of colloids by turbidity (frac
-tionation using filtration and centrifugation)
was more appropriate and effective than
iden-tification by COD due to some instability of
organic compounds and lack of detection of inorganic colloid compounds
• despite the relatively low content in the STE,
colloids can play an important role in
non-woven textile filter clogging process due to
the possibility of small diameter pores clos-ing by (colloidal particles) and oxygen access stopping
• the identification and description of colloid ac
-cumulation process during STE filtration (e.g. by non-woven textile filters for wastewater
treatment) needs further studies.
Acknowledgements
This work was supported by the National Sci -ence Centre under Grant No. N N523751540.
REFERENCES
1. Becker, W. 1994. Dietary habits and intake of nu-trition in Sweden 1989 (In Swedish). The National Food Administration. Uppsala, Sweden.
2. Bijok B., Bijok F. 1974. Organic chemistry for food industry secondary schools. WSiP, Warsaw. 3. Górski A. 1953. Colloids science outline. PWRiL,
Warsaw.
4. Drapała T. 1996. Chemistry fundamentals. WSP, Warsaw.
5. Dulekgurgen E., Doğruel S., Karahan Ö., Orhon D. 2006. Size distribution of wastewater COD frac -tions as an index for biodegradability. Water Res. 40 (2), 273–282.
6. Ekama G.A., Dold P.L., Marais G.V.R. 1986. Pro -cedures for determination of influent COD frac -tions and the maximum specific growth rate of heterotrophs in activated sludge system. Water Sci. Technol. 18, 91–114.
7. Fair G.M 1951. The hydraulics of rapid sand fil -ters. J. Inst. of Water Eng. 5, 171-213.
8. Friedler E., Brown D.M., Butler D. 1996. A study of WC derived sewer solids. Water Sci Technol. 33(9), 17–24.
9. Kubiak M. 2014. Comparison of fractionation methods of domestic wastewater contaminants. Master of science thesis. University of Life Sci -ences in Poznan.
10. Lambe T.W. 1978. Soil Mechanics. Arkady, War -saw.
Figure 3. Hydraulic conductivity of filters supplied with STE containing colloids (C), and not containing (NC) colloids; left: unclogged non-woven textile filtration experiment, right: clogged non-woven textile filtration ex -periment
Journal of Ecological Engineering vol. 16(4), 2015
11. Li W., Kiser C., Richard Q. 2005. Development of a filter cake permeability test methodology. Ameri -can Filtration and Separations Society. Internation -al Topic-al Conferences and Exposition, September 19–22, Ann Arbor, Michigan, (MI), p. 1–8. 12. Makowska M., Spychała M. 2014. Organic com
-pounds fractionation for domestic wastewater treat-ment modeling. Pol. J. Environ. Stud. 23(1), 131–137. 13. Malinowskaja T.A. 1986. Solids separation in
chemical industry (In Polish). Science Technical Press. Warsaw.
14. Nieć, J.; Spychała, M. 2014. Hydraulic Conductiv -ity Estimation Test Impact on Long-Term Accep -tance Rate and Soil Absorption System Design. Water, 6, 2808–2820.
15. O’Melia C.R., Crapps D.K. 1964. Some Chemical Aspects of Rapid Sand Filtration. Annual Confer -ence, Toronto, Ont. Jun. 4.
16. Pallarès A., François P., Pons M.N., Schmitt P. 2011. Suspended particles in wastewater: their op -tical, sedimentation and acoustical characterization and modeling. Water Sci. Technol. 63(2), 240–247. 17. Perez-Paricio A., Carrera J. 2000. Validity and sen -sitivity analysis of a new comprehensive clogging model. Calibration and Reliability in Groundwa-ter Modelling: Proceedings of the ModelCARE 99 Conference, pp. 47–53, Int. Assoc. of Hydrol. Sci., Gentbrugge, Belgium.
18. Sanford L.H., Gates C.D. 1956. Effects of Synthet -ic Detergents on Rapid Sand Filter Performance. J. AWWA, 45–54.
19. Seabloom R.W., Bounds T.R., Loudon T.L. 2005. Septic tanks. In: Gross M.A., Deal N.E. (Eds.) Uni -versity curriculum development for decentralized wastewater management. National Decentralized Water Resources Capacity Development Project. Fayetteville (AR), University of Arkansas, 38–39. 20. Siegrist R.L. 1987. Soil clogging during subsur
-face wastewater infiltration as affected by effluent composition and loading rate. J. Environ. Qual. 16(2), 181–187.
21. Sophonsiri C., Morgenroth E. 2004. Chemical composition associated with different particle size fractions in municipal, industrial, and agricultural wastewaters. Chemosphere, 55(5), 691–703. 22. Spychała M., Nieć J. 2013. Impact of septic tank
sludge on filter permeability. Environ. Prot. Eng. 39(2), 77–89.
23. Spychała M., Nieć J., Pawlak M. 2013. Preliminary study on filamentous particle distribution in septic tank effluent and their impact on filter cake devel -opment. Environ. Technol. 34(20), 2829–2837. 24. Spychała M., Łucyk P. (2015, in Press). Effect of