© Universiti Tun Hussein Onn Malaysia Publisher’s Office
IJIE
Journal homepage: http://penerbit.uthm.edu.my/ojs/index.php/ijie
The International
Journal of
Integrated
Engineering
*Corresponding author: [email protected]
2018 UTHM Publisher. All right reserved. penerbit.uthm.edu.my/ojs/index.php/ijie
66
Sleep Heart Rate Variability Analysis and
k
-Nearest
Neighbours Classification of Primary Insomnia
Haslaile Abdullah
1,*, Thomas Penzel
2, Dean Cvetkovic
31Razak Faculty of Technology and Informatics, Universiti Teknologi Malaysia,
Jalan Sultan Yahya Petra, Kuala Lumpur, 54100, MALAYSIA
2Charité – Universitätsmedizin Berlin,
Charitéplatz 1, Berlin, 10117, GERMANY
3RMIT University,
Melbourne, 3001, AUSTRALIA
*Corresponding Author
DOI: https://doi.org/10.30880/ijie.2018.10.07.007
Received 26 October 2018; Accepted 19 November 2018; Available online 30 November 2018
1. Introduction
Insomnia has affected millions of people worldwide with the key symptom of having difficulty in falling asleep or remaining asleep. Generally, insomnia can be categorised into two types: primary insomnia and secondary insomnia. Primary insomnia is purely not related to any other medical and health condition, whereas secondary insomnia occurs as a consequence of physical or mental problems (Wilson, 2015). Depression, shift work and comorbid physical illnesses have been identified as the risk factors of insomnia (Klink, Quan, Kaltenborn, & Lebowitz, 1992; Smagula, Stone, Fabio, & Cauley, 2016). The impact of insomnia, particularly in cardiovascular diseases, mental disorders and socioeconomic aspects, is significant (Sivertsen et al., 2014). Insomnia has been reported to increase the risk of developing heart disease by 45% (Sivertsen et al., 2014). It has been estimated that the total annual cost of insomnia, which includes healthcare service and medication costs and productivity losses, amounts to USD 5 billion (Daley, Morin, LeBlanc, Grégoire, & Savard, 2009). Therefore, the early diagnosis and treatment of insomnia are required to prevent the chronicity and mortality of untreated insomnia.
Abstract: The Heart Rate Variability (HRV) of many sleep disorders shows an alteration of the sympathovagal balance of the Autonomous Nervous System (ANS). Primary insomnia refers to the difficulty in initiating or maintaining sleep that is not caused by other illnesses or substances. The HRV of primary insomnia shows inconsistent findings although it is believed to impair the HRV variables. This study compares the HRV changes during different sleep stages and evaluates the k-nearest neighbours (kNN) classifier using the HRV features for primary insomnia classification. The time and frequency HRV variables were extracted from sleep ECG signals of 10 primary insomnia patients and 10 healthy controls during four sleep stages – N1, N2, N3 and REM. The Mann-Whitney U-test was conducted to evaluate the existence of statistical significant differences between the two groups at different sleep stages. The kNN classifier was adapted for the classification tool. Only the LF index of HRV was significantly higher in the primary insomnia patients compared to the healthy subjects. The classification accuracy of kNN was at 75% when both the HRV time and frequency variables were accounted as inputs to the classifier.
67
Polysomnography (PSG) or sleep study that records multiple electrophysiological signals, such as EEG, ECG, EMG and respiration during sleep, is used as an objective measure to assess the sleep disruption in insomnia. Most of the PSG studies have reported shorter total sleep time, lesser slow wave sleep, longer sleep latency and disruption in the sleep architecture (Baglioni et al., 2014). In addition to these sleep measures, Heart Rate Variability (HRV) is another measure obtained from the ECG signal. HRV is a non-invasive instrument and an objective measure used in clinical research to evaluate the Autonomic Nervous System (ANS) in terms of sympathetic and parasympathetic activities (Task Force of the European Society of Cardiology the North American Society of Pacing, 1996). For more than two decades, HRV has been used as a tool to study ECG because of its ease and straight-forward implementation.
It has been reported that patients with major depression and primary insomnia are characterised by a significant reduction in the parasympathetic-related HRV (Spiegelhalder et al., 2011; De Zambotti et al., 2013). According to a recent review on the cardiovascular autonomic activity in insomnia, an increase in the LF and/or LF/HF measures and a decrease in the HF and/or SDNN, RMSSD, pNN50 measures has been interpreted as an increase in the sympathetic activity (Nano, Fonseca, Vullings, & Aarts, 2017). Nevertheless, increased sympathetic and decreased parasympathetic effects on insomnia have not been observed by other studies (Dodds, Miller, Kyle, Marshall, & Gordon, 2017; Jurysta et al., 2009). These varied findings on the HRV measures reported in the literature suggest that validation studies are needed to determine whether insomnia is related to HRV impairment.
Clinically, the diagnosis of insomnia is conducted through multiple tests, which include questionnaires, interviews, medical examinations and sleep studies (Ohayon & Reynolds, 2009). This diagnosis technique is not only subjective but also time-consuming. Therefore, an objective, automated diagnosis tool is preferred in many sleep disorder detection tests. Over the years, a single-channel sensor for an automated system for sleep-staging classification (Yilmaz et al., 2010) and sleep apnea detection (Mendez, Bianchi, Matteucci, Cerutti, & Penzel, 2009; Al-Angari & Sahakian, 2007) has been developed with high detection rates. Also, ECG signals and HRV measures have been used as inputs to various classification methods for the automated diagnosis of cardiovascular diseases (Acharya et al., 2017; Fujita et al., 2016).
Therefore, the objective of this study is to investigate the differences in the HRV measures during sleep between primary insomnia patients and healthy subjects. Second, this study explores the kNN classifier performance for primary insomnia automated detection based on HRV measures.
2.
Methodology
2.1
Data
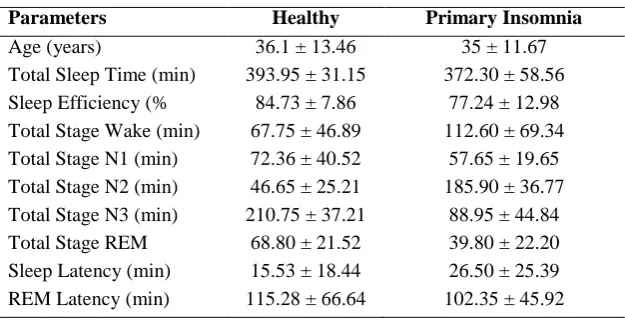
In this study, the PSG data was obtained from Charité University (Berlin, Germany). A total of 10 healthy and 10 primary insomnia PSG data was analysed. The sleep stages were scored accordingly as N1, N2, N3 and REM from a 30 s epoch of the PSG signal. Single-ECG channel (Lead II) signals with a sampling frequency of 200 Hz were extracted from the PSG data. The whole-night ECG signals were visually inspected for the determination of clean signals. Any epochs with noises and movement artefacts were discarded. The ECG signals were segmented to 300 s windows for HRV analysis as recommended by the Task Force of the European Society of Cardiology (Task Force of the European Society of Cardiology the North American Society of Pacing, 1996). The mean and standard deviation for age and sleep parameters were summarised as provided in Table 1.
Table 1 – Subject Age and Sleep Parameters.
Parameters Healthy Primary Insomnia
Age (years) 36.1 ± 13.46 35 ± 11.67
Total Sleep Time (min) 393.95 ± 31.15 372.30 ± 58.56
Sleep Efficiency (% 84.73 ± 7.86 77.24 ± 12.98
Total Stage Wake (min) 67.75 ± 46.89 112.60 ± 69.34 Total Stage N1 (min) 72.36 ± 40.52 57.65 ± 19.65 Total Stage N2 (min) 46.65 ± 25.21 185.90 ± 36.77 Total Stage N3 (min) 210.75 ± 37.21 88.95 ± 44.84
Total Stage REM 68.80 ± 21.52 39.80 ± 22.20
Sleep Latency (min) 15.53 ± 18.44 26.50 ± 25.39
68
2.2
Computation of Time and Frequency Domain of HRV
To compute the time and frequency domains of HRV, the R–R time series need to be generated from the segmented ECG signals. The R peaks of ECG signals were detected using the well-known method of Pan and Tompkins algorithms (Pan & Tompkins, 1985). The programming works for the computation of HRV measures were carried out using MATLAB R2017b.
1) Time Domain
a) Mean R-R
Measures the average time from beat to beat or the R peak to the successive R peak of the R–R time series.
b) SDNN
The standard deviation of the R–R interval of normal beats. SDNN is defined as
(1)
where
N = a total number of successive intervals.
c) RMSSD
The root mean square of the successive differences between the normal beats.
(2)
d) pNN50
This measure is the number of successive intervals of N–N intervals greater than 50 ms.
(3)
2) Frequency Domain
The Power Spectrum Density (PSD) was measured to estimate the R–R interval series in the frequency domain method. PSD measures the absolute power of High Frequency (HF), Low Frequency (LF) and Very Low Frequency (VLF) bands. The frequency range for the LF band is between 0.04 and 0.15 Hz, which reflects the activity of the sympathetic part of ANS. The HF band, which is at a range between 0.15 Hz to 0.40 Hz, reflects the vagal modulation of cardiac activity. The LF/HF ratio defines the overall assessment of the sympathovagal activity. We applied a technique based on the Fast Fourier Transform (FFT) Spectrum for PSD analysis. To minimise the effect of changes in the total power to the calculation of HF and LF within and between subjects, the normalised value (unit, n.u) of HRV components was computed as follows:
(4) (5) nu nu HF LF ratio HF
LF/ (6)
69
2.3
Statistical Analysis
The data analysis was performed using the Mann-Whitney U-test, where the independent variables were the groups – primary insomnia and healthy – and the dependent variables were age and sleep parameters as shown in Table 1. To further evaluate the existence of significant statistical differences between the two groups at different sleep stages, Analysis of Variance (ANOVA) was implemented. The independent variables were the groups – primary insomnia and healthy – and sleep stages – Wake, N1, N2, N3 and REM – whereas the dependent variables were the time and frequency domains of HRV. IBM SPSS software with p values of 0.05 was used to conduct the statistical analysis.
2.4
Supervised Classification:
k-
Nearest Neighbours (kNN)
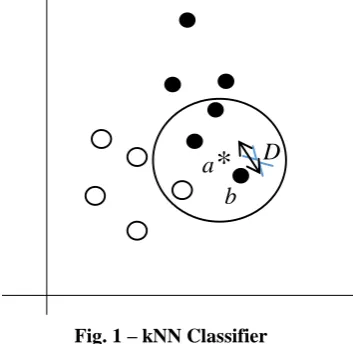
The kNN classifier is a supervised-learning method capable of classifying the input data even in the absence of prior knowledge. Its implementation is one of the simplest pattern recognition methods, and yet it can achieve high detection accuracy. The kNN algorithm is based on an intuitive concept, where the distance between the data in the same class should be closer to each other. Its computation depends on the number of k-nearest neighbours and distance metrics (Hu, Huang, Ke, & Tsai, 2016). Various distance metrics are available to be adapted to solve different classification problems such as Euclidean, Mahalanobis and Minkowski (Hu et al., 2016; Mendez et al., 2009). The optimal value of k is determined heuristically by inspecting the data and cross-validation. Generally, a larger value of k improves the overall classifier performance due to the reduction in the effect of noisy points. Fig. 1 illustrates the basic concept of kNN where ‘a’ point (asterisk symbol) is classified based on the majority vote of its nearest neighbours in the feature space. If k = 3, then the asterisk point is assigned to the dark-circle group.
Fig. 1 – kNN Classifier
In this study, the input vectors that consisted of seven HRV features{X1, X2, ..., Xn} were labelled as two groups {1 and 2}. Min–max normalisation was implemented to map the input vectors into the range of [0, 1] as
) min( ) max(
) min( ,
i i
i i
N i
X X
X X
X
(7)
where Xi,N is the normalised ith feature of the input vector. These normalised input vectors were further partitioned for training (90%) and testing (10%) using 10-fold cross-validation. For the kNN classification, the value of k was normally an odd number. In this study, k = 3, 5 and 7 were tested to determine the optimum value that performed the best in the classification. Four types of distance metrics listed below were among the preferred metrics used in the literature. The calculation for the distance metrics between point a and b in a feature space was defined as:
D
70
1. Euclidean distance
mi
a
ib
ib
a
D
1 2)
(
)
,
(
(8)where D is the Euclidean distance between point a and b.
2. Mahalanobis distance
mi
a
ib
iC
a
ib
ib
a
D
1 1)
(
)
(
)
,
(
(9)where C is the covariance matrix.
3. Cosine distance
mi i i
m i i i m
i i i i i
b
a
b
a
b
a
D
1 2 1 2 1)
,
(
(10)where is the mean value.
4. Correlation distance
mi i i
m i i i m
i i i i i j
b
a
b
a
b
a
D
1 2 1 2 11
)
,
(
(11)The kNN performance was evaluated by measuring its accuracy, which is defined as the following:
Accuracy= 100
FN FP TN TP TP
TN
(12)
where TP and TN represent the total number of True Positive and True Negative, respectively. Also, FP and FN are the total number of False Positive and False Negative counted during the classification (Baratloo, Hosseini, Negida, & El Ashal, 2015).
3.
Results and Discussion
The HRV measures of the primary insomnia patients and healthy controls were extracted from five-minute segments of whole-night sleep ECG recording. Mean RR, SDNN, RMSSD and pNN50 were the time-domain HRV features extracted from the ECG, whereas LFnu, HFnu and LF/HF ratio were the frequency domains of HRV. The HRV changes during sleep stages N1, N2, N3 and REM were compared between the insomnia patients and healthy subjects. These time and frequency domains of HRV measures were subsequently used for classification study.
71
were lower at stage N1 and gradually increased at N2, N3 and REM. However, the statistical test did not show any significant difference in all the sleep stages for SDNN, RMSSD and pNN50.
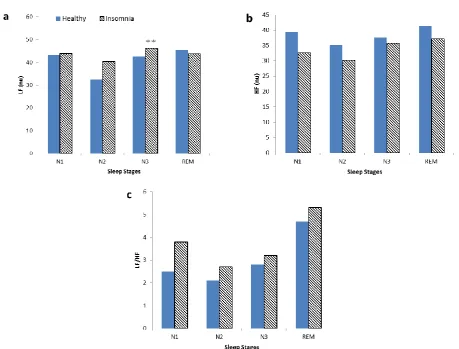
In the frequency domain analysis, the LF measure of insomnia was observed higher when compared to the healthy group. The highest value of LF was significantly recorded during N3 sleep. In contrast, the HF of insomnia was lower than the healthy group but not significant. Also, there was no significant difference in the LF/HF index between the two groups although the maximum value was observed during the REM sleep in the healthy group.
In line with several studies, our analysis of the time and frequency domains of HRV in primary insomnia patients also showed increased sympathetic activity and reduced parasympathetic activity of the ANS compared to the control group (Spiegelhalder et al., 2011; De Zambotti et al., 2013). In this study, a high value of the LF index was observed during the N3 sleep stage in primary insomnia patients, which indicated the predominance of the sympathetic nervous system during deep sleep. This increase of sympathetic activity during sleep was largely hypothesised to cause physiological hyperarousal and further increase the risk of cardiovascular diseases (Carter et al., 2017). Several studies have reported a longer REM sleep time in insomnia patients (Riemann et al., 2012; Tobaldini et al., 2013). Such duration of REM sleep is believed to be associated with an increase in micro-arousals and awakening in insomnia patients. However, a low duration of REM sleep time in primary insomnia was observed in this study. This variation could be caused by the small sample size used in this study.
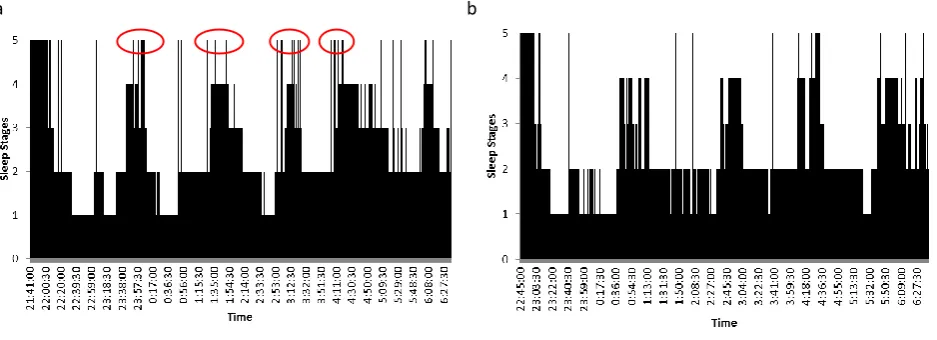
a b
Fig. 2 - (a) Hypnogram of Primary Insomnia; (b) Hypnogram of Healthy Subject. Sleep stages annotation 5 = Wake, 4 = REM, 3 = N1, 2 = N2, , 1 = N3.
72
Fig. 3 - Mean plot of time indexes of HRV; (a) RRI; (b) SDNN; (c) RMSSD and (d) pNN50 in sleep stages N1, N2, N3 and REM. ** p<0.05.
Fig. 4 - Mean plot of frequency indexes of HRV; (a) LF (nu); (b) HF (nu) and (c) LF/HF in sleep stages N1, N2, N3 and REM. ** p<0.05.
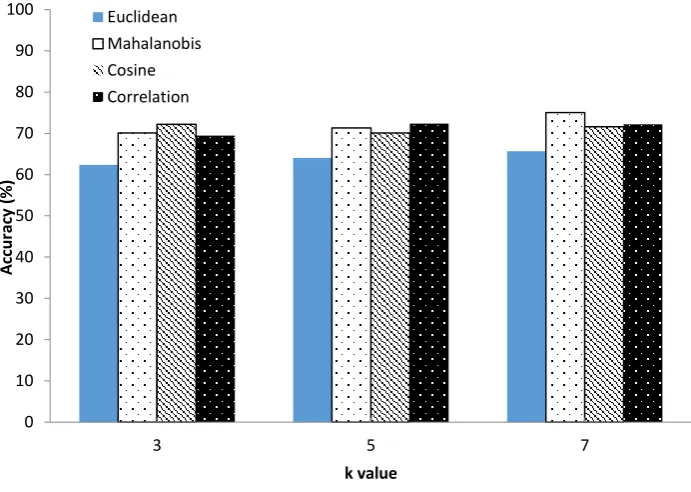
In this study, the optimum value of k and distance metric was explored. As shown in Fig. 5, the kNN accuracy improves as the k value increases. The highest accuracy is achieved using the Mahalanobis distance with k = 7, whereas the lowest detection rate is observed for the Euclidean distance metric and k = 3. The average accuracy of 75.02% is recorded using kNN for the classification of primary insomnia and healthy subjects as shown in Table 2. Other distance metrics yield a detection rate between 65% and 72% with k value of 3 and 5. Therefore, the performance of kNN classifier is highly dependent on the tuning parameters k and distance metrics. Although the detection rate for insomnia in this study is slightly lower compared to other reported values of 81% (Abdullah, Patti, Dissanyaka, Penzel, & Cvetkovic,
73
2017; Mulaffer, Shahin, Glos, Penzel, & Ahmed, 2017), our approach is simpler, as we have only used a total of seven features extracted from the ECG signal. Mulaffer et al. (2017) used 57 features extracted from 2 EEG signals to obtain an accuracy of 81%. Also, they used SVM that required several tuning parameters, which includes kernel function, gamma and c values.
The limitation of this study is that a small sample size of 20 subjects was used to perform the statistical analysis and classification. Secondly, we should have considered including more features and then implementing the feature selection technique as practiced in many machine learning applications.
Fig. 5 – Classification accuracy percentage of Euclidean, Mahalanobis, Cosine and Correlation distance of k = 3, 5 and 7
Table 2 – Average classification accuracy, sensitivity and specificity percentage (%) rates of 10-fold cross- validation.
Distance metric Accuracy
Euclidean (k = 7) 65.68
Mahalanobis (k = 7) 75.02
Cosine (k = 3) 72.21
Correlation (k = 5) 72.37
4.
Conclusion
In this paper, a total of seven features from the time and frequency domains of HRV between primary insomnia patients and healthy subjects were investigated in terms of statistical significance. Although, the HRV measures of insomnia patients have shown an increase in the overall of sympathovagal activity, this measure alone cannot be regarded as an objective biomarker, as other sleep disorders, such as sleep apnoea, is also associated with an alteration in the sympathovagal balance. In our experiment on the classification of insomnia and healthy subjects using kNN and HRV measures, an accuracy of 75% was achieved. This result suggests the possible development of an automated insomnia diagnosis with continuous improvement in the feature extraction and classification methods.
0 10 20 30 40 50 60 70 80 90 100
3 5 7
A
cc
u
rac
y
(%
)
k value Euclidean
74
Acknowledgement
This research was funded under the Research University Grant (Vot No. 15H54) from Universiti Teknologi Malaysia. The authors would like to thank the Research Management Centre of UTM and the Ministry of Education Malaysia for their financial support.
References
[1] Wilson, L. W. (2015). The Ultimate Insomnia Cure: The Best Solution to Get Relief from Insomnia FAST!. 4-10. [2] Klink, M. E., Quan, S. F., Kaltenborn, W. T., & Lebowitz, M. D. (1992). Risk factors associated with complaints
of insomnia in a general adult population: influence of previous complaints of insomnia. Archives of internal medicine, 152(8), 1634-1637.
[3] Smagula, S. F., Stone, K. L., Fabio, A., & Cauley, J. A. (2016). Risk factors for sleep disturbances in older adults: evidence from prospective studies. Sleep medicine reviews, 25, 21-30.
[4] Sivertsen, B., Lallukka, T., Salo, P., Pallesen, S., Hysing, M., Krokstad, S., & Øverland, S. (2014). Insomnia as a risk factor for ill health: results from the large population‐based prospective HUNT Study in N orway. Journal of sleep research, 23(2), 124-132.
[5] Sofi, F., Cesari, F., Casini, A., Macchi, C., Abbate, R., & Gensini, G. F. (2014). Insomnia and risk of cardiovascular disease: a meta-analysis. European journal of preventive cardiology, 21(1), 57-64.
[6] Daley, M., Morin, C. M., LeBlanc, M., Grégoire, J. P., & Savard, J. (2009). The economic burden of insomnia: direct and indirect costs for individuals with insomnia syndrome, insomnia symptoms, and good sleepers. Sleep, 32(1), 55-64.
[7] Baglioni, C., Regen, W., Teghen, A., Spiegelhalder, K., Feige, B., Nissen, C., & Riemann, D. (2014). Sleep changes in the disorder of insomnia: a meta-analysis of polysomnographic studies. Sleep medicine reviews, 18(3), 195-213. [8] Electrophysiology, Electrophysiology, Task Force of the European Society of Cardiology the North American Society of Pacing. (1996). Heart rate variability: standards of measurement, physiological interpretation, and clinical use. Circulation, 93(5), 1043-1065.
[9] Pan, J., & Tompkins, W. J. (1985). A real-time QRS detection algorithm. IEEE Trans. Biomed. Eng, 32(3), 230-236.
[10] Spiegelhalder, K. A. I., Fuchs, L., Ladwig, J., Kyle, S. D., Nissen, C., Voderholzer, U., & Riemann, D. (2011). Heart rate and heart rate variability in subjectively reported insomnia. Journal of sleep research, 20(1pt2), 137-145. [11] De Zambotti, M., Covassin, N., Sarlo, M., Tona, G. D. M., Trinder, J., & Stegagno, L. (2013). Nighttime cardiac
sympathetic hyper-activation in young primary insomniacs. Clinical Autonomic Research, 23(1), 49-56.
[12] Nano, M. M., Fonseca, P., Vullings, R., & Aarts, R. M. (2017). Measures of cardiovascular autonomic activity in insomnia disorder: A systematic review. PloS one, 12(10), e0186716.
[13] Dodds, K. L., Miller, C. B., Kyle, S. D., Marshall, N. S., & Gordon, C. J. (2017). Heart rate variability in insomnia patients: a critical review of the literature. Sleep medicine reviews, 33, 88-100.
[14] Jurysta, F., Lanquart, J. P., Sputaels, V., Dumont, M., Migeotte, P. F., Leistedt, S., & Van De Borne, P. (2009). The impact of chronic primary insomnia on the heart rate–EEG variability link. Clinical neurophysiology, 120(6), 1054-1060.
[15] Ohayon, M. M., & Reynolds III, C. F. (2009). Epidemiological and clinical relevance of insomnia diagnosis algorithms according to the DSM-IV and the International Classification of Sleep Disorders (ICSD). Sleep medicine, 10(9), 952-960.
[16] Yılmaz, B., Asyalı, M. H., Arıkan, E., Yetkin, S., & Özgen, F. (2010). Sleep stage and obstructive apneaic epoch classification using single-lead ECG. Biomedical engineering online, 9(1), 39.
[17] Mendez, M. O., Bianchi, A. M., Matteucci, M., Cerutti, S., & Penzel, T. (2009). Sleep apnea screening by autoregressive models from a single ECG lead. IEEE transactions on biomedical engineering, 56(12), 2838-2850. [18] Al-Angari, H. M., & Sahakian, A. V. (2007). Use of sample entropy approach to study heart rate variability in
obstructive sleep apnea syndrome. IEEE Transactions on Biomedical Engineering, 54(10), 1900-1904.
[19] Acharya, U. R., Fujita, H., Adam, M., Lih, O. S., Sudarshan, V. K., Hong, T. J., & San, T. R. (2017). Automated characterization and classification of coronary artery disease and myocardial infarction by decomposition of ECG signals: A comparative study. Information Sciences, 377, 17-29.
[20] Fujita, H., Acharya, U. R., Sudarshan, V. K., Ghista, D. N., Sree, S. V., Eugene, L. W. J., & Koh, J. E. (2016). Sudden cardiac death (SCD) prediction based on nonlinear heart rate variability features and SCD index. Applied Soft Computing, 43, 510-519.
[21] Hu, L. Y., Huang, M. W., Ke, S. W., & Tsai, C. F. (2016). The distance function effect on k-nearest neighbor classification for medical datasets. SpringerPlus, 5(1), 1304.
75
[23] Carter, J. R., Grimaldi, D., Fonkoue, I. T., Medalie, L., Mokhlesi, B., & Van Cauter, E. (2017). 0305 SYMPATHONEURAL AND CARDIOVASCULAR HYPERAROUSAL IN CHRONIC INSOMNIA. Journal of Sleep and Sleep Disorders Research, 40(suppl_1), A113-A113.
[24] Riemann, D., Spiegelhalder, K., Nissen, C., Hirscher, V., Baglioni, C., & Feige, B. (2012). REM sleep instability– a new pathway for insomnia. Pharmacopsychiatry, 45(05), 167-176.
[25] Tobaldini, E., Nobili, L., Strada, S., Casali, K. R., Braghiroli, A., & Montano, N. (2013). Heart rate variability in normal and pathological sleep. Frontiers in physiology, 4, 294.
[26] Abdullah, H., Patti, C. R., Dissanyaka, C., Penzel, T., & Cvetkovic, D. (2017, December). Support Vector Machine Classification of EEG Nonlinear Features for Primary Insomnia. In International Conference for Innovation in Biomedical Engineering and Life Sciences (pp. 161-164). Springer, Singapore.