Published online May 2, 2013 (http://www.sciencepublishinggroup.com/j/ajmp) doi: 10.11648/j.ajmp.20130203.14
Multi-range sources of electromagnetic radiation based
on a low-inductive extended z-discharge
V. A. Burtsev*, N. V. Kalinin, S. A. Vaganov
Ioffe Physical Technical Institute, Russian Academy of Sciences, ul. Politekhnicheskaya 26, St. Petersburg, 194021, Russia
Email address:
[email protected] (V. A. Burtsev)
To cite this article:
V. A. Burtsev, N. V. Kalinin, S. A. Vaganov. Multi-Range Sources of Electromagnetic Radiation based on a Low-Inductive Extended Z-Discharge, American Journal of Modern Physics. Vol. 2, No. 3, 2013, pp. 116-123. doi: 10.11648/j.ajmp.20130203.14
Abstract:
Pulse sources of electromagnetic radiation based on a low-inductive extended z-discharge are studdedexperi-mentally and numerically. Z-discharge is initiated by a high-voltage pulse generator through a long transmission line. It is shown that using a sliding avalanche discharge traveling wave, one can provide electrical breakdown of long discharge gaps in a wide range of initial gas pressure and produce a plasma column at moderate voltages of the generator. Sources alloy to obtain the electromagnetic radiation of different kinds, from red visible range up to hard x-ray one. A new non-pinch mechanisms of radiation generation are discovered in the soft and hard x-ray ranges of spectra. These mechanisms offer a higher efficiency of conversion of elecnrical energy to the energy of a radiating medium.
Keywords:
Sources Of Electromagnetic Radiation, Low-Inductive Z-Discharges, Sliding Avalanche Discharges1. Introduction
Upon publication of pioneering work [1], the wide appli-cation of fast extended z-discharges has resulted in the cre-ation of table-top discharge pumped lasers in many coun-tries. These lasers operate on neon-like argon ions with a lasing wavelength of 46, 9 nm in the extreme ultraviolet (EUV) range of the spectrum, and its active (laser) medium is collisionally pumped by a pinching longitudinal dis-charge. For gas preionization, an additional low-current longitudinal discharge is used. Here, the inner diameter of the coaxial current lead far exceeds the inner diameter of the discharge tube for the electrical field to penetrate into the discharge tube and electrical breakdown of long intere-lectrode gaps to occur.
Many attempts to create short-wavelength capillary EUV lasers using multiply ionized ions of heavy gases and va-pors that are capable of lasing near 13.5 nm have failed. The fact is that reguirements for the specific pump power become more and more stringent with decreasing lasing wavelength. Here, it is very important that unutilizing ener-gy remaining in the electric circuit by the end of the pump pulse be minimal. This energy will be inevitably dissipated in the discharge tube after the pulse unless special meas-ures to dissipate it are applied. If such measmeas-ures not taken, the wall of the capillary will be thermally overloaded and its life-time will shorten (as was observed in practice [2]).
In recent years, we have been developing sources of elec-tromagnetic radiation based on low-inductive ex-tended z-discharges with closely spaced electrodes. Such geometry allows magnetic energy minimization in the sys-tem. How-ever, the problem of gas preinization arises in this case, which cannot be solved by conventional means. The way out was through applying an avalanche sliding discharge, the trailing edge of which, reaching the exit tu-bular elec-trode, initiates a main longitudinal self-sustained discharge. Both discharges are fed by a single high-voltage pulse ge-nerator through a long transmission line prevent-ing the in-fluence of reflected waves on lasprevent-ing.
Obtained results were published in the proceedings of in-ternational conferences [3-8] and papers in scientific jour-nals [9-14]. In this work, we report new still unpublished data that are important for understanding the entire set of topical issues and for analyzing, in view of present-day concepts, the relevance of such investigations.
1.1. Experimental Setup
American Journal of Modern Physics 2013, 2(3): 116-123 117
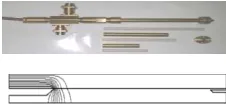
Fig. 1. Single-cable radiation source: (1) coaxial cable (2) set of sensors, (3) high-voltage electrode, (4) ceramic tube, (5) exit elec-trode, and (6) vacuum chamber.
Fig. 2. Eight-cable radiation source: 1-tyratron RC generator, 2-artificial double forming line, 3-transmission cable line, 4-disk cur-rent collecting unit, 5- Rogovsky coil, 6-current shunt, 7-capillary tube, 8- unit of diffe-rential pumping (not used), 9- unit of semi-conductor Si-diod.
In both cases, a discharge was initiated in a ceramic tube with inner and outer diameters of 5.5 and 10.5 mm, respec-tively. The length of the tube was 50 mm in the first mod-ification and 100 mm in the second one. The coaxial return current lead was adjacent to the ceramic tube, which was folded in a lavsan film to improve the radial electric strength.
The transmission lines were about 10 m long, so that waves reflected from the generator did not influence expe-rimental and numerical data.
Since the electric field penetrates into the low-inductive tube to a distance comparable to the diameter of the coaxial current lead, the additional discharge routinely used for gas preionization is inappropriate in this case and therefore we applied a sliding discharge. It was initiated from a sharp edge at the inner negatively charged tubular electrode. When in a high electric field, the edge emitted electrons and the thin walled ceramic tube favored the passage of considerable radial capacitive currents. Since the transmis-sion line “perceives” the discharge tube as an open end, the voltage at the input of the line doubles, causing intense multiplication of avalanche electrons and increasing the longitudinal velocity of the avalanche front.
The sources are equipped with a vacuum chamber for working gas (argon) supply and evacuation. The exit flanges of these chambers have either an optical window for visual observations and taking photos of the discharge or special devices to measure different types of radiation.
Sliding and high-current longitudinal discharges were in-itiated with a high-voltage pulse generator containing an artificial double pulse forming line with an oil–paper di-electric, a linear switch with electrical field distortion, a sharpening linear switch. The generator is capable of
giv-ing 100-ns wide voltage pulses up to 100 kV in amplitude with a rise time of 8 ns to a matched load [3].
1.2. Sliding Avalanche Discharge
The results described in Section 2 were obtained on the setup of the first modification, which was used at the early stage of investigation.
The time that the discharge front takes to travel from the sharp edge to the front face of the tubular electrode at the exit was fixed from the instant the total discharge current sharply rises and the input voltage of the tube sharply falls, both effects arising when the electrodes are closed by the plasma and the transmission line becomes short-circuited. The inset to Figure 3 shows the waveforms of the discharge current and voltage at the input of the tube (letters A and B mark the phases of the sliding and longitudinal discharges).
Fig. 3. Time the sliding discharge front takes to reach the exit elec-trode vs. the initial argon pressure: 1–4, branches of experimental data; II–IV, curves calculated by formulas (3)–(5), respectively. Uinc = 60 kV.
The dependence of sliding discharge front propagation time τ on the initial argon pressure, which was taken on the first modification setup, exhibits a broad minimum in the range 0.1–100 Torr (Figure 3). Near this minimum, the front propagation velocity reaches a maximum on the order of 109 cm/s at an input voltage equal to the double voltage of the incident wave, Ucap =2Uinc =120 kV. When the pressure goes beyond this range, the time delay of the main discharge grows but as the pressure approaches the atmos-pheric value, the delay decreases again. The left branch of the curve after growth tends to saturation at a pressure be-low 0.1 Torr.
The run of this dependence can be explained by analyz-ing elementary processes takanalyz-ing place in the discharge tube.
The capillary load (Figure 4) has geometry of so-called close placed electrodes. In such geometry, as shows numer-ical calculation a longitudinal component of electrnumer-ical field drops by e times over a distance roughly equal to inner diameter D of the return current lead.
Fig. 4. Photo of the capillary load (above) and field distribution in the interelectrode gap (below).
equia-real uniform distribution. Then, electrons emitted from the sharp edge of the ring high-voltage electrode may drift in a constant field along the tube with velocity ue. The time of avalanche discharge front propagation to the front end of the field distribution is D/ue. We will assume that the charging of the ceramic coaxial capacitor fixed in position D starts at this moment. Charging proceeds with time con-stant ρClD, where Cl is the capacitance per unit length. After charging, the potential of the sharp edge of the elec-trode moves to depth D and the electric field fills another length D. Avalanche electrons continue drifting along the tube and this process will persist until the avalanche front reaches the exit electrode. In this model, the total time of sliding discharge propagation to the exit electrode is given by
τ = l/ue + ρC (1) The first (drift) term in this expression will depend on the pressure and type of the gas and also on the electric field strength. The drift velocity of electrons can be ex-pressed through their mobility, ue = µeE; then, through electron–atom collision rate νea; and finally through the collision cross section averaged from the electron thermal velocity distribution, <veσ>≈ ≈υeσea. As a result, we
ob-tain an expression for the drift term of the avalanche (Townsend) discharge propagation,
E p l e ea
dr υσ
τ ≈20 (2)
Here, υe- is the mean thermal velocity of electrons and
σea is the cross section of interaction between thermal elec-trons and gas atoms.
Now it is necessary to gain a deeper insight into the inte-raction cross section. First, consider part 3 of the plot τdr = f(p) in Figure 3. In the given pressure range and for the given field strength estimated by the formula
edge cap/r
U
E0 ≈ , where redge is the bending radius of the
electrode’s edge, elastic collisions are the main type of electron–atom interaction. Using experimental data for
) ( e
tr f ε
σ = , εe= f(E0/p)[15-17] and deriving approx-imating interpolation relationships from them, one can ar-rive at the simple expression
0 6
10
.
3
E
p
l
dr −=
τ
(3)where E0 is the field strength corresponding to the height of the rectangular distribution.
Curve III in Figure 3 was calculated using this expression (the capacitive part of the front transit time is ignored).
As for part 2 of the plot in Figure 3, we can state that in the given pressure range and for the given field strength, inelastic collisions, primarily electron-impact ionizations, are the main type of interaction. Because of very high values of E/p, ionization cross section σi drops
significantly and runaway electrons appear. The increase in the sliding discharge propagation time with decreasing gas pressure remains to be understood. However, if the field exponential distribution over the surface of the chamber is replaced not by the equiareal uniform distribution but by a combination of a narrow region of a high field and a wide region of a low field, a desired solution can be obtained. The narrow region will provide fast electrons, which, colliding with the wall, generate slow secondary electrons. The latter drift in the low-field region and generate avalanches with high multiplication. The mean thermal velocity of electrons corresponds to the left-hand branch of the curve σi = f(εe), which determines the dependence τdr = f(p) in the pressure range considered. The expression for branch II has the form
−
= − − 0.5
0 5 . 0 0 2 9 ) ( 13 ) ( 10 10 . 54 , 0 E p p E l dr
τ (4)
Here, the threshold character of ionization is taken into account. The field strength in the low-field region is about 1/20 of the field amplitude in the exponential distribution and so is insignificant. Curve II in Figure 3 shows the re-sults of calculation by formula (4).
Branches 1 and 4 call for special consideration. Here, we only note that branch 1 represents sliding discharge in va-cuum. Under such conditions, of great importance are bombardment of the walls by fast electrons and, respective-ly, secondary electron emission, as well as evaporation and ionization of the surface film material (gas filling near branch 1 can be ignored).
Branch 4 originates at p ≥ 300 Torr, when the thermal velocity begins to correspond to the left-hand branch of . In this case, a rise in the pressure causes a decrease in the mean energy of electrons, in the ionization cross section, and hence, in the time of sliding discharge front propaga-tion. Eventually, we have
(
)
0.5 9dr 0,18.10 0/
τ = −l E p (5) The results of calculation by formula (5) are represented by curve IV in Figure 3. Agreement between calculated and experimental data is seen to be very good, especially if the roughness of the model and the far extrapolation of the electron–atom interaction cross sections toward large E/p (because of the lack of pubished data) are taken into ac-count.
American Journal of Modern Physics 2013, 2(3): 116-123 119
transit time never becomes zero, which would mean an infinite front velocity. Here, some fundamental law shows up; however, it is clear that the voltage pulse must be shorter than 5 ns; otherwise, the sliding discharge may be-come unstable.
Fig. 5. Time the sliding discharge front takes to reach the exit electrode vs. the initial argon pressure for incident wave voltage Uinc = (1) 40, (2) 50, (3) 60, and (4) 70 kV.
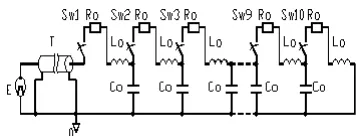
Good agreement between the experimental and calcula-tion data allowed us to further exploit our model of a slid-ing discharge, now in the framework of electrical engineer-ing. Let us consider a discharge tube as a shorted end ar-tificial line each section of which is a D long piece of a tube with parameters C0 and L0 (Fig. 6). In contrast to [18], each section contains resistance R0 of a plasma cylinder and switch Sw with switching time delay ∆τ relative to the previous section. This time delay simulates the time the sliding discharge front to travel distance D. The value of ∆τ is taken from experimental or calculation data in accor-dance with the initial pressure of the gas (Figure 3).
Fig. 6. Equivalent circuit of the capillary load fed by the high-voltage pulse generator through transmission cable.
Thus, the traveling wave of the sliding discharge is si-mulated by a voltage wave propagating along the artificial line for a time governed not only by parameters C0 and L0 but also by total switching time n∆τ related to τ, which can be found experimentally or by calculation. When the vol-tage wave reaches the closed end of the artificial line, transmission cable line T discharges through resistance nR0. Such a pattern simulates the conditions of a main dis-charge with doubled current, which is steady because nR0 <<ρ.
Now, using the standard program P-Spice, we solve the problem of propagation of a step voltage pulse with rise time τu. First, we find the voltage at the input of the line
and the current passing through the closed end (Fig. 7).
Fig. 7. Calculated waveforms of the discharge current and voltage at the exit from the tube. Pulse rise time is 10 ns, n∆τ = (a) 30 ns (p = 0.01 Torr) and (b) 3 ns (p = 3 Torr).
It is seen that the solution correctly describes the peak-ing effect of the slidpeak-ing discharge on the discharge current and the truncation of the input voltage. This follows from com-parison of the waveforms in Figure 7 with the expe-rimental waveforms depicted in the insets to Figure 5. With transient ocsillations due to the connection of lumped-parameter sections averaged, comparison will be still more illustrative. Estimation of the average current at the stage of wave propagation along the line yields about 200 A, that is 0,1 of the short-circuit current amplitude. This value is nearly coincident with the current of the sliding discharge before its arrival at the output electrode in the respective wave-form shown in the insets to Fig. 5. With input data used in experiments and calculations chosen more carefully, quantitative agreement between the output values of the current and voltage can be achieved at both stages of the discharges: sliding and main.
The calculations mentioned above can be used both for processing experimental data and in project design work. Note also that such a model–computational approach could be useful as a supplement to experiments when gaining experimental data is difficult or expensive. In our case, this applies, for example, to the longitudinal propa-gation of the sliding avalanche discharge and its change to a high-current longitudinal discharge. The needed expe-rimental data could be recorded by optical devices alongside of the tube; however, one encounters great design and diagnostic difficulties in this case.
1.3. Radiative Characteristics of Main Discharges
First, we will consider experimental data obtained with the single cable model experimental setup. Figure 8 de-monstrates the summary of the dependences of signals from different radiation sensors on the initial argon pres-sure and charging voltage of the generator. The insets show the waveforms of the total discharge current and signals from the sensors recorded at various pressures. As the pres-sure grows, visible radiation Jv1 of the first pulse is re-placed by visible radiation Jv2 of the second pulse. This makes it possible to distinguish between the waveforms of the current and visible radiation intensity.
centers of gravity of the pulses, and different spectral com positions. For example, the centers of gravity of the first and second pulses are shifted, respectively, toward the be ginning of the main current and toward the end of the pulse. Note that the first pulse contains largely the violet compo nent of the spectrum, whereas the second pulse has the red orange one as we can see on Fig. 9. This occurs because of the change in character of discharges: diffuse in the first case and strimmer in the second.
p=0,5 Torr p=1,5 Torr p=21Torr
p=100 orr p=340 Torr p=750 Torr
Fig. 9. Oscillograms of discharge current and signals from photoamplif ers with optical filters at different pressures and Uinc=60 kV. range 220-650 nm, 2- orange range 500-650 nm,
nm, 4- violet range 240-420 nm.
For commensurable amplification gains of photoamplifi ers, visible radiation at the stage of the
practically absent. Thus, the definition of the sliding ava lanche discharge as a dark discharge is justified: a faint glow appears only at ultimate amplifications. This, by the way, also refers to the beginning of the first pulse lagg behind the fast front of the main current.
Such behavior of the discharge glow is supported by streak-camera photorecording of the discharge from the end face of the tube. Two photos of the discharge glow taken from the end face of the tube using a Bif
camera with an exposure time of 1.8 Figure 10.
a) b)
Fig. 10. Photos of the plasma glow taken from the end face of the tube at the stage of the sliding discharge (a) and at the stage of the longitudinal high-current discharge (b). p = 0.5 Torr and Uinc
The left image taken at a maximal amplification shows the stage of the avalanche sliding discharge lasting about 10 ns at an initial pressure of 0,5 Torr. A ring
fuse pale object with high azimuthal symmetry is seen. The centers of gravity of the pulses, and different spectral com-positions. For example, the centers of gravity of the first and second pulses are shifted, respectively, toward the
be-in current and toward the end of the pulse. Note that the first pulse contains largely the violet compo-nent of the spectrum, whereas the second pulse has the red-orange one as we can see on Fig. 9. This occurs because of
ges: diffuse in the first
p=0,5 Torr p=1,5 Torr p=21Torr
p=100 orr p=340 Torr p=750 Torr
Oscillograms of discharge current and signals from photoamplifi-filters at different pressures and Uinc=60 kV. 1-visible
3- green range 400-500
For commensurable amplification gains of photoamplifi-ers, visible radiation at the stage of the sliding discharge is practically absent. Thus, the definition of the sliding ava-lanche discharge as a dark discharge is justified: a faint glow appears only at ultimate amplifications. This, by the way, also refers to the beginning of the first pulse lagging
fast front of the main current.
Such behavior of the discharge glow is supported by camera photorecording of the discharge from the end face of the tube. Two photos of the discharge glow taken from the end face of the tube using a Bifo K008 CCD ns are presented in
a) b)
Photos of the plasma glow taken from the end face of the tube at the stage of the sliding discharge (a) and at the stage of the longitudinal
inc = 60 kV.
The left image taken at a maximal amplification shows the stage of the avalanche sliding discharge lasting about 10 ns at an initial pressure of 0,5 Torr. A ring-shaped dif-fuse pale object with high azimuthal symmetry is seen. The
right photo is a somewhat overexposed but fairly uniform image of the main longitudinal discharge. Thorough phot graphing of this stage of the discharge did not reveal di tinct pinching. It rather looks like a weakly compressed z pinch.
Let us now focus on X-ray measurements (Figure 8). Hard X rays were extracted through a 50
window and detected with a plastic scintillator, a long opti cal fiber, and a photoelectric multiplier. In addition, alumi num foils were used to estimate the hardness of the radia tion by the absorbing foil method. Estimates showed that the hard component of the radiation has quanta with an energy of 15–20 keV. The time variation of the intensity of this component correlates in general with the form of the main longitudinal discharge, except its frontal part. At the stage of the sliding discharge, such radiation is not o served (see the upper-right inset to Fig. 8).
Fig. 8. Amplitudes of the first (Jv1) and second (Jv2) pulses of visible radiation and the amplitudes of hard (Jx) and soft (Jsx) X
the argon initial pressure p at incident wave voltage Uinc = (1) 70, (2) 60, (3) 50, and (4) 40 kV.
With RF-3 X-ray film folded in dense black paper, a footprint of the X-ray beam after 50 pulses was obtained at a distance of 50 mm from the output tubular electrode (Figure 11). The core diameter of the footprint equals the diameter of the through hole of the electrode (3.5 mm); that is, no considerable divergence of the beam was ob
That this footprint belongs to the X to the electron beam, was proved by appl
magnetic field to it: the glow pattern did not change.
Fig. 11. X-ray beam footprint on the film folded in de 0.01 Torr.
The discovered thin X-ray beam deserves special inve ti-gation.
right photo is a somewhat overexposed but fairly uniform itudinal discharge. Thorough photo-graphing of this stage of the discharge did not reveal dis-tinct pinching. It rather looks like a weakly compressed
z-ray measurements (Figure 8). Hard X rays were extracted through a 50-µ-thick beryllium window and detected with a plastic scintillator, a long opti-cal fiber, and a photoelectric multiplier. In addition, alumi-stimate the hardness of the radia-tion by the absorbing foil method. Estimates showed that
hard component of the radiation has quanta with an 20 keV. The time variation of the intensity of this component correlates in general with the form of the main longitudinal discharge, except its frontal part. At the arge, such radiation is not ob-right inset to Fig. 8).
Amplitudes of the first (Jv1) and second (Jv2) pulses of visible radiation and the amplitudes of hard (Jx) and soft (Jsx) X-ray pulses vs.
incident wave voltage Uinc = (1) 70, (2) 60,
ray film folded in dense black paper, a ray beam after 50 pulses was obtained at a distance of 50 mm from the output tubular electrode diameter of the footprint equals the diameter of the through hole of the electrode (3.5 mm); that is, no considerable divergence of the beam was ob-served. That this footprint belongs to the X-ray beam, rather than to the electron beam, was proved by applying a transverse magnetic field to it: the glow pattern did not change.
ray beam footprint on the film folded in dense black paper. p =
inves-American Journal of Modern Physics 2013, 2(3): 116-123 121
Let us return to Fig. 6. A semiconductor (silicon) diode protected against visible radiation by a 2-µm-thick alumi-num foil detected EUV radiation. The diode was unbiased and operated as an electromotive force sensor. Signal Jsw appeared at gas pressure p0 ~ 0.1 Torr, reached a maximum at 0.2 Torr, and disappeared at a gas pressure above 0.4 Torr. In this pressure range, hard X-rays were still observed but the silicon diode could not detect them. With one more 2µ-m-thick aluminum foil added, the EUV signal almost disappeared and we could estimate the hardness of hν quanta from the signal ratio logarithm. Since the depen-dence of the mass absorption factor on the quantum energy in this spectral range is uncertain, the quantum energy can be estimated as falling into the interval 15–80 eV (80–15.5 nm). Note also that the UEV pulse is much shorter than the pulse of hard X-ray radiation and it is emitted from the frontal part of the current pulse (see the lower-right inset, Fig. 6).
1.4. EUV Radiation on the Front of the High- Current Dis-Charge
The discovery of EUV radiation in a narrow range of ar-gon initial pressure on the setup of the first modification attracted our attention in view of its application in short wavelength lasers. Investigations were continued in the setup of the second modification, which can operate at higher discharge currents owing to eight cables connected to the transmission line at longer discharge tubes (l = 100 mm).
The time integrated photos of the discharge plasma tak-en from the tak-end face of the tube showed that in this case, unlike the case of the single-cable source, effective pinch-ing of the discharge takes place at low pressures (Figure 12a). At higher pressures, either a weakly compressed pinch is observed, as before (Fig. (b), or the discharge re-mains walls of the tube (c).
(a) (b) (c)
Fig. 12. Time-integrated patterns of the discharge glow attenuated by absorbing neutral filters. Argon initial pressure is p = (a) 0.1, (b) 0.3, and (c) 0.6 Torr. Uinc = 50 kV.
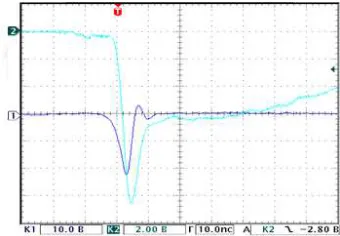
The waveforms of the total current and signal from the diode demonstrate a forerunner pulse of EUV radiation, which arises as early as at the stage of sliding discharge (Figure 13) and disappears with a rise in the pressure (b). The main radiation peak almost always begins simulta-neously with a sharp rise in the current and cannot be attri-buted to pinching even at low pressures, when pinching does take place.
Fig. 13. Waveforms of (1) signals from the Si diode and (2) total current in the foil shunt for initial gas pressure p0 = (a) 0.08 and (b) 0.20 Torr. The charging voltage of the double pulse-forming line is U0 = 60 kV.
Note that when the protective foil is used, the main peak decays abruptly, whereas in the case of the opened diode, decay is smoother. Moreover, the signal amplitude sharply grows and an extended pedestal persists for a long time (Figure 14). This indicates the presence of a relaxing plas-ma pinch in which the EUV component is generated at the very beginning. A sharp peak of the main longitudinal cur-rent nearly coinciding with the main peak of EUV radiation is also worth noting. When the first modification of the experimental setup was applied, this peak was hardly visi-ble (see the the lower- right inset to Figure 8).
Fig. 14. Waveforms of (1) signals from the open diode and (2) total cur-rent in the shunt for p0 = 0.2 Torr and Uinc = 60 kV.
The thickness of the absorbing foil is 0.8 .m. Arrows show the instant of sliding discharge initiation.
Figure 15. plots the amplitude of the radiation main peak versus the argon initial pressure for different thicknesses of aluminum foils.
As the thickness grows to 4µ, the radiation flux declines but remains significant at an initial pressure of 0.2 Torr, indicating the hardness of X-rays. The mean energy of quanta in the first and second peaks was estimated by the absorbing foil method using pairs of absorbents with differ-ent thicknesses. The second peak is of greater scidiffer-entific and applied value for developing EUV lasers, since lasing takes place throughout the tube and its forced amplification is possible. The first peak is related to radiation arising when the sliding discharge front approaches the exit electrode and is therefore of no interest.
In the maximum of the pressure dependence of the peak amplitude, we estimated linear absorption factor Le and then the quantum energy for pairs of foils with thicknesses 0.8/2.0 µm and 2/4 µm. In experiments, the intensity ratio of radiation passed through the first and second foils, ln(I1/I2) = (h2 – h1)/Le, was determined. In the first pair of foils, the quantum mean energy was 800 eV (λ is about 1.5 nm); in the second pair, 1200 eV (0.5 nm). These are mi-nimal values, since the curve of quantum flux attenuation in aluminum is uncertain in the given energy range, as fol-lows from computation using the program developed in the Lawrence Berkeley National Laboratory (available on the Internet [19]).
Measurements of the voltage at the input of the dis-charge tube may shed light on the generation mechanism of EUV–soft X-ray radiation. To this end, one of the cables was disconnected from the current-collecting unit of the source and terminated by a voltage divider, which meas-ured incident wave voltage Uinc. Another voltage divider measuring voltage Ucap at the input of the discharge tube was connected to the current-collecting disk through the free high-voltage socket. Typical waveforms of these vol-tages and total discharge current are shown in Figure 16.
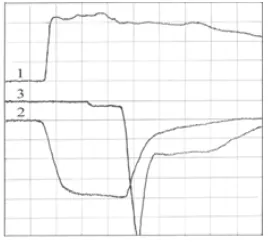
Fig. 16. Waveforms of the (1) incident wave voltage, (2). input voltage on the discharge tube, and (3) total discharge current (dimensional units). An arrow shows the instant of sliding discharge initiation. The time scale division is 10 ns. U0 = Uinc = 60 kV.
Note that the sliding discharge arises within 10 ns after the voltage is applied to the tube. This time, the so-called statistical time to appearance of avalanche generating elec-trons, must be minimized to avoid a large spread of ava-lanche starts.
Comparing the waveforms depicted in Figs. 11 and 13, one sees that the main peak of EUV–SX radiation occupies the center of the voltage trailing edge and starts at the
in-stant the current sharply grows and voltage sharply drops. This phase of the discharge can be referred to as the high-voltage self-sustained discharge with a high longitudinal electric field (10–20 kV/cm). Such a field may suffice to generate runaway electrons. This effect has long been known and is applied to generate electron beams in dis-charges, say, in gas-filled and vacuum diodes [20, 21]. In [21], a runaway electron beam obtained in hollow-cathode discharge was injected into a capillary to pump a multiple ionized ion active medium.
Here, runaway electrons generated throughout the dis-charge tube gain energy from the as yet high longitudinal electric field and lose it in inelastic collisions causing ioni-zation and excitation deeper levels of ions. The spike of the longitudinal current is due to fast electrons contributing to it. The quenching of EUV–SX radiation is related not to complete stripping of ions but to a fall of the electric field and quenching of runaway electron generation. Thus, it seems that the multiply charged ion plasma is pumped stepwise and X-ray radiation is generated and amplified throughout the discharge tube. To confirm such a nonpinch generation mechanism of short-wavelength radiation needs further investigations.
2. Conclusion
Azimuthally uniform gas preionization in a long (l≤150 mm) capillary tube is achieved. The low-inductive (1.5 nH/cm) discharge shows up as the traveling wave of a slid-ing avalanche discharge initiated at low workslid-ing voltages (below 100 kV) of the double pulse forming line. After the wave front reaches the exit electrode and the electrodes are closed, the sliding discharge changes to a high-current z-pinch with a reconfigured electric field. At the stage of the sliding discharge, the transmission line of the pulsed power source can be viewed as an open end with a doubled vol-tage, while at the stage of the high-current discharge, this load functions as a short-circuited end with doubled dis-charge current.
It is shown that such a discharge is a multi-range source of collimated radiation from white light to hard X-rays in dependence of working gas pressure. It can find application in many areas of knowledge including biomedicine.
New mechanisms of EUV–SX radiation generation in low-inductive extended z-discharges with using of running away electrons are found. These mechanisms are “stronger” than that based on a pinching discharge. To elucidate the feasibility of coherent EUV–SX radiation sources, it is ne-cessary to conduct spectroscopic experiments with a capil-lary of a variable length. Now, we are preparing new, third modification of experimental setup named “Extreme”.
This work was supported by the Russian Foundation for Basic Research, grant nos. 10-08-01042 and 12-08-01028.
Acknowledgments
American Journal of Modern Physics 2013, 2(3): 116-123 123
V.V. Zabrodskii and I. V. Miroshnikov for their assistance in experiment.
References
[1] J. J. Rocca, V. N. Shlyaptsev, E. G. Tomasel, O.D. Cortazar, D. Hartshorn, J.I. Chila. “Demonstration of a Discharge Pumped Table-top Soft X-Ray Laser”. Phys. Rev. Lett. 73, 2192 (1994).
[2] J. J. Gonzalez, M. Fratti, J. J. Rocca, N. Shlyaptsev, A.L. Os-teheld. “High power-density capillary discharge plasma col-umns for shorter wavelength discharge-pumped soft x-ray lasers” Phys. Rev.E 65, 026404 (2002).
[3] V. A. Burtsev, E. P. Bolshakov, A. S. Ivanov, N.V. Kalinin, V.I. Chernobrovin. “Electrodischarge radiation source of ca-pillary type”In Proceedings of the 9th International Confer-tence on X-Ray Lasers, Beijing, China, 2004, pp. 167–170.
[4] V. A. Burtsev, E. P. Bolshakov, A. S. Ivanov, N.V. Kalinin, V.I. Chernobrovin. “Fast z-discharges in low-inductive ca-pil-lary tubes”. In Proceedings of the 15th International Confe-rence on High PowerParticle Beams, St. Petersburg, 2004, pp. 450–453.
[5] V. A. Burtsev, E. P. Bolshakov, A. S. Ivanov, N.V. Kаlinin, V.A. Kubasov, R.F. Kurunov et. al. “Electrophysical prob-lems in creation of compact effective sources of short-wave-length radiation on plasma of capillary discharges”. In Pro-ceedings of the 15th IEEE International Pulsed Power Con-ference, Monte-rey, 2005, pp. 265–268; IEEE Trans. Plasma Sci. 34, 1929 (2006).
[6] V. A. Burtsev, E. P. Bolshakov, N. V. Kalinin, V.A. Kubasov, V.I. Chernobrovin. “Compact EUV laser on low-inductive capillary discharges.” In Proceedings of the 10th Interna-tional Conference on X-Ray Lasers, Berlin, 2006; Springer Proc. Phys. 115, 676(2006).
[7] V. A. Burtsev and N. V. Kalinin. “Study of energy balance in low-inductive capillary discharges in EUV sources”. In Pro-ceedings of theConference on Pulsed Power and Plasma Science, Albuquerque, New Mexico, USA, 2007, pp. 1695– 1698.
[8] V.A. Burtsev, N.V. Kalinin. “Numerical matching an EUV laser of recombination type on hydrogen-like ions of nitro-gen with a pulse energy supply system.” In Proc. of the 17- the IEEE Intewrn. Pulsed Power Conf. PPC-2009 (June 28-Julay 2, 2009, Washington, USA) IEEE 2009, pp.710-716.
[9] V.A. Burtsev, Е.P. Bolshakov, А.S. Ivanov, N.V. Kalinin,
V.A. Kubasov. « Electrophysical problems in creation of compact effective sources of short-wave-length radiation on plasma of capillary discharges.” In IEEE Transactions on Plasma Science.Special Issue on Pulsed Power Science and Technology, 2006, vol. 34, Issue 5, part 1, pp. 1929-1933.
[10] V.A. Burtsev and N.V. Kalinin. “On recombination nonequi-librium plasma in low-inductive capillary discharges” Tech-nical Physics Letters, vol. 33, No 2, pp. 139-142.
[11] V. A. Burtsev, E. P. Bol’shakov, N. V. Kalinin, V.A. Kuba-sov. “Soft x-ray radiation of low-inductive capillary dis-charge”,Vopr. Atom. Nauki Tekh., Ser.: Elektrofiz. Appara-tu-ra,No. 5(31), 251 (2010).
[12] V. A. Burtsev, E. P. Bol’shakov, D.V. Getman, Т. Lekomze-va, V.I. Chernobrovin, “Investigation of 100 kV linear gas dis-chager with electrical field distorsion” Technical Phys-ics, 2011, v. 56, No 7, pp. 950-956.
[13] L.A. Artyukov, V.A. Burtsev, A.V. Vinogradov, A.Yu.Devidenko, N.V. Kalinin et.al. “Sliced linear plates for hard x-ray radiation” Technical Physics, 2012, v. 57, No 9, pp. 1283-1288.
[14] V.A. Burtsev, V.V. Zabrodskii, N.V. Kalinin, E.P. Bolsha-kov. “Electromagnetic radiation sources based on a low-inductive extended z-discharge”. Technical Physics, 2013. Vol. 58, No. 2, pp. 192-199.
[15] Ju.P. Raizer. Gas discharge physics. (Nauka, Moscow 1980, Springer, Berlin, 1991. 592 p.
[16] Yu. D. Korolev, G.A. Mesyats. Physics of pulsed break-down in gases. (Nauka, Moscow, 1991). 221p.
[17] G.A. Mesyats, S.D. Korovin, K.A. Sharypov et al. Tech. Phys. Lett. 2006, v. 32, № 1, pp. 35-44.
[18] K. Kolacek, V. Bohacek, J. Schmit et. al. In Proceed. of the 12th Intern. Conf. on High-Power Particle Beams BEAMS-98 (Haifa, June 7-12, 19BEAMS-98, Israel), IEEE 19BEAMS-98, part 1, 619-622.
[19] Center for X-Ray Optics. Interactions with matter. http://www.cxro.lbl.gov
[20] V.F. Tarasenko, S.I. Yakovlenko. Plasma Devices and Oper-ations. 2005, v. 13, pp. 231-279.