Multiple Interface Scheduling System for
Heterogeneous Wireless Vehicular Networks:
Description and Evaluation
Cristian Roman
∗, Peter Ball, Shumao Ou
Oxford Brookes University - Department of Computing and Communication Technologies, Oxford, UK
Abstract
Reliable wireless communications between vehicles (V2V) and between vehicles and infrastructure (V2I) will play a key role in future transport networks. Where there is overlapping coverage of multiple Radio Access Technologies, with no cooperation between them, a vehicle can use the different technologies simultaneously. This paper proposes an uplink Multi Interface Scheduling System (MISS) located at an intermediate shim layer on the user side, to achieve efficient bandwidth aggregation, or lower end-to-end packet delay. MISS aims to find all the available networks that can meet multiple criteria based on user preference and required performance. Simulation results show that safety critical traffic can be prioritized where the resources are insufficient for all the services. Video delivery quality is also improved by prioritizing the most important frames. This algorithm is ideally suited to vehicular networks, where delivery of safety traffic and/or video is an essential requirement.
Receivedon 18 February 2016;acceptedon 29 February 2016;publishedon 10 January 2017
Keywords: Heterogeneous, Wireless, Radio Access Technology, Vehicular, Shim Layer, Dynamic, QoS, Safety, Video Copyright©2017 CristianRomanetal., licensedto EAI.Thisisanopen accessarticledistributedunderthetermsof theCreativeCommonsAttributionlicense(http://creativecommons.org/licenses/by/3.0/),whichpermitsunlimited use,distributionandreproductioninanymediumsolongastheoriginalworkisproperlycited.
doi:10.4108/eai.9-1-2017.152097
1. Introduction
The rapid growth in wireless technology in recent years has made large areas now have access to wireless networks. The paradigm of connected vehicles can thus become reality. Applications will include improved information to drivers, enhanced safety features, platooning, support for autonomous driving and infotainment. Nevertheless, vehicular users encounter unique challenges not faced by conventional indoor users, such as fast dynamically changing environments, imposing a set of new requirements on today’s wireless communication systems. Cellular technologies are presently the only solution to upload data from vehicles to control centres, with a large impact on cellular resource usage [1]. In the future, short range wireless technologies could be used cooperatively to support these new services forming heterogeneous wireless network (HWN). These networks can increase the available bandwidth, improve the reliability and
∗
Corresponding Author. Email:[email protected]
resilience of the communication path [2], and improve connectivity by combining the coverage areas of individual Radio Access Technologies (RATs) [3]. The network can allocate priorities for different traffic types, with safety critical applications receiving the highest priority. Even if this technology is primarily foreseen for safety purposes, other applications could take benefit from its deployment, such as video optimization, offloading cellular networks or enabling numerous large scale crowd sensing applications [4]. In an environment with continuous mobile coverage and sporadic Wi-Fi coverage, with no coordination between the different Base Stations (BS) and Access Points (AP), existing packet scheduling algorithms are unsuitable.
In this paper we present the Multiple Interface Scheduling System (MISS) (Section 3) and the shim layer approach (Section 2), which enables users to make flexible use of multiple radio access technologies from a user perspective in a transparent manner while prioritizing safety critical messages. This shall ensure that highly relevant safety messages can be exchanged
timely and reliably even when operating in a dense sce-nario. Simulation has been performed to demonstrate the concept (Section 4.1). The improvements of video quality using a video optimized profile have also been analysed (Section4.2). The RAT selection and dynamic switching mechanism is performed through a scoring system at the user end based on selected parameters with no coordination between the different radio access technologies (Section 3.2). No changes are required to the existing wireless standards, the networks do not have to be under the same operator and thus the imple-mentation costs of this solution are low.
2. Node Architecture and Related Work
To maximise the use of existing standards and to lower the implementation cost, our system maintains the Media Access Control (MAC) and Physical (PHY) layers unmodified. A shim layer, referred to as a layer ’2.5’, is proposed which is inserted between the network layer and the MAC layer of each of the wireless access technologies. Fig. 1depicts the system model. This shim layer hosts the algorithm described in section 3.3 (Fig. 6), that sends packets to the selected RATs, making the selection transparent for the upper layers. Each RAT exhibits different physical and logical features. They may use different frequencies or modulation schemes at the PHY layer, and they may use different media access techniques at the MAC layer. An important feature of this scheme is that one single Network/IP layer can characterise each node. Such an approach can be implemented for any IP based wireless technology/network and is not only restricted to vehicular networks.
Figure 1. Conceptual Model of the Shim Layer
In previously reported work, scheduling without modification of the wireless standards, has been carried out at the application layer [5], transport layer [6] and network layer [7] of the OSI (Open Standard International) layered data model. A full review of the different advantages and disadvantages of scheduling at these different layers can be found in [3].
The advantage of implementing the data scheduling at an intermediate level between the MAC layer and the IP layer is that the solution is tailored to the available lower layers and transparent to all the upper layers. There is no modification to the existing wireless standards (PHY and MAC layers) and one device can have one IP address, in contrast to previous mentioned solutions which require one IP address for each RAT. A similar intermediate shim layer approach between the network layer and the MAC layer was taken for IEEE 802.21 Media Independent Handoff (MIH) but the key feature was to provide a common interface for managing events and control messages exchanged between network devices [8].
There is an important difference between the uplink and downlink in our shim layer approach. Even though our shim layer works for both uplink and downlink, this paper only addresses the user perspective approach of the uplink. A single path is used for downlink. The focus is set on the uplink, rather than the downlink, as several emerging applications treat vehicles as data sources in mobile sensor networks, where a variety of sensors (GPS, cameras, on-board diagnostics) acquire and deliver data about the surrounding environment [9]. The uplink model does not require any changes to the current infrastructure as the packets will be forwarded to the Base Station/Access Point and from then on the packets follow a standard route to the destination. The problem of packet reordering at the receiver has been left for a further study. The downlink operator side requires the router in the cloud to have a table specifying the number of interfaces/technologies each user has, check their availability, and redirect the packet to one of the users’ points of attachment (BS/AP) to the network.
Transmission Schemes. A multi RAT terminal features
Although heterogeneous networks bring advantages, a number of issues arise. In addition to the duplicate acknowledgements issue [6], delays related to packet re-ordering at the receiving end are common. In Earliest Deadline Path First (EDPF) [11] the scheduling algorithm artificially throttles transfer rates on faster paths with the aim of receiving packets in order and thus reducing the time needed to re-arrange them. This is not an acceptable solution for safety-critical information as it can cause an increase in delay but also a drop in link utilization and throughput. To solve such priority issues, a Quality of Service (QoS) approach has been taken by the 802.11e amendment with a traffic type classification mechanism but it is only applicable for wireless LAN applications (802.11) and does not include other RATs, such as cellular or Bluetooth.
Multi Attribute Decision Making. Any QoS routing
algorithm has to strike a balance between overhead and quality. Multi Attribute Decision Making (MADM) algorithms have been used in heterogeneous wireless network environments, in order to choose the best RAT, to find acceptable alternatives or to find the best alternative [12]. A direct comparison between these algorithms is difficult as it requires the use of another MADM algorithm. They can nevertheless be split into two main categories: compensatory and non-compensatory.
Compensatory algorithms combine multiple attributes to find the best alternative, such as Simple Additive Weighting (SAW), Multiplicative Exponential Weighting (MEW), Gray Relational Analysis (GRA), Technique for Order Preference by Similarity to an Ideal Solution (TOPSIS), etc. GRA uses a reference matrix, set subjectively by the user, to compare the matrices obtained for each network. An advantage of the GRA approach compared to the other listed algorithms is that it selects the network that offers a QoS closest to that which is being requested by the service, and not the network that has the best QoS but far exceeds the services’ QoS requirement. On the contrary, non compensatory algorithms are used to find acceptable alternatives which satisfy a minimum cutoff [13]. Our algorithm approach is a combination between the two: we adapt a compensatory algorithm by adding minimum cut-off values and calculating the resulting score.
3. Multi Interface Scheduling System
In this section the details of the Multi Interface Scheduling System are presented, starting with the system model (3.1), followed by the scoring system (3.2) and finishing with the scheduler (3.3).
3.1. System Model
The shim layer consists of a classifier, five traffic category queues and a Multiple Interface Scheduling System (MISS) [14], as shown in Fig.2. Packets arriving from Layer 3 are classified into five different queues based on their traffic category (video, voice, best-effort, background and safety critical). The MISS system is divided in two asynchronous parts: the utility scoring system (section 3.2) and the scheduler (section 3.3). The scoring system is comprised of different utility functions and reference values, described later in section 3.2. The scheduler makes use of the scores provided by the scoring system to distribute the packets across different RATs, simultaneously at each of its iterations. After monitoring the queue sizes, the scheduler requests a score calculation and sends the packets to the appropriate RATs based on the received scores, making the process transparent for the upper layers. The entire system (MISS) inside the shim layer and the links between the units is presented in theShim
Layer Flowchart(Fig.3).
Classifier Incoming Packets from L3
MISS Scheduler
Video Voice Best-Effort Background Safety Critical
RAT 2 RAT
1
RAT n
Shim Layer
L2
Figure 2. Detailed consistency of shim layer
3.2. Scoring System
Figure 3. Shim Layer Flowchart
user-end. Selection of a non-optimal network creates undesirable results such as poor QoS or the use of a more expensive network [15].
In our scoring approach, three steps, based on six parameters, define a validation process for a RAT to get a score (Sx):
1. Application Validation(Bandwidth and Delay)
2. Network Validation- (SINR and Vehicle Velocity)
3. User Preference Validation - (Cost and Energy
Consumption)
The score of each RAT (Sx) is used in the scheduler
for the distribution of packets across different RATs, as described in section3.3. Why is the scoring divided in the above mentioned three steps? We consider that a successful packet transmission involves the three different categories but they can be treated independently. In other words:
i An application is not concerned about the network on which the data is sent or the user preference.
ii The network path is not concerned about the traffic type.
iii A user is not concerned about the underlying network concepts.
Application Validation - The network viewed by the application.
Each application (queue type) has a table with reference values, similar to [15] or [16]. The initial step is to
0 0.1 0.2 0.3 0.4 0.5 0.6 0.7 0.8 0.9 1
0 0.1 0.2 0.3 0.4 0.5 0.6 0.7 0.8 0.9 1
x
Utility (x)
BW Velocity Cost Power
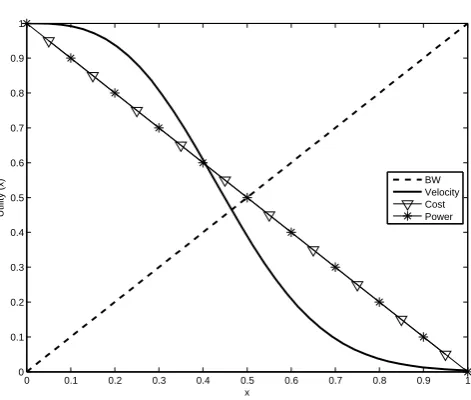
Figure 4. Example of Utility Functions
compare the delays and bandwidth of each RAT. If the RAT values do not meet the required reference for a specific applicationz, the RAT is eliminated. Otherwise, they are validated to the next stage and a score is allocated based on the utility function from Fig.4[10]. The x axis is dynamically set to have the reference bandwidth (Bz) set to 0.5.
The score for the bandwidth (bxz) is limited to a
maximum score of 1. At this point the scoring equation is as follows:
Sxz =bxz (1)
whereSxzis the score of RATxfor queue typez.
In a heterogeneous wireless network environment, when an application requires higher throughput than the individual RATs can provide, the bandwidth offered by the RATs can be aggregated to create a larger logical link with enough bandwidth to meet the desired throughput guarantees (b1+b2+...+bx) [3].
Network Validation - The network viewed by the network.
Another elimination factor is applied for the Signal to Noise plus Interference Ratio (SINR), specific to each RAT (i.e. Wi-Fi: -94dBm; LTE: -140dBm). If the RATs meet this threshold they continue the scoring system, otherwise, they are eliminated. The SINR is either obtained by feedback from the base station or, if not available, replaced by the received signal strength.
The velocity score (vx) is obtained by using different
utility graphs for each technology as it does not have a similar influence on Wi-Fi and on cellular technologies. A velocity score for each RAT is obtained on the specific utility functions and then multiplied with the bandwidth score, resulting in an updated scoreSx.
Figure 5. Scoring Flowchart
All the RATs that have a score higher than 0 are validated for the next and last stage.
User Preference Validation - The network viewed by the user.
In this last scoring part the different weights and user preferences are taken into consideration. The cost and energy consumption (cx, ex) are predefined values for
each technology. The cost and energy weights (wc,we)
are chosen by the user. If cost is not important for a user, the weight is set to 0, and thus it does not influence the score. If it is considered important, the weight can be set up to a value of 1. These two parameters and their weights define the final score.
Sx=bxz·vx·(cx·wc+ex·we) (3)
A summary of the scoring system is illustrated in the flowchart in Fig.5.
Parameter Values Update. The delay, bandwidth, SINR
are calculated independently from the scheduling algorithm. Every time a new packet is received by the shim layer from the lower layer, their values are updated. The algorithm relies on path monitoring, such as acknowledgement (ACK) information for periodic updates on throughput and delay. Reliability can be determined by measuring some PHY layer parameters of the subsystem, such as signal strength and continuous link uptime [17]. This is to adapt allocation ratios and transmission schedules to network changes. The speed of the car is assumed to be obtained from the car via the application layer. At moments, certain performance indicators might not be available or precisely obtained and are better to be set with
Figure 6. MISS Scheduler Algorithm
1: q: queue
2: z: chosen queue to send packets from 3: n: number of packets to send
4: mz: max packets to send (based on profile)
5: a: number of available RAT
6: Sxz: Score of RAT x for queue typez
7: loop(MISS) (void)
8: calculateSchedulerAvailableRATs() 9: queue()
10: trafficDistribution(z,n) 11: Ifa,0,∀q,z, queue(); 12: end loop
13: functionqueue(void)
14: Check length of each Queue (q)
15: ifqsaf ety ,0thenz=qsaf ety, n≤msaf ety
16: else ifqvideo ,0then 17: z=qvideo;n≤mvideo
18: else
19: z=qx;n=mx;
20: end if
21: returnz, n
22: end function
23: functiontraf f icDistribution(z, n) 24: getRATScores(n)
25: n→ ∀RATs,Sxz>0
26: end function
27: functiongetRAT Scores(queueType) 28: CalculateSxzreturnSxz
29: end function
*→:to be read as’send on’
fuzziness [18]. This approach has been left for a further study.
Different User Policies. Different policies influence the
3.3. Scheduler
The scheduler’s main purpose is to distribute the pack-ets from different queues based on users choice/profiles by responding to QoS standards and safety critical applications. The scheduler is asynchronous to the clas-sification of the packets in the different queues. The scheduler allocates packets to each RAT based on the score provided by the scoring system. The computa-tional complexity and overhead of the packet by packet algorithm can be improved by making RAT selection only every a certain number of iterations, rather than packet by packet as it is currently the case.
The scheduling algorithm presented in Fig.6has the following procedure:
1. Determine the number of available RATs for each iteration of the scheduler.
2. Determine the queue type to send packets from (z) and the number of packets to send (n).
3. Calculate the score of each available RAT (Sx) for
the retrieved queue (z).
4. Packets are sent on the available RATs withSx>0.
5. If there are available RATs remaining for that iteration, the process is repeated for the lower priority queues.
In a vehicular environment, safety critical informa-tion needs to have priority over all other traffic types. The queue selection always accommodates the safety critical queue. If this queue is empty, the other queues are served, in the following order: video, voice, best-effort and background.
4. Simulation Results
The objectives of the simulation are to demonstrate the feasibility and transparency of scheduling at the shim layer, to show that a multi-queue multi-RAT approach can respond to the prioritisation of safety critical messages in vehicular networks (4.1) and to show the benefit of using specific profiles in terms of video QoS and QoE (Quality of Experience) (4.2).
The software used for simulation is NS-3 (Network Simulator 3). The considered simulation environment is shown in Fig.7and was chosen to have all possible coverage combinations. The moving vehicle travels at a constant speed (18km/h) and passes through the different coverage areas ( 1 , 2 , 3 in Fig. 7). As a result the coverage environment is continuously changing, every 10 seconds in this case. The simulation parameters and values are presented in table1.
The algorithm is set with the following priorities: while up to three safety packets, one on each RAT, can be sent for one scheduler iteration, up to two video
Table 1. NS-3 Simulation Setup
Parameter Value
WAVE 1 802.11p
Transmission Rate 6Mbps
Delay 0.0024s
Wi-Fi 2 802.11n 2.4GHz
Transmission Rate 21.9Mbps
Delay 0.00173695s
Wi-Fi 3 802.11n 5GHz
Transmission Rate 27Mbps
Delay 0.00170844s
Shim Layer Queue Type CoDel
Propagation Two-Ray
Video Traffic 2Mbps
Voice Traffic 20kbps
Background Traffic 256kbps
Best-Effort Traffic 256kbps
Safety Traffic 10kbps
Packet Size (unless specified) 1448 Bytes
Transport Layer UDP
Network Layer IPv6
Addressing Static
Vehicle Speed 18km/h (5m/s)
Simulation time 70s
Network Simulator NS-3.22
WLAN
802.11p 802.11n - 5 GHz
WLAN 802.11n - 5 GHz WLAN
802.11n - 2.4 GHz
WLAN 802.11n - 2.4 GHz
1
2
2
3
3
Figure 7. Simulation Scenario
packets can be sent at a time and only one of the remaining queue types. The priority queue operates in a greedy way as long as the priority queue is not empty. Only when the priority queue is empty, the other queues will be served and the algorithm becomes a weighted fair queuing.
0 10 20 30 40 50 60 70 0
0.5 1 1.5 2 2.5 3 3.5
4x 10
5
Time (s)
Bytes/s
RAT 1 RAT 2 RAT 3
1 1+2 2 2+3 3 3+1 1+ 2+ 3
Figure 8. RAT Distribution Scenario
Taking two networks both with low but totally different traffic loads, the load balancing process ignores the two networks’ low traffic loads but retains only the relative large difference between the two. This leads to excessive traffic load balancing between the two networks and compromises the importance of other attributes. The following set of experiments show that our algorithm is capable of distinguishing between different service types and does not react as a simple load balancing algorithm.
4.1. Prioritization of Safety Critical Messages
The following set of results are obtained in a scenario where the vehicle has access to all three RATs in order to show the improvement in delay and throughput for safety critical traffic when the channel/medium is saturated. This is performed by increasing the video traffic data rate on the user side. The packet size for the safety critical messages is 150 bytes. The calculated end-to-end packet delay of Figs 10, 11, 12, represent values of successful received packets.
Fig. 9 depicts the Packet Delivery Ratio versus Load and it can be observed that the packet delivery ratio considerably decreases with the Switched Scheme once saturation of a Single RAT (SR) is reached. The Saturation Multi-RAT (MR) corresponds to the saturation point of the combined radio access technologies. The MISS algorithm provides a 99.9% delivery ratio of safety messages in both single and multi RAT environment, saturated or not. In the switched scheme, due to the single queue and the difference in the amount of transmitted packets, the packet delivery ratio for the safety messages is lower than the video ones.
10 20 30 40 50 60 70 80
0 10 20 30 40 50 60 70 80 90 100
Load (Mbps)
Packet Delivery Ratio (%
)
Switched Video Switched−Safety MISS−Video−SR MISS−Safety−SR MISS−Video−MR MISS−Safety−MR Saturation MR Saturation SR
Figure 9. Packet Delivery Ratio
0 5 10 15 20 25 30 35 40 45 50
0 0.005 0.01 0.015 0.02 0.025
Load (Mbps)
Delay (s)
Video Voice Best−Effort Background Safety
Figure 10. Delay Before Saturat ion vs Load
In Fig.10the average end to end delay with a MISS system for different traffic types is plotted in a scenario where saturation is not reached. The safety critical delay remains constant while the other traffic types are affected by the load, demonstrating the efficiency of the algorithm. The Background traffic stops after a 30Mbps load because no packets are received.
In Fig. 11 our proposed algorithm is compared to a standard switched scheme when only one RAT is used at a time, for the video and safety traffic types. The rest of the traffic types are not plotted since they are not transmitted after saturation. It can be observed that the end-to-end delay for safety critical is greatly improved compared to a switched approach for a load that exceeds the capacity of a single RAT.
0 10 20 30 40 50 60 70 80 0
0.05 0.1 0.15 0.2 0.25 0.3 0.35
Load (Mbps)
Delay (s)
Video MISS Safety MISS Video Switched Safety Switched Saturation
Figure 11. Delay vs. Load Comparison
0 10 20 30 40 50 60 70 80
0 10 20 30 40 50 60
Average Throughput (Mbps)
Load (Mbps)
0 10 20 30 40 50 60 70 80
0 0.05 0.1 0.15 0.2 0.25 0.3 0.35
Average Throughput (Mbps)
Video Voice Best−Effort Background Safety Saturation
Figure 12. Throughput vs Load
left abscissa corresponds to the video plot, while the right abscissa corresponds to the other traffic services. It can be observed that the safety critical traffic type has a constant throughput rate, even after saturation, while the other traffic types are loosing throughput as the load increases.
4.2. Video Evaluation
The scenario of automated driving in Intelligent Trans-port Systems (ITS) where real-time video transmission is required or where video is transmitted back from a vehicle to a control centre is assumed to be the target application in this section. Infotainment provision can also be considered. We evaluate the difference in video quality based on different parameters and profiles of the algorithm in the shim layer.
Table 2. EvalVid and Video Characteristics Table
Parameter Value
Evalvid Version 2.7
Video ’Highway’
Encoding MPEG-4
Encoder ffmpeg (N-74587)
Frames 2000
I Frames 67 (161 packets)
P Frames 1933 (1933 packets)
B Frames 0
Average Packet Size 251 Bytes
I Frame 928 Bytes
P Frame 228 Bytes
B Frame 0
Number of papers have studied mechanisms support-ing QoS in different types of networks but much less has been done to assess the quality achieved by a unified heterogeneous vehicular approach.
EvalVid. The evaluation of video QoE and QoS is
usually performed with the evaluation of a Mean Opinion Score (MOS). Nevertheless the expensive and complex subjective tests, based on the MOS scale, may not be affordable. Objective metrics have been developed to emulate the quality impression of the human visual system (HVS) to respond to the numerous tasks in industry and research that require automated methods to evaluate video quality [19]. The ability of performing MOS calculation in real time [20] can be very useful for ITS. Nevertheless in this paper we use EvalVid [19], a non real-time evaluation framework, for the video evaluation process. Due to its modular structure, EvalVid can be used both in real experimental set-ups and simulation experiments. In the following set of experiments the ’Highway’ sample, in YUV1 format, from the EvalVid video database [21] was chosen and encoded with MPEG-4. It is to be noted that any video can be assessed with the EvalVid framework but theHighwayvideo is the closest match to our previous described ITS environment - a car driving down a highway.
MPEG Decoder and Frame Types. The MPEG standard
defines three types of frames: I, P , and B. I frames
contain an entire image, which can be decoded independently.P framesare predicted frames which can only be completely decoded if the previous I or P frame is available.B framescan be decoded completely only if the previous and successive I or P frame is available. However, I-frames contain the most amount of bits.
1Refers to a family of colour spaces, similar to Red-Green-Blue(RGB)
0 0.0050.010.0150.02 0.0250.03 0.0350.040.045 0.05 0 5 10 15 20 25 30 35 40 Delay (s) PDF Ideal Single RAT Multi RAT (a)PDF
0 0.0050.01 0.0150.020.025 0.030.035 0.040.045 0.05
0 0.1 0.2 0.3 0.4 0.5 0.6 0.7 0.8 0.9 1 Delay (s) CDF Ideal Single RAT Multi RAT (b)CDF
Figure 13. Video Frame End-to-End Delay
Additional type of frames, e.g. slice S frames, can be found in MPEG-4 but they are not used in this paper.
The technical characteristics of the tested Highway
video can be found in Table.2.
Video Delay. In video transmission systems it is not
only important to receive all the frames but also have frames that are displayed at a constant rate with a low variation of delay between frames. Package delay variation leads to jitter. These issues are generally addressed by buffers but the details of this technique goes beyond the scope of this paper. In a heterogeneous approach where all the available links are used, the frames need to be sent in order to accommodate the estimated delay in the link and avoid excessive re-ordering at the receiver end. As described in the literature review, the EDPF algorithm artificially throttles transfer rates on faster paths with the aim of receiving packets in order. Such an approach has been left for a further study for the MISS algorithm.
Non Saturated Environment. In the following section
experiments have been carried out with the mobility scenario described previously (Fig. 7), with no satu-ration of the data link. The probability distribution function (PDF) (Fig. 13a) and cumulative distribution function (CDF) (Fig.13b) of the end to end delay of the video frames show that the shim layer is beneficial even when there is only one RAT available. The reduction of the frame end-to-end delay by the MISS algorithm can result in better real-time video quality by reducing the buffering at the receiver end. The PDF and CDF also show that when there are multiple RATs available the algorithm can send the packets on the link with the lowest delay and approach the ideal situation. As stated in the MISS Scoring System (Section3.2), our algorithm bases its decision on both delay and throughput, and can choose the RATs which responds best to the video requirements. If the algorithm is to choose the RAT which has the highest throughput but ignore the link delay, frame jitter can occur and it is not suitable for a live video stream. The situation clearly improves when multiple RATs are used and gets closer to an ideal
30 40 50 60 70 80 90 100
1.4 1.6 1.8 2 2.2 2.4 2.6 2.8 3 3.2 MOS Load (Mbps)
30 40 50 60 70 80 90 100
600 800 1000 1200 1400 1600 1800
Rx Frames (NoF)
Load (Mbps)
All Video Tagged (MOS) Video Optimized (MOS) All Video Tagged (NoF) Video Optimized (NoF)
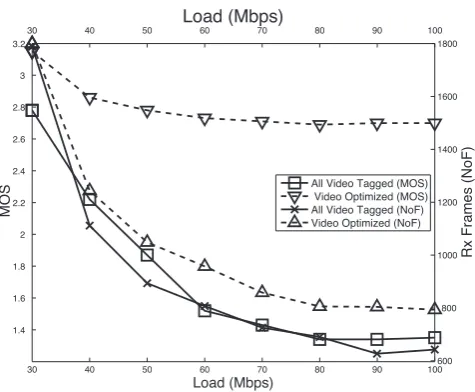
Figure 14. Comparison between MOS and Number of Received Frames with Video Optimization enabled
situation. The ideal situation was calculated with no interference, saturation or delay, between the sender and receiver.
Prioritizing I Frames. In a saturated environment, the
algorithm approach chosen is slightly different with
the "optimized video"profile. If the video is of critical
importance, such as in search and rescue situations or remote image processing for automated driving, but the available network capacity can not respond to the video demand, the MISS algorithm distinguishes between the different video frame types and places the most important frames (I) in the safety queue. The other frames remain placed in the designated video queue. The results are presented in Fig. 14: The data rates under 30 Mbps (no saturation) are not plotted as they have a 100% delivery rate and a MOS close to ideal. The simulation was performed with a single RAT available (RAT 3 from Table 1). It can be observed that when I Frames are tagged as safety packets, even if the received Number of Frames (NoF) decrease with an increasing load, the MOS is relatively constant. On the contrary when there is no differentiation between the video frames, the MOS degrades with the number of received frames. For 137 extra frames transmitted (6.85% of total frames) there is a quality improvement of 54% (1.4 compared to 2.77). It can also be observed that the number of received frames is constant after a 80 Mbps load, as a result of the applied CoDel queue in the shim layer. The CoDel queue [22] eliminates the expired saturation packets from the queue, thus reducing the queue time.
Saturated Environment. In the following saturated
1 2 3 0
0.5 1 1.5 2 2.5 3 3.5 4
MOS
Ideal Switched scheme Standard MISS Video Optimized No Saturation All Schemes
3.77 3.77
3.77
2.77 2.77
1.50
1.25 1.52
1.00
Mobility No Mobility
Figure 15. Summary of MOS Scores
this value is 30Mbps (max bandwidth is RAT 3 with 27Mbps), while for our multi-RAT approach and sce-nario this value is 60Mbps. The load is performed by increasing the video packets in the network. We use this approach to provide fairness for all schemes. If other type of traffic saturates the link, e.g. best-effort, due to the classification and prioritization of packets in our shim layer, the video packets always get priority and no variation occurs in the transmitted packets.
If a ’video optimized’ profile approach is tested in
a mobile environment (Fig. 7) the difference of MOS between a standard MISS and avideo optimized profile
is of 1.28 (1.50 compared to 2.78 respectively) - set 2 in Fig.15. In the aforementioned figure, Set 3 represents a static environment, with only one RAT available. Both evaluated scenarios and all tested schemes perform ideally when no saturation is present in the link. It is to be observed that the MISS algorithm performs similarly in a mobile or a static environment, on the contrary of a classic switched scheme. This is due to the numerous parameters taken into consideration for the decision making. It is also to be noted that all tested schemes reach an ideal score when no saturation is applied to the link - the simulations are performed in an environment with a single user and no interference, and thus the conditions can be considered ideal.
Quality of Experience. Similar to [23], to illustrate how
the difference in performance is perceived by an end user, the corresponding visual outputs of 6 frames are shown in Fig. 16 with the help of YUV Player [24]. Each row represents one approach. The difference in position of the road sign is due to the previous lost packets. In the switched scheme, the road sign does not even appear even though slight shadows are visible if observed closely. In the second row, when the MISS algorithm treats all video packets equally, there is substantial breakup in the image. When the video optimization profile is applied (3rd row), the quality is
close to the ideal video results (4th row). In theMISS
Video optimized case, the images do break up slightly
in between the I Frames but it is not noticeable in a selection of a small number of frames. The reason is the spacing between the I frames along with packet loss of the intermediate B frames which leads to the difference in MOS scores observed in Fig.15.
5. Conclusion
In this paper, we propose a utility-based uplink scheduling algorithm that accommodates different performance metrics and can adapt its decisions based on user-specified profiles. The scheduler operates at an intermediary layer between the MAC and Network layer. The algorithm is tailored for a multi-queue, multi-RAT vehicular environment where the selection of access technology is based on the user perspective at the user end. It also supports multiple transmission schemes with no changes required to the existing wireless standards. The performance of the algorithm has been simulated and the results show that safety critical traffic is prioritized in terms of throughput and delay. Video traffic and quality of experience is also greatly improved with the video optimized profile. Future work will include additional RAT types, such as cellular or Bluetooth, and operation in a multi user environment.
References
[1] Bazzi, A., Masini, B.M. andAndrisano, O. (2011) On
the frequent acquisition of small data through rach in umts for its applications.Vehicular Technology, IEEE Transactions on60(7): 2914–2926.
[2] Bari, F. and Leung, V.C. (2007) Automated network
selection in a heterogeneous wireless network environ-ment.Network, IEEE21(1): 34–40.
[3] Ramaboli, A.L., Falowo, O.E. and Chan, A.H. (2012)
Bandwidth aggregation in heterogeneous wireless net-works: A survey of current approaches and issues. Jour-nal of Network and Computer Applications35(6): 1674– 1690.
[4] Ma, H.,Zhao, D.andYuan, P.(2014) Opportunities in
mobile crowd sensing. Communications Magazine, IEEE 52(8): 29–35.
[5] Kaspar, D., Evensen, K., Engelstad, P., Hansen, A.F.,
Halvorsen, P.andGriwodz, C.(2010) Enhancing
video-on-demand playout over multiple heterogeneous access networks. InConsumer Communications and Networking Conference (CCNC), 2010 7th IEEE(IEEE): 1–5.
[6] Bazzi, A. (2011) On uncoordinated multi user multi
rat combining. InVehicular Technology Conference (VTC Fall), 2011 IEEE(IEEE): 1–6.
[7] Yaver, A. and Koudouridis, G.P. (2009) Performance
(a) (b) (c)Switched Scheme (d) (e)
(f) (g) (h)MISS All Video Tag (i) (j)
(k) (l) (m)MISS Video Optimized (n) (o)
(p) (q) (r)Ideal (s) (t)
Figure 16. Visual Comparison of the reconstructed 1049-1053 frames
[8] Wong, D.T., Kong, P.Y., Liang, Y.C. and Chua, K.C.
(2009)Wireless broadband networks(John Wiley & Sons).
[9] Bychkovsky, V., Hull, B., Miu, A., Balakrishnan,
H. and Madden, S. (2006) A measurement study of
vehicular internet access using in situ wi-fi networks. In Proceedings of the 12th annual international conference on Mobile computing and networking(ACM): 50–61.
[10] Roman, C., Ball, P. and Ou, S. (2015) ’a shim layer
for heterogeneous wireless communications scheduling in intelligent transport systems. InSymposium on Com-puters and Communications(ISCC), 2015 20th Symposium IEEE(IEEE).
[11] Chebrolu, K.andRao, R.R.(2006) Bandwidth
aggrega-tion for real-time applicaaggrega-tions in heterogeneous wireless networks.Mobile Computing, IEEE Transactions on 5(4): 388–403.
[12] Wang, L. and Binet, D. (2009) Madm-based network
selection in heterogeneous wireless networks: A simu-lation study. InWireless Communication, Vehicular Tech-nology, Information Theory and Aerospace & Electronic Systems Technology, 2009. Wireless VITAE 2009. 1st Inter-national Conference on(IEEE): 559–564.
[13] Wang, L.andKuo, G.S.(2013) Mathematical modeling
for network selection in heterogeneous wireless network-sâĂŤa tutorial.Communications Surveys & Tutorials, IEEE 15(1): 271–292.
[14] Roman, C., Ball, P. and Ou, S. (2015) Performance
[15] Bari, F.andLeung, V.C. (2009) Use of non-monotonic
utility in multi-attribute network selection. InWireless Technology(Springer), 21–39.
[16] Bari, F. and Leung, V. (2007) Application of electre
to network selection in a hetereogeneous wireless network environment. InWireless Communications and Networking Conference, 2007. WCNC 2007. IEEE(IEEE): 3810–3815.
[17] Ou, S.,Pan, H.andLi, F.(2012) Heterogeneous wireless
access technology and its impact on forming and maintaining friendship through mobile social networks. International Journal of Communication Systems 25(10): 1300–1312.
[18] Zhang, W.(2004) Handover decision using fuzzy madm
in heterogeneous networks. InWireless Communications and Networking Conference, 2004. WCNC. 2004 IEEE (IEEE), 2: 653–658.
[19] Klaue, J., Rathke, B. and Wolisz, A. (2003) Evalvid–
a framework for video transmission and quality eval-uation. In Computer performance evaluation. Modelling
techniques and tools(Springer), 255–272.
[20] Venkataraman, M., Chatterjee, M. and
Chattopad-hyay, S. (2009) Evaluating quality of experience for
streaming video in real time. InGlobal Telecommunica-tions Conference, 2009. GLOBECOM 2009. IEEE(IEEE): 1–6.
[21] Evalvid - yuv cif reference videos (lossless h.264 encoded, http://www2.tkn.tu-berlin.de/research/ evalvid/cif.html. Accessed: 2016-02-11.
[22] Nichols, K.andJacobson, V.(2012) Controlling queue
delay.Communications of the ACM55(7): 42–50.
[23] Ke, C.H., Shieh, C.K., Hwang, W.S., Ziviani, A. et al.
(2008) An evaluation framework for more realistic simulations of mpeg video transmission.J. Inf. Sci. Eng. 24(2): 425–440.