[Messeder * et al., 4(7): July, 2017]
ISSN: 2349-5197
Impact Factor: 2.715
I
NTERNATIONAL
J
OURNAL OF
R
ESEARCH
S
CIENCE &
M
ANAGEMENT
HEARING LOSS: ATTENDANCE ACROSS MULTICENTRES, WHERE IS IT
HEADING?
Sarah Jane Messeder
*1MBChB, BSc., Timo Stoever
2PhD, MD., Uwe Baumann
3PhD,
Dipl.-Ing., Lisa Caulley
4MD, MPH., Jasenka Broz Frajtag
5, Forbes Lauder
6BSc. & Alison Kennedy
7BSc., Georgios Kontorinis
8FRCS (ORL), MD, MSc.
*1
University of Glasgow Medical School, Glasgow, United Kingdom
2&3
Department of Otolaryngology, Goethe University of Frankfurt, Frankfurt am Main, Germany.
4Department of Otolaryngology, University of Ottawa, Ottawa, Canada
5
Department of Audiology, University of Zagreb, Zagreb, Croatia
1,6,7&8
Department of Otolaryngology, Queen Elizabeth University Hospital, Glasgow, United Kingdom
DOI: 10.5281/zenodo.824927
Keywords
:
hearing aids; aging; demographics/epidemiology; noise; medical audiology.Abstract
Objective
To determine the trends of hearing loss by using data from different tertiary centres across Europe and Canada.
Methods
The number of attendances from April 2012 until April 2015 to the Departments of Audiology in four different tertiary centres located in Canada, Croatia, Germany and the UK were collected retrospectively. Additionally, where available, similar data from 10 years ago were collected.
Results
A significant upward trend in attendances was seen in the German and Croatian centres over the last decade whilst the Canadian centre demonstrated a decline. In all countries, the number of attendances have plateaued. Within the UK centre, the annual cost of hearing aids exceeds £1.5 million for a catchment area of 1.16 million people.
Conclusions
These trends may represent the earlier detection of hearing loss, increased societal awareness and improvements in safety to reduce work-induced noise pollution..
Abbreviations: NHS (National Health Service), UK (United Kingdom)
Introduction
Thought to affect 16% of the population in Europe, hearing impairment is a big issue throughout the Western World. The World Health Organisation defines hearing impairment as hearing loss greater than 25 dB. Despite this, many Countries choose to adopt their own criteria. Within the United Kingdom (UK), the British Society of Audiology defines hearing impairment as hearing loss greater than 20 dB. Thus,varying standards exist to diagnose hearing impairment.
[Messeder * et al., 4(7): July, 2017]
ISSN: 2349-5197
Impact Factor: 2.715
I
NTERNATIONAL
J
OURNAL OF
R
ESEARCH
S
CIENCE &
M
ANAGEMENT
Hearing aids are the mainstay of management and treatment of hearing impairment due to presbycusis. Within Europe, public funding through government and social security funds makes up the majority of healthcare expenditure. Despite this, most European Countries do not offer hearing aids on the public sector. The cost of a hearing aid can be subsidised if the individual meets specific criteria however this remains Country specific. Within Finland, Italy, Ireland and the UK, hearing aids are covered by the public sector and so remain free of charge.
We aimed to discover the trends and estimated cost of hearing impairment over the last few years across four different tertiary centres of Otolaryngology/Audiology within Europe and Canada and to also compare this trend with previous years, wherever available.
MATERIALS AND METHODS
A multicentre retrospective study design was used. Ethical approval was not required for this study as information was collected for audit purposes.
Data Collection and Analysis
Data were collected retrospectively from databases within four tertiary Otolaryngology/Audiology centres between the period April 2012 and April 2015. The centres were located in Ottawa-Canada, Zagreb-Croatia, Frankfurt-Germany and Glasgow-UK. Due to the diversities between these centres, the data provided depended on the access to the local databases and the period covered.
Specifically; the Canadian centre covered two hospitals with a total population of 883, 391.8The data collected included the number of attendances to Audiology from 2012-2014 as well as in 1999 and 2001 in order to compare trends.
The Croatian centre covered the University hospital population and the city population of 790,017.8 This centre also accepted referrals out with the city population and thus catchment area. The number of attendances to Audiology from 2012-2014 was also collected alongside data from 2005.
The German centre covered the University hospital population and a population of 732,688.8 However, this population is also covered by another centre that was not involved in our study. The University department also accepts referrals from a wide geographical catchment area. Data collected from the German centre also included from 2012-2014 as well as data from 1997 until 2011 (18-year period).
The UK tertiary centre (the co-ordinating centre) covers a total of eight hospitals with a catchment population of 1.16 million people.8 Data available included from 2012-2014 as well as for 2015. Detailed data from the past decade was not available but a gross estimation of the workload within Audiology over this time was provided. Finally, data related to the number of hearing aids, the costs and the access to hearing aids through the public sector were also collected.
Analysis
The data were then recorded into a spreadsheet using Microsoft Excel 2015 v15.13.1 by a research lead from each individual hospital. The data from each centre were then collected and sent to a research lead within the UK. It was organised into line graphs to determine the trends occurring over time and further analysed. Student T-test was used to compare the numbers over the years; p<0.05 was considered significant.
RESULTS
Canada
[Messeder * et al., 4(7): July, 2017]
ISSN: 2349-5197
Impact Factor: 2.715
I
NTERNATIONAL
J
OURNAL OF
R
ESEARCH
S
CIENCE &
M
ANAGEMENT
has also decreased over the years from 1,022 in 2001 to 599 in 2012 (p<0.001). The overall number of individuals attending for hearing aid evaluation has decreased over the years from originally 1,003 in 1999 to 204 in 2014 (p<0.001). Likewise, this has represented a decrease in individuals requiring a follow-up hearing aid appointment. Figure 1 demonstrates these data.
Croatia
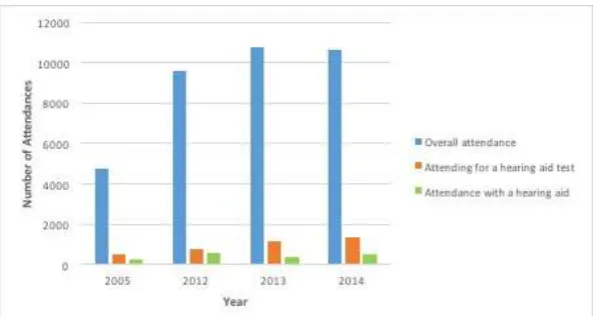
During the three-year period, there were a total of 27,710 attendances to Audiology within the Croatian centre. The numbers have increased dramatically since 2005 where only 4,732 individuals attended. In 2012, there were 9,590 attendances to Audiology (p<0.001 compared to 2005), 2013 received 10,740 and 2014 received 10,630. Within Croatia, the cost of hearing aids is between €265 – 2389 with the insurance companies subsidising €398 (personal communication). The number of individuals attending Audiology with a hearing aid has remained similar over the years from 553 in 2012 to 528 in 2015. This, however, has almost doubled since 2005 were only 278 individuals presented for a hearing aid (p<0.001) (Fig. 2).
Germany
A total number of 23,740 attended Audiology within the German tertiary centre throughout this three-year period. In 2012 there were 7,832 attendances, in 2013 there were 7,768 and 8,140 in 2014. These numbers have increased significantly since 1997 when the number of referrals was just higher than 2000 (p<0.001) (Fig. 3). Figure 3 also demonstrates the upward trend in the number of individuals attending speech audio over the last 18 years.
United Kingdom
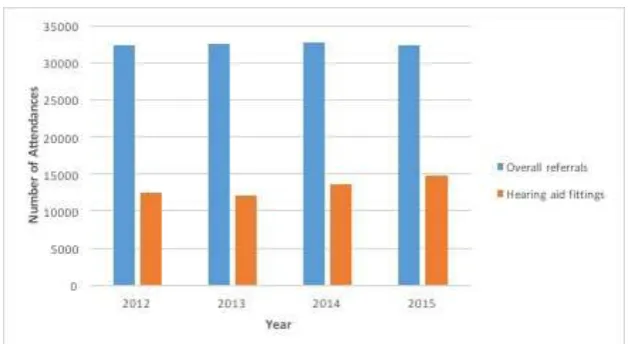
From January 2012 until December 2015 there were 129,857 referrals made to the Department of Audiology within the UK centre. This figure has increased marginally over time from 32,299 in 2012 to 32,446 in 2013 and finally 32,690 in 2014. In 2012, there were 12,400 individuals referred for a hearing aid fitting with this number increasing to 14,708 in 2014. Figure 4 demonstrates this change. In fact, in 2012, 23,066 hearing aids were prescribed to individuals costing a total of £1,427,316. This has increased to a total of 29,884 hearing aids (p=0.008) prescribed in 2014 costing £1,481,439 (better negotiated price).
DISCUSSION
Hearing loss affects a significant number of the population in developed countries with its incidence dramatically increasing with age (Eurostat Statistics Explained, 2015a). We collected and analysed data from tertiary referral centres across four different countries; three in Europe and one centre in Canada. We demonstrated the increasing trends in referrals and attendances for hearing assessment within Europe over the last decade, whilst recent years show that these numbers are beginning to level off. Interestingly data from Ottawa over the last ten years have shown a decrease in these numbers. The associated costs are thus dramatic, especially considering that these only represent part of the problem and do not cover the cost of assessment and treatment.
Trends, Workload and Cost
The comparison of data from European centres over previous years, shows a significant increase in the workload within the Departments of Audiology. This is more clearly seen in Frankfurt and Zagreb, where data gathered includes that of 10 years ago. This stepwise increase has gradually reached a plateau. The data from Glasgow demonstrates a marginal increase in numbers with the number of individuals being referred to Audiology starting to level off. Conversely in Ottawa, a drop in attendances has occurred since 1999. Despite this, data from the last 3 years also demonstrates a plateau, as seen in the European centres. Therefore, despite the initial differences seen over a decade ago, all centres have reached a plateau in overall numbers.
[Messeder * et al., 4(7): July, 2017]
ISSN: 2349-5197
Impact Factor: 2.715
I
NTERNATIONAL
J
OURNAL OF
R
ESEARCH
S
CIENCE &
M
ANAGEMENT
further increased societal awareness of the consequences of work-related noise pollution. This indicates the necessity for the public health sector to deal with the increased demand for assessment and management. With regards to the importance of the measures targeting work-induced hearing loss, implemented in Europe around 2003, it is possible that we are gradually seeing the first results.13
A review by Pawlaczyk-Luszczynska et al. on noise-induced hearing loss from 1970 to 2012 in Central and Eastern Europe, South-East Europe and former Soviet Union countries or Newly Independent States, showed that despite extensive literature, noise-induced hearing loss is a complex issue that is difficult to estimate. Nowadays, new determined parameters exist to ascertain employers monitor and reduce noise exposure, provide personal protection for employees and ensure a weekly noise exposure level limit of 87 dB.10 Consequently, the incidence of hearing impairment due to work-related noise pollution should be on the decrease resulting in an overall reduction in the incidence of hearing impairment. With effective hearing impairment prevention as well as early detection, referral and management, the overall incidence of hearing impairment should level off. What we see in our results might well reflect the outcome of the work-induced deafness preventing measures. The implemented measures can well explain, along with the increased public awareness and the significance of the effect on individual quality of life, the observed plateau in our figures.
Associated costs
Hearing aids have greatly improved over the years with better outcomes and aesthetics.1Additionally, the evolution of cochlear implants and implantable hearing devices have radically changed the way we approach and manage deafness. All of this has come with certain costs. In our study, we did not consider auditory implants; we focused on hearing aids. Therefore, we have indicative figures on the cost of dealing with hearing loss.
The data presented from the UK tertiary centre demonstrated that the cost attributable to hearing aids is increasing and currently stands at nearly £1.5 million per year for a catchment area of 1.16 million people. This figure only includes the cost associated with the hearing device and not that of assessment, fitting, accessories or repairs. Thus, the cost attributable to hearing aids represents only one aspect of hearing impairment making the overall cost within the Glasgow tertiary centre, far greater. The review work by Shield in 2006 showed that the socioeconomic cost of hearing loss within Europe remains unknown and thus no estimation can be made into the cost of hearing impairment in Europe.1It is worth mentioning that expenses for hearing aids in the UK are covered by the public sector, at least for the majority of hearing aids. This is not the case for the other centres in Croatia, Germany and Canada, where only part of the cost is covered by the public sector.9 This, therefore, seems to affect the access of patients to hearing aids and consequently their numbers.
Strengths and Weaknesses
We collected and analysed data from tertiary centres from Europe and Canada; the multicentre design is the main strength of our study. The long time period, particularly from certain centres, adds value to the present work and gives a better overview of the trend and workload over the last few years.
On the other hand, the retrospective design as well as extending the multicentre character, is the main limitation of this study, mainly because data had to be collected in different centres using different databases. Additionally, this study focuses solely on the numbers available in the public sector. Attendances to Audiology within the private sector could not be estimated. In more private-orientated health systems, missing data might have affected the presented numbers. However, the public sector is still the leading health provider in all participating countries and the numbers presented should reflect the real trends. The meticulous collection of specific data, considering simple questions and their cautious analysis were utilised in order to overcome such weaknesses.
CONCLUSION
[Messeder * et al., 4(7): July, 2017]
ISSN: 2349-5197
Impact Factor: 2.715
I
NTERNATIONAL
J
OURNAL OF
R
ESEARCH
S
CIENCE &
M
ANAGEMENT
or not. These results combined with the presented associated costs should be considered when designing health policies.
Declaration of interest:The authors have no funding, financial relationships, or conflicts of interest to declare.
Geolocation information
Ottawa-Canada, Zagreb-Croatia, Frankfurt-Germany and Glasgow-UK.
References
[1] Shield B. Evaluation of the Social and Economic Costs of Hearing Impairment: A Report for Hear-it.
London: London South Bank University; 2006. Available from:
http://www.hear-it.org/sites/default/files/multimedia/documents/Hear_It_Report_October_2006.pdf[Accessed 18
February 2017].
[2] World Health Organization. Media centre: Fact Sheets - Deafness and hearing loss. Available from:
http://www.who.int/mediacentre/factsheets/fs300/en/ [Accessed 18 January 2017].
[3] British Society of Audiology recommendation. Descriptors for pure tone audiograms. BrJAudiol.
1988; 22:12.3.
[4] Eurostat Statistics Explained. Healthcare statistics.Available from:
http://ec.europa.eu/eurostat/statistics-explained/index.php/Healthcare_statistics [Accessed 12 February 2017].
[5] Dawes P, Cruickshanks KJ, Fischer ME, Klein BE, Klein R, Nondahl DM. Hearing-aid use and
long-term health outcomes: Hearing handicap, mental health, social engagement, cognitive function, physical health, and mortality. IntJAudiol.2015; 54(11), pp. 838-44.
[6] Chen DS, Betz J, Yaffe K, Ayonayon HN, Kritchevsky S, Martin KR, et al.; Health ABC study.
Association of Hearing Impairment with Declines in Physical Functioning and the Risk of Disability in Older Adults. The J GerontolABiolSciMed Sci.2015; 70(5), pp. 654-61.
[7] Dawes P, Emsley R, Cruickshanks KJ, Moore DR, Fortnum H, Edmondson-Jones M, et al.Hearing
Loss and Cognition: The Role of Hearing Aids, Social Isolation and Depression. PLoS One.2015; 11;10(3)e0119616.
[8] Eurostat Statistics Explained. Health life years and life expectancy at birth, by sex. Available from:
http://ec.europa.eu/eurostat/tgm/table.do?tab=table&init=1&language=en&pcode=tsdph100&plugin=1 [Accessed 12 January 2017].
[9] Hear-it.Hearing Loss: Numbers and countries. Available from:
http://www.hear-it.org/Hearing-loss-in-different-countries [Accessed 16 January 2017].
[10] European Union Parliament. On the minimum health and safety requirements regarding the exposure
of workers to the risks arising from physical agents (noise). Directive 2003/10/EC. Brussels: Official Journal of the European Union; 2003
[11] Pawlaczyk-Luszczynska M, Dudarewicz A, Zaborowski K, Zamojska M, Sliwinska-Kowalska M.
Noise induced hearing loss: research in Central, Eastern and South-Eastern Europe and Newly Independent States. NoiseHealth.2013; 15(62), pp. 55-66.
[12] The European Commission: Eurostat. European Statistical System: 2011 Census Hub.Available from:
[Messeder * et al., 4(7): July, 2017]
ISSN: 2349-5197
Impact Factor: 2.715
I
NTERNATIONAL
J
OURNAL OF
R
ESEARCH
S
CIENCE &
M
ANAGEMENT
Figures
Figure 1: Total Number of Attendances to Audiology per year in the Canadian Centre; a decrease in numbers is followed by a plateau over the last three years
[Messeder * et al., 4(7): July, 2017]
ISSN: 2349-5197
Impact Factor: 2.715
I
NTERNATIONAL
J
OURNAL OF
R
ESEARCH
S
CIENCE &
M
ANAGEMENT
Figure 3: Total Number of Referrals to Audiology and Attendances for Speech Audio per year in the German Centre over the last 14 years; numbers are gradually levelling off