Analysis and Estimation of Crop Yield Using DBSCAN
Algorithm
Latha G1, Anusha S1, Vikas B O2
1B.E Students, Department of ISE, New Horizon College of Engineering, Bangalore, Karnataka, India
2Assistant Professor, Department of ISE, New Horizon College of Engineering, Bangalore, Karnataka, India
ABSTRACT
Agriculture field requires farmers and agriculture businesses to take critical decisions every day and also overcome the complexity and factors that they influence. Approach for accomplishing practical and effective solutions for this problem. Agriculture has been an significant target for big data. The various factors such as production, rainfall, temperature, soil type, fertilizer used, influence the farmer to access information and to make critical farming decision. This paper focuses on the analysis of the agriculture data and finding optimal parameters to maximize the crop production using data mining techniques like DBSCAN and Multiple Linear Regression. The result is the yield estimation and this helps agribusinesses to make future business decisions. Keywords: Clustering, DBSCAN, Linear Regression, Agricultural data
I.
INTRODUCTIONToday, India holds second position in agriculture. Agriculture plays a very country. There are many factors that influence agriculture some of them are soil, important role and is a backbone of our cultivation,irrigation,fertilizers, temperature, rainfall,harvesting, pesticides also important for farmers and companies engaged in industries[5]. Industries that are weeds, production and other factors. Historical data of crop yield information is based on food, paper, and organic products depend on agriculture for crops. An accurate and optimal estimation of crop production, risk these companies in planning supply chain decision like production scheduling.
Data mining plays a vital role in data analysis and is one of the growing field. Data mining is a process of analysing large amount of data and finding pattern and predicting the future outcome which is required.
Data mining contains many different methods for mining the data. One such technique is clustering. Clustering is the process of grouping common data into clusters or data that belong to same class based on the constraint. Clustering has various methods like
K-means
Hierarchical
Density based clustering
K-mediod
Cluster analysis divides data into well-formed groups. Well-formed clusters should capture the “natural” structure of the data. The proposed method focuses on DBSCAN clustering methods.
II.
PROPOSALA.
Problem Formationthat the clusters formed are only in spherical shape[4]. The number of clusters to be formed on agricultural data must be passed initially in the code. It is very difficult to predict the K value. The cluster formed contains noise and is not accurate.
B.
Problem SolutionThe project mainly focuses on estimating the crop yield which is more accurate and optimal ,noise free that helps farmers and agricultural business to make critical decisions .The overall system design of the project is shown below.
Figure 1. shows system design
The data set used in our project contain the attributes like fertilizer, area available for cultivation, temperature, cereals production, oilseeds production,, pulses production, pulses yield, oilseeds yield, cereals yield.
C.
Data PreprocessingThe agricultural data contains missing values and noise points, to remove this we need to pre-process the data .Pre-process is also a process to obtaining the required data for further use[3], the result of pre-process is shown below.
Figure 1.2. is preprocessed data
D.
DBSCAN AlgorithmThe result of pre-processing in given as input to DBSCAN algorithm.Density-based spatial clustering of applications with noise (DBSCAN) is a data
clustering algorithm .DBSCAN requires two
parameters: ε (eps) that is radius and the minimum
number of points required to form a dense region (minPts) within which the cluster will be accepted. It starts with an arbitrary starting point that has not been visited. This point's ε-neighbourhood is retrieved, and if it contains sufficiently many points, a cluster is started. Otherwise, the point is labelled as noise. Note that this point might later be found in a sufficiently sized ε-environment of a different point and hence be made part of a cluster[7].
If a point is found to be a dense part of a cluster, its ε-neighborhood is also part of that cluster[6]. Hence, all points that are found within the ε-neighborhood are added, as is their own ε-neighborhood when they are also dense. This process continues until the density-connected cluster is completely found.
The algorithm can be expressed in pseudo code as follows:
AdvancedDBSCAN(DB, eps, minPts) {
C = 0 /* Cluster counter */ for each point P in database DB {
if label(P) ≠ undefined thencontinue/* Previously processed in inner loop */
Neighbors N = RangeQuery(DB, P, eps) /* Find neighbors */
if |N| <minPtsthen { /* Density check */ label(P) = Noise /* Label as Noise */ continue
}
C = C + 1 /* next cluster label */
label(P) = C /* Label initial point */
Seed set S = N \ {P} /* Neighbors to expand */
for each point Q in S { /* Process every seed point */
if label(Q) = Noise then label(Q) = C /* Change Noise to border point */
if label(Q) ≠ undefined thencontinue/* Previously processed */
Neighbors N = RangeQuery(DB Q, eps) /* Find neighbors */
if |N| ≥ minPtsthen { /* Density check */ S = S ∪ N /* Add new neighbors to seed set */
} } }
}
Where RangeQuery can be implemented using a database index for better performance, or using a slow linear scan:
RangeQuery(DB, Q, eps) { Neighbors = empty list
for each point P in database DB { /* Scan all points in the database */
ifdist(Q, P) ≤ eps then { /* Compute distance and check epsilon */
Neighbors = Neighbors ∪ {P} /* Add to result */
} }
return Neighbors }
The epsilon value in our project given is 5 and minimum number of points is 4.we can change the value of epsilon and minpts the result will be seen in cluster formation.
III. IMPLEMENTATION AND RESULT
AdvancedDBSCAN(dbscan, 5, 4) {
Cluster=0
Foe each point 97.01 in dbscan{ If 97.01 is not visited continue{
Neighbour N=RangeQuery(dbscan,97.01,5)
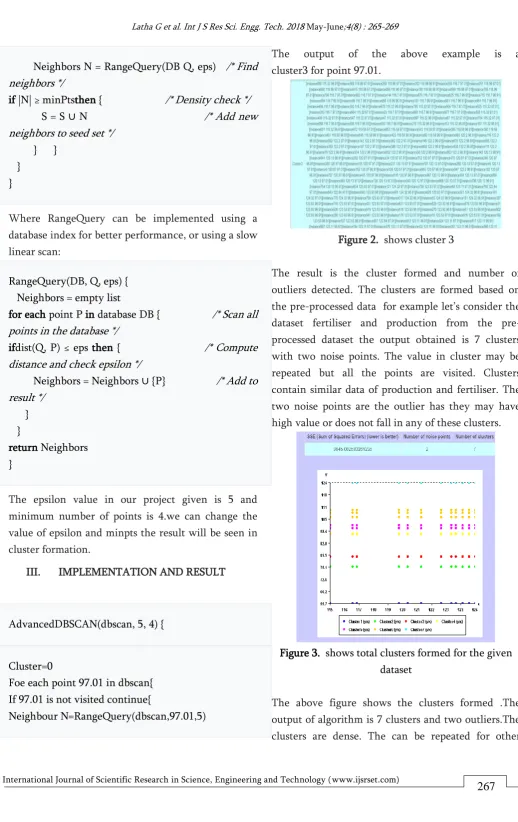
The output of the above example is a cluster3 for point 97.01.
Figure 2. shows cluster 3
The result is the cluster formed and number of outliers detected. The clusters are formed based on the pre-processed data for example let’s consider the dataset fertiliser and production from the pre-processed dataset the output obtained is 7 clusters with two noise points. The value in cluster may be repeated but all the points are visited. Clusters contain similar data of production and fertiliser. The two noise points are the outlier has they may have high value or does not fall in any of these clusters.
Figure 3. shows total clusters formed for the given dataset
attributes such as cereal production, fertilizer, yield etc.
Multilple Linear Regression
These cluster are the input to multiple linear regression. Multiple linear regression contains many independent variables and one dependent variable. Every value of the independent variable x is associated with a value of the dependent variable y. The linear equation in multiple linear regression shows how dependant values influence the output[8]. Y=beta0+beta1X1+beta2X2+beta3X3+R2X4+E
Beta0 is the y intercept, beta1 means single unit change in X1 then Y changes beta1 times, beta2, beta3 and R2 are other independent values for area, temperature and production. The E is the error rate as there contains a little noise i.e. no data is perfect. The E value used it -1 in our project.
Beta values are the mean of the attribute of the particular attribute. It is very helpful because when data is more we can estimate our output using this mean values.
Figure 4. shows the beta values
Based upon the independent and the depended values we will be calculating the beta values. Depending upon the beta values, we will be estimating the crop yield. We will giving the current values for the fertilizer used, area, temperature, production and based upon the calculated beta values we will be estimating the yield.
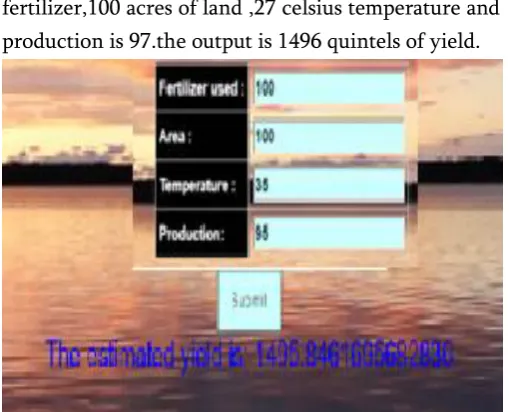
The below figure shows the final yield estimated for the given values of fertilizer ,area, temperature and productction.The input values given are 100kg of
fertilizer,100 acres of land ,27 celsius temperature and production is 97.the output is 1496 quintels of yield.
Figure 5. shows the estimated yield for the given input
III.
CONCLUSIONThe DBSCAN algorithm forms clusters that are denser and noise free, the clusters can be of any shape. Through Linear regression we can get a yield that is more optimal and accurate. This helps the farmers and agribusiness to make future decisions.
As the future work we intend to expand of our dataset that contains more attributes like soil and other information of agriculture.
IV.
REFERENCES[1]."A survey on pre-processing and post processing techniques in data mining." Tomar, Divya, and Sonali Al1;arwal International Journal of Database Theory & Application 7.4 (2014).
[2]."Enhancing data analysis with noise removal." Xiong, Hui, et al, IEEE Transactions on Knowledge and Data Engineering 18.3 (2006): 304- 319.
[3]."Survey of Pre-processing Techniques for Mining
Big Data" JayaramHariharakrishnan*,
College of Engineering Kalavakkam, Tamil Nadu, India.IEEE[2017].
[4]."Analysis of agriculture data using data mining techniques: application of big data" Jharna Majumdar* , Sneha Naraseeyappa and Shilpa Ankalaki [2017]
[5]."Demand Based Crop Recommender system for Farmers" S.Kanaga Suba Raja, Rishi .R, Sundarsan.E,Srijit .V Department of Information Technology , Easwari Engineering College, Chennai, India.[2017]
[6]."Convex-Hull & DBSCAN Clustering to Predict Future Weather" Ratul Dey , Sanjay Chakraborty Computer Science & Engineering ,Institute of Engineering & Management[2015]
[7].https://sites.google.com/site/dataclusteringalgorith ms/density-based-clustering-algorithm