Classification of Artefacts in EEG Signal Recordings and
EOG Artefact Removal using EOG Subtraction
Avinash Tandle
Assistant Professor Electronics
and Telecommunication
Department
MPSTME NMIMS University
Swami Bhakti Vedanta Marg
Vile Parle (W), Mumbai -56
Nandini Jog
Professor Electronics and
Telecommunication
Department
MPSTME NMIMS University
Swami Bhakti Vedanta Marg
Vile Parle (W), Mumbai-56
Pancham D’cunha
Student Electronics and
Telecommunication
MPSTME NMIMS University
Swami Bhakti Vedanta Marg
Vile Parle (W), Mumbai-56
Monil Chheta
Student Electronics and Telecommunication
MPSTME NMIMS University
Swami Bhakti Vedanta Marg
Vile Parle (W), Mumbai-56
ABSTRACT
EEG is a record of brain activity from various sites of the brain and artefacts are unwanted noise signals in an EEG record. Classification of artefacts is based on the source of generation like physiological artefacts and external artefacts. The body of the subjects is the main source of Physiological artefacts, while external artefacts are from outside the body due to the environment and measurement device. Recognition, identification and elimination of artefacts is an important process to minimize the chance of misinterpretation of EEG. Clinical and non-clinical fields such as brain computer interface, intelligent control system robotics etc.all require removal of artefacts. Artefacts can be removed very easily using manual and filtering methods because of their morphology and electrical characteristic. Electro Oculogram (EOG) artefact using manual and filter method is very difficult to remove. Artefact removing algorithms are the most suited techniques for EOG artefact removal. This paper classifies the artefacts from the database collected at Dr. R. N. Cooper Municipal General Hospital, Mumbai India. The paper deals with the EOG artefact removal using the EOG subtraction algorithm.
General Terms
EEG artefact classification, EEG montages EOG subtraction Algorithms
Keywords
EEG, Artefact, EOG, EMG.
1.
INTRODUCTION
In 1929, the German psychiatrist, Hans Berger Recorded brain signals of humans. He used the term electroencephalogram for brain signals.
EEG imaging technique is simple and economical [1] and has numerous clinical as well as non-clinical applications. In 1958, International Federation in Electroencephalography and Clinical Neurophysiology adopted calibration for electrode location called 10-20 electrode placement system [5] [14]. This system standardized the physical placement of electrodes
and the labels of electrodes on the scalp. The human head is divided into different lobes central, temporal, posterior and occipital lobes. The electrodes placed on the left side of the head are given odd numbers and those on the right side are given even numbers (Figure 1).
The distances between nasion and anion is measured and the distance between the two ears is measured, and electrodes are placed at 10% and 20% distance as shown in fig.1, hence the name 10-20system [5].Electrode placements are labelled according to brain areas: F -frontal, C –central, T -temporal, P -posterior, and O –occipital. The electrical characteristic of EEG is its amplitude range in µV and frequency band in 0.5Hz to 60Hz [1][2][4][5] Electrical properties of EEG signal are vulnerable to external unwanted signals called artefacts. Artefacts can imitate nearly all types of EEG patterns and as such, artefacts included in automatic analysis can seriously affect the results, eventually leading to mistaken interpretations. Substantial amount of artefacts render the analysis of EEG unacceptable. Several times artefacts themselves may contain valuable information as in sleep study where eye movement and muscle artefacts in the EEG recordings might expedite sorting of sleep stages.
Fig1: 10-20 system of Electrode Placement
noise generated from the recording system can significantly be reduced by a careful design of the system and by following appropriate signal recording procedures. EEG contaminated by a number of electrophysiological signals generated from various parts of the human body can give rise to incorrect analysis for example, Electro-Oculogram signal artefact caused by eye blink and cornea movement, Electromyogram (EMG) artefacts caused of muscle activity of various body parts of the subjects.
2.
MONTAGES
Study of EEG signals from specific electrodes is referred to as montages. Selection of montages plays an important role in minimizing and detecting artefact like EOG artefacts. At electrode Fp1-A1, Fp2-A2, (Referential montage) appearance of EOG artefact is prominent. Montages are classified as
2.1
Bipolar montage
In a bipolar montage, each waveform signifies the difference between two adjacent electrodes. For example, the channel Fp2–F8 signifies the difference in voltage between the Fp2 and the F8 electrode as shown in Fig 2. Similarly, F8–T4 represents the difference in voltage between the F8 and T4 electrodes.
Fig2: - Bipolar montage of adjacent electrode FP2-F8.
2.2
Referential Montage
In this montage, the difference between signal from a certain electrode and that of a designated reference electrode is measured. The reference electrode has no typical position. However, the position of the reference electrode is different from the recording electrodes. Midline positions are often used to avoid amplification of signals in one hemisphere relative to the other. Another popular reference that is used considerably is the ear (left ear for left hemisphere and right ear for right hemisphere) shown in fig3.
Fig3: - Referential montage of adjacent electrode FP2-A2.
2.3
Average Reference Montage
In this montage, an average signal is obtained by summing and averaging the outputs of all the amplifiers, which is then used as the common reference for each channel.
2.4
Laplacian Montage
In this montage, the difference between an electrode and a weighted average of the surrounding electrodes is used to
represent a channel. When digital EEG is used, all signals are typically digitized and stored in a particular (usually referential) montage. Because the stored information is digital, it is possible to mathematically construct any montage from any other montage. However, for the case of analog EEG, which is stored on paper, the person in charge has to switch between the montages during the recording to focus or highlight special features of the EEG.
3.
CLASSIFICATION OF ARTEFACT
Classification of artefact depending upon their source of generation. If the source is the subject’s body, that artefact is called physiological artefact. If the source is external it is called external artefact.
3.1
Physiological Artefacts
Physiological artefacts are the artefact originated because of electrical activity of other body parts of the subject and obscure the EEG signals.
3.1.1 Artefacts from the eyes and eyelids.
A movement of the eyes and eyeballs causes a change of potential in the electrodes near the eyes at Fp1-Fp2 (Fronto Parietal). Fluttering of the eyelids appears as a 3Hz –10Hz signal.
3.1.2. Eye movement artefacts.
ERG or Elertroretinogram is a potential difference between retina and cornea of the eye and with incident light; it changes, causing artefacts in EEG signals. Voltage amplitude is proportional to the angle of gaze. This artefact mixed with slow EEG is prominent in REM sleep [4][12] shown in fig5.
3.1.3Eye blink.
Eye blinks produce high amplitude signals that can be many times greater than the amplitude of EEG signals of interest. Repetitive blinks produce slow wave, which appear like delta waves shown in fig6.electrical character shown in table 1.
3.2 Muscle Artifacts
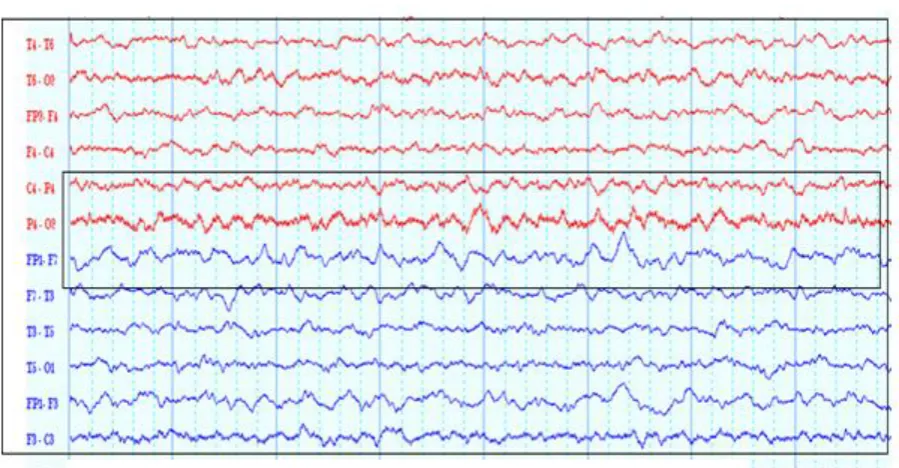
Muscle artefact are classified into glossokenetic (chew/swallow tongue movement; swallowing, grimacing, chewing), observed in surface electrode in EEG. Shape depends on the degree of muscle contraction: weak contraction give a low-amplitude spike train. Occur less in sleep and overlap with beta band (15-30Hz) [7][2].Most commonly appear in the frontal and temporal electrode as shown in fig7.and table 1.
3.3
Cardiac Artefact
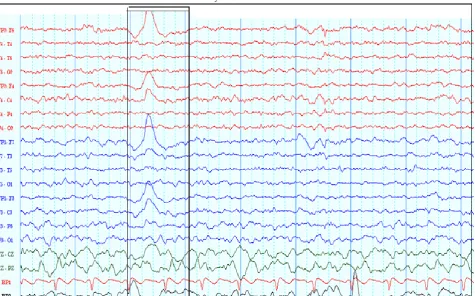
The heart produces two types of artefacts; mechanical electrical artefacts which appear as ECG signal near temporal left region and are most commonly seen in short neck subjects. This electrical artefact appears as ECG waveform recorded from scalp and forms the QRS complex. Most of the cardiac artefact frequencies are near 1Hz and amplitude is in several millivolts. As shown in fig8.and table 1.
3.4
External Artefacts
The sources of these artefacts are electronic gadgets, transmission lines etc.
3.3.1 Transmission- line Artefact
affects all channels or channels with poor impedance matching. This artefact can easily remove by using a notch filter of frequency range 50 Hz or 60 Hz. Electrical characteristic shown in table.
3.4.2 Phone
Artefact
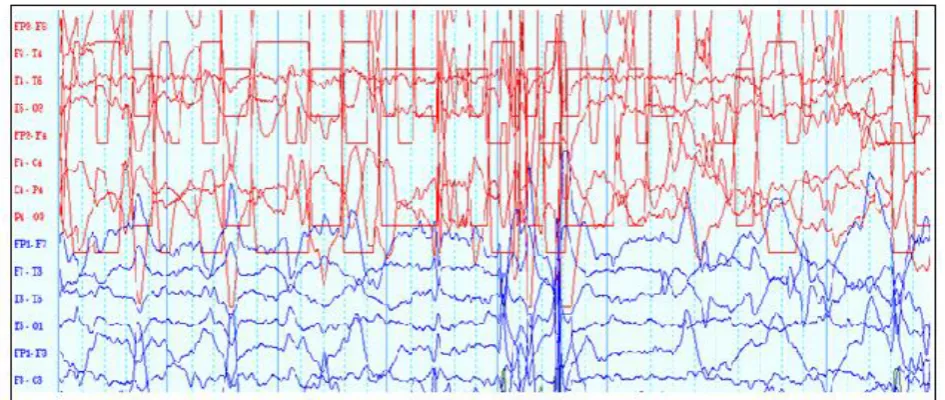
This artefact is because of mobile phone signal. A high frequency signal appears as a spurious signal on the EEG signals. Remedy for this artefact is not to carry a mobile phone while recording this artefact shown in fig10.electrical characteristic shown in table 1.
3.4.3 Electrode Artefact
Poor electrode contact gives rise to low frequency artifacts, they are brief transients that are limited to one-electrode and synchronize with respiration due to the motion of the electrode.
3.4.3.1 Electrode
pop Artefact
Appear as sharply contoured transients that interrupt the background activity and may be misinterpreted as tumor. Shown in fig11.electrical characteristic shown in table 1
3.4.3.2 Lead Movement Artefact
Lead movement has a more disorganized morphology that does not look like factual EEG activity in any form and often includes double phase reversal, that is, phase reversals without the evenness in polarity that indicates a cerebrally generated electrical field Shown in fig12.electrical character shown in table 1
3.4.4 Perspiration Artefact
Perspiration artefact exhibited as low amplitude, swelling waves that typically have durations greater than 2 sec; thus, they are beyond the frequency range of cerebrally generated EEG.
3.4.5 Physical movement Artefact
This artefact appears because of lose contact of electrode due to abrupt physical movement of subjects. Its morphology different from actual EEG. Shown in fig 13.electrical characteristic shown in table 1
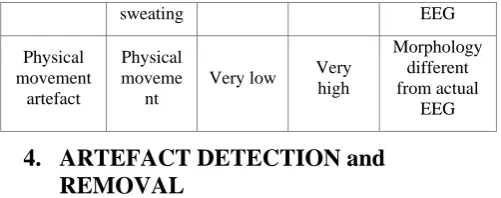
Table 1. Electrical characteristics of artefacts and Morphology with actual EEG
Artefact Source/
Cause Frequen cy range Amplitu de Morphology
cardiac Heart >1Hz 1-10mv Epilepsy
Transmissi on line
noise
Transmis
sion line 50-60Hz low
Beta or gamma wave
Muscle Artefact
Body
Muscle <=35Hz low
Beta frequency
EOG Eye 0.5-3 Hz 100mV Tumor ,
delta wave Phone Artefacts Mobile and landline phone
high high
Morphology different from actual
EEG
Electrode
artefact Electrode and
Very
low High
Morphology different from actual
sweating EEG
Physical movement artefact Physical moveme nt
Very low Very high
Morphology different from actual
EEG
4.
ARTEFACT DETECTION and
REMOVAL
Most of the artefacts can be prevented while recording by making a good recording protocol, which includes giving instructions to the subject about eye movement, physical movement and not allowing mobile phone in recording room. Experienced technologist recognizes artefact by the process of visual analysis, remontaging, and digital filtering [4] [2].
5.
METHOD of REMOVAL
There are different methods of artefact removal, which include manual and automated method. Automated removal methods use mathematical algorithms and are used in digital EEG record; this is an on line method, whereas the manual method is offline method.
4.1. Filter method
Using a band pass filter with a frequency band of artefact, particular artefact can be removed. This method is not a very useful method for analysis of the entire bandwidth of EEG, as artifacts can occur at any frequency. A 50 Hz notch filter can used for removal of transmission line frequency. Low pass filter can used for Oculogram artefact removal.
4.2. Manual Method
Manual method also called offline method this is most reliable method of artefact removal. After recording, technologist visually inspects the record and removes the artefact-affected slots or does not consider this slot for further analysis.
4.3 Algorithm based rejection of Artefact
Automatic artefact removal method uses mathematical algorithms like EOG subtraction, Independent component analysis, principle component analysis, Joint approximate diagonalisation of Eigen matrices (JADE)[3][7][8][9][10].
4.3.1 EOG Subtraction
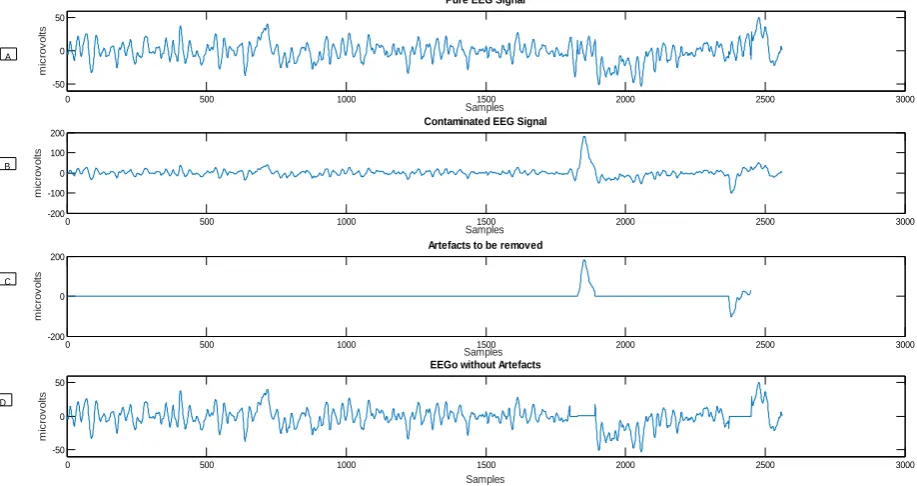
Electrical character of the EOG artefact and its morphology with EEG signal shown in table 1 reveals that EEG and EOG signals occupy a similar frequency band. This frequency band ranges from 0.5 to about 60Hz and hence analog and digital the algorithm for EOG Subtraction method involves the removal of Ocular Artefacts from an impaired EEG waveform consisting of N data points. This contaminated EEG waveform EEGc can be expressed as a sum of the original pure EEG waveform EEGo and EOG Spikes. Implementation of the algorithm is experimented in MATLAB environment. 𝐸𝐸𝐺𝑐(𝑘) = 𝐸𝐸𝐺𝑜(𝑘) + 𝐸𝑂𝐺(𝑘) k=1, 2, 3…..N (1)
𝐸𝐸𝐺𝑜 𝑘 = 𝐸𝐸𝐺𝑐(𝑘) − 𝐸𝑂𝐺(𝑘) k= 1, 2, 3 …N (2)
Fig4:- A) EEG signal without EOG artefact B) EEG signal with EOG artefact C) EOG signal to be remove D) Recovered signal
Fig 5: Eye movement artefact shown in window
B
C A
D
0 500 1000 1500 2000 2500 3000
-50 0 50
Samples
m
ic
ro
v
o
lt
s
Pure EEG Signal
0 500 1000 1500 2000 2500 3000
-200 -100 0 100 200
Samples
m
ic
ro
v
o
lt
s
Contaminated EEG Signal
0 500 1000 1500 2000 2500 3000
-200 0 200
Samples
m
ic
ro
v
o
lt
s
Artefacts to be removed
0 500 1000 1500 2000 2500 3000
-50 0 50
Samples
m
ic
ro
v
o
lt
s
Fig 6: Eye blink artefact shown in window
Fig 8: Cardiac artefact shown in window
Fig 10:-phone artefact shown in window
Fig 11: Electrode Pop artefact shown in window
Fig 13: physical movement artefact
6.
CONCLUSION
Morphology and electrical characteristics of artefacts can lead to false interpretations. This is unacceptable for clinical as well as nonclinical use. Hence, artefacts should be dealt with properly using artefact proof protocol of EEG recording. Also different artefact removing techniques should be used.
Manual method of artefact removal is the best technique to remove almost all artefacts other than EOG artefact. To remove EOG artefact different algorithms can be used.
The EOG subtraction algorithm is simple for implementation and gives good results for classical analysis, but the disadvantage of this algorithm is in frequency domain analysis, because the removed slot is replaced with DC signal.
7.
REFERENCES
[1] Tandle, A., & Jog, N. (2013). NON-INVASIVE MODALITIES OF NEUROCOGNITIVE SCIENCE USED FOR BRAIN MAPPING : A REVIEW, 1, 621– 628.
[2] Marella, Sudhakar. "Eeg-artifacts-15175461." Slide Share. 29 May 2015.
[3] Vigon, L., Saatchi, M. R., & Mayhew, J. E. W. (n.d.). Quantitative evaluation of techniques for ocular artefact filtering of EEG waveforms, (ii).
[4] Nandini K. Jog Electronics in Medicine and Biomedical Instrumentation ISBN 81-203-2926-0
[5] Teplan, M. (2002). FUNDAMENTALS OF EEG MEASUREMENT,
[6] Dhiman, R., Saini, J. S., & Mittal, a P. (2010). Artifact Removal from Eeg Recordings – an Overview. Science,
(March), 19–20.
[7] Barlow, J. S. (1979). Computerized Clinical Electroencephalography in Perspective, (7), 377–391.
[8] Soomro, M. H., Badruddin, N., Yusoff, M. Z., & Malik, A. S. (2013). A Method for Automatic Removal of Eye Blink Artifacts from EEG Based on EMD-ICA, 8–10.
[9] Joyce, C. a., Gorodnitsky, I. F., & Kutas, M. (2004). Automatic removal of eye movement and blink artifacts from EEG data using blind component separation. Psychophysiology, 41, 313–325. doi:10.1111/j.1469-8986.2003.00141.x
[10]Jafarifarmand, A., Badamchizadeh, M. A., & Seyedarabi, H. (2014). Evaluation Criteria of Biological Artifacts Removal Rate from EEG Signals, 123–128.
[11]Kelly, J. W., Siewiorek, D. P., Smailagic, A., Collinger, J. L., Weber, D. J., & Wang, W. (2011). Fully automated reduction of ocular artifacts in high-dimensional neural data. IEEE Transactions on Biomedical Engineering, 58(3), 598–606. doi:10.1109/TBME.2010.2093932
[12]Jafarifarmand, A., Badamchizadeh, M. A., & Seyedarabi, H. (2014). Evaluation Criteria of Biological Artifacts Removal Rate from EEG Signals, 123–128.
[13]Khandpur Handbook of Biomedical Instrumentation ISBN-13:978-0-07-047355-3