Google Play Store Data Mining and Analysis
Md. Shahriar Kabir
Department of Computer Science & Engineering Chittagong University of Engineering & Technology
Chittagong, Bangladesh
Mohammad Shamsul Arefin, PhD
Department of Computer Science & Engineering Chittagong University of Engineering & TechnologyChittagong, Bangladesh
ABSTRACT
With the popularity of smartphones, mobile application markets have been growing exponentially in terms of the number of users and downloads. As a report from Statista.com says that by 2020 mobile apps are forecast to generate around 189 billion U.S. dollars in revenues via app stores and in-app advertising. So, Google Play store is a crucial place in the field of business. In this work a system has been developed that can mine important data from google play store with the help of app crawler and find correlation among apps rating, reviews, installs and price. The correlation using Spearman Rank Correlation and Pearson Correlation have been compared as well. Besides, reviews have been crawled from the play store for better understanding. The analysis on review tells the top posi-tive and negaposi-tive keywords in free and paid apps. The system will help to give an overview of google play stores current condition.
General Terms:
Natural Language Processing, Machine Learning
Keywords
Mobile Apps, Mining Software Repositories, Correlation Anal-ysis , Extract Review
1. INTRODUCTION
With the vast popularity of smart phones, mobile application markets have been growing exponentially in terms of the number of users and downloads. As a report from Statista.com says that by 2020 mobile apps are forecast to generate around 189 billion U.S. dollars in revenues via app stores and in-app advertising [1]. The mobile app market is growing faster than before. The industry is huge and growing daily, and there is no end in sight. Google play store is one of those app stores which holds over 76% market share currently [2].
Google Play Store is one of the most popular mobile application markets. It has aggregated vital information created by both de-velopers and users. In the app store product pages, dede-velopers usually describe and update the features of their apps. The users give rating to the apps. They share their opinions about apps as well. Recent studies focused on mining app features described by developers as extracting the features from the app descriptions is essential. From Statista.com, there are more than 2.7 million Android apps present on play store as of July, 2019 [1]. Almost 13% of apps are known as low-quality apps. Many apps lack core features as well as extra features that should be present on that apps. So, the motivation behind this project is to find correlation among apps rating, reviews, size, install, price etc. to analyze the condition of the apps market.
2. RELATED WORK
Over the past years, some works were done on app store ana-lytics [3]. Most of these works focus on mining a large amount of app store data to derive advice for analysts, developers, and
users. Mark Harman et al. [4] proposed a system which ana-lyzed the Blackberry app store to find correlation and feature extraction. But they experimented on a limited number of apps. Besides,Blackberry app store is outdated now as it contains less than 1% market share nowadays. Timo Johann et al. [5] proposed a system to extract features from app descriptions and app re-views. But this does not show any correlation among the factors-price, download and rating for better perception. Ning Chen et al. [6] introduced AR Miner computation framework for app re-view extractions. Lorenzo Villarroe, Gabriele Bavota, Barbara Russo, Rocco Oliveto, Massimiliano Di Penta introduces CLAP (Crowd Listener for Release Planning) for categorizing user re-views. They made the system based on app review. So the app description and the correlations are beyond the scope of this pa-per. Emitza Guzman et al. [7] proposed a system to analyze user reviews based on sentiment analysis. This gives an automated approach that helps developers filter, aggregate and analyze user reviews.
Al-Subaihin et al. [8] designed a system to measure app simi-larity based on mined textual features. Lorenzo Villarroel et al. [9] proposed a technique based on user reviews. Besides some more work has been done based on product descriptions in [10 ,11, 12, 13]. Related works that are done have limitations as well as scope to be developed. Very few works have been done for play store apps analyzing based on product description and cor-relation factors, rating, price and number of downloads. So, to remove limitations and provide an efficient way, an app store mining technique have been developed which will ensure an ef-ficient way to analyze the google play app store.
3. PRELIMINARIES
The task of the Google Play Store Data Mining and Analysis can be divided into four main sub-problems. The sub problems are:
—Collection of raw app data from google play store with the help of app crawler
—Parsing the raw data into app name, category, review, size, price, genre etc.
—Correlation of different factors among the apps will be deter-mined
—Finally, top positive and negative keywords will be determined from review section
keywords were determined from review section. This helps to determine which category of the apps perform well in play store. The objectives of this thesis are to achieve following goals:
—To design and develop a system that will analyze the correla-tion among apps rating, reviews, size, installs and price
—To extract the top existing features of same category apps
—To suggest developers building more efficient apps To keep up to date developers with recent apps analysis To help develop-ers investing in the app market for profit
—To maintain the quality of apps in the market To determine which customers, we should target based on user reviews
—To give a statistical overview of app store market To build a baseline that helps others to analyze further
4. SYSTEM ARCHITECTURE
There are mainly three sections in this chapter. First section is about the system architecture of the Google Play Store Data Min-ing and Analysis where different modules of the architecture and relationship among them are described briefly. Among the main modules of the architecture like web crawling module, parsing raw data module, pre-processing module, correlation module. In the next section, the flow graph of the system was shown. The analytical representation of the system have been discussed which gives the details of the developed system with different algorithms, flowcharts required for analysis after that.
4.1 System Architecture
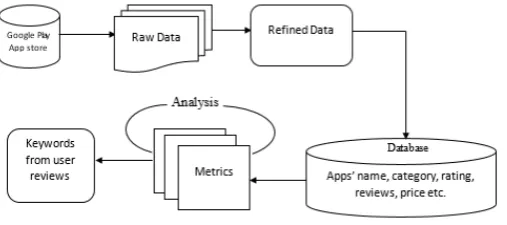
The system architecture of Google Play Store Data Mining and Analysis comprises following basic modules:
—Collecting raw app data from google play store with the help of app crawler.
—Parsing the data into apps name, category, rating, reviews, size, price etc.
—Pre-processing the data to remove noises and extra letters.
—Finding correlation among various factors like rating, reviews, size, price etc.
—Comparing the correlation using Spearman and Pearson cor-relation coefficient.
—Determining the top positive and negative keywords from user reviews.
The architecture is shown in the following figure.
Fig. 1. System Architecture of the System.
4.1.1 Data Collection. A web crawling system has been im-plemented to collect the raw webpage data from the app store.The crawler first collects all category information of the app store and scans each category page to find the list of ad-dresses of all the apps in each category, then it extracts raw data of each app within each category. Python library BeautifulSoup was used to collect the raw data from google play store and save them in csv format.
4.1.2 Parsing Raw Data. The raw data has been parsed ac-cording to a set of pattern templates, the attributes of which spec-ify a unique searchable signature for each attribute of interest. For example, in the system apps name, category, rating, reviews, installs, size, price etc. has been extracted.
4.1.3 Data Pre-processing. As the data was crawled from google play store, it contains some noises. Noises in google play store reviews are natural as people express their feelings infor-mally in the review section. Besides, google play store contains other noises such as price includes $ symbol. So, at first some general cleaning is done, such as:
—Dropping the data frame which has NA values. —Dropping the duplicate values.
—Since the columns Installs and Price are in string, we con-verted them into integer and float format respectively. —Removing Currency symbol from the Price and making it
float.
To handle the review section, the following pre-processing tasks are taken:
4.1.3.1 HTML Tags. Reviews may contain html tags. So, html tag has been removed from the raw data.
4.1.3.2 Stop Word. There are some words which do not make any significant change in absence of them. Those words are called stop word. There are a lot of stop words in English lan-guage. Stop words list have been made from general stop words. Thus stop words have been removed from the data set.
4.1.3.3 Tokenization. Given a character sequence and a de-fined document unit, tokenization is the task of chopping it up into pieces, called tokens, perhaps at the same time throwing away certain characters, such as punctuation.
4.1.3.4 Stemming. Stemming is a technique to remove affixes from a word, ending up with the stem. Stemming was used in the data set to reduce the number of words and made our feature vector size small.
Table 1: Application review in raw form and processed form
Raw Form Processed Form
I like eat delicious food. That’s I’m cooking.
like eat delicious food thats cooking food cas...
This help eating healthy exercise regular basis
help eating healthy exercise regular basis
Works great especially going gro-cery store
work great especially going grocery store
Best idea us best idea
Best way best way
varies between +1 and -1. A value of 1 indicates a perfect de-gree of association between the two variables. As the correlation coefficient value goes towards 0, the relationship between the two variables will be weaker. The direction of the relationship is 25 indicated by the sign of the coefficient; a + sign indicates a positive relationship and a sign indicates a negative relation-ship.Pandas dataframe.corr() is used to find the pairwise correla-tion of all columns in the dataframe.Any NA values are automat-ically excluded. For any non-numeric data type columns in the data frame it is ignored.
—Spearman Rank Correlation: When the variables are not normally distributed or the relationship between the variables is not linear, it may be more appropriate to use the Spearman rank correlation method.We have used Spearmans correlation method in our system. The formula
is-rs=
6P
d2
i
n(n2−1) (1)
n= number of data pairs d= rankxi- rankyi
—Pearson CorrelationPearson r correlation is the most widely used correlation statistic to measure the degree of the relation-ship between linearly related variables. For example, in our google play store data analysis project, if we want to measure how two variables like apps installation and size are related to each other, Pearson r correlation is used to measure the degree of relationship between the two. Thepoint-biserial correlation is conducted with the Pearson correlation formula except that one of the variables is dichotomous. The following formula is used to calculate the Pearson r correlation:
r= n
P
xy−
P
x
P
y
q n(P
x2−(Px)2)(n(Py2−(Py)2) (2)
P
x= sum of x scores
P
y= sum of y scores
P
x2= sum of squared x scores P
y2= sum of squared y scores
4.1.3.6 Keyword Extraction. The following rules are
applied-—Each document have been tokenized. —Each document have been lemmatized. —Stop words have been removed.
—For every term in the current document, and every document in the set, term frequency have been computed.
—For every term, the inverse document frequency have been computed.
—For every term in the current document, and every document in the set, tf-idf score have been computed.
—the top k words have been choosen by tf-idf score.
Thus, we have computed the top keywords.
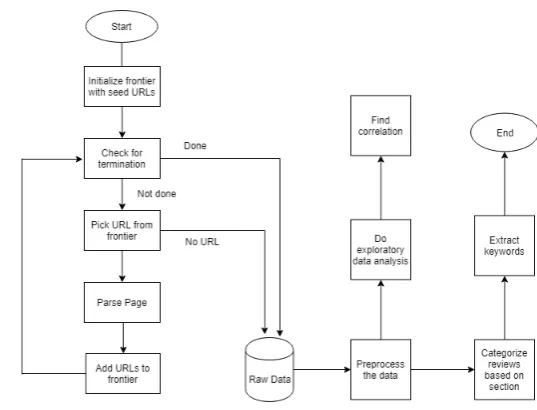
4.2 Flow Graph of Google Play Store Data Mining and Analysis
Fig. 2. Flow graph of the whole system.
4.3 Analytical Representation of the Architecture
This section gives an analytical description of the system archi-tecture given in previous sections. The system archiarchi-tecture above illustrates the internal and external structure of system modules integrated together in one package to form one system. The fol-lowing subsections provide a brief background overview of the tools used and the implementation details of the different mod-ules of the developed system starting from the back-end to the front-end. The whole system was developed on Windows oper-ating system, PyCharm IDE and Jupyter Notebook.
4.3.1 Crawling Data from Google Play Store. Application in-formation data have been crawled from google play store.
Algorithm 1Crawling Google Apps Information
1: Let S be the set of URLs to pages waiting to be indexed. Initially S is the singleton known as the seed.
2: Take an element of S and retrieve the pages, P that it refer-ences.
3: Parse the page P and extract the set of URLs L it has links to.
4: UpdateS=S+L
5: Repeat as many times as necessary.
4.3.2 Cleaning Raw Data. After data is crawled from google play the information are in raw form, the data needs to be cleaned. Several cleanings like removing URL, dropping NA values, removing duplicate values, converting data format, re-moving stop words etc have been performed.
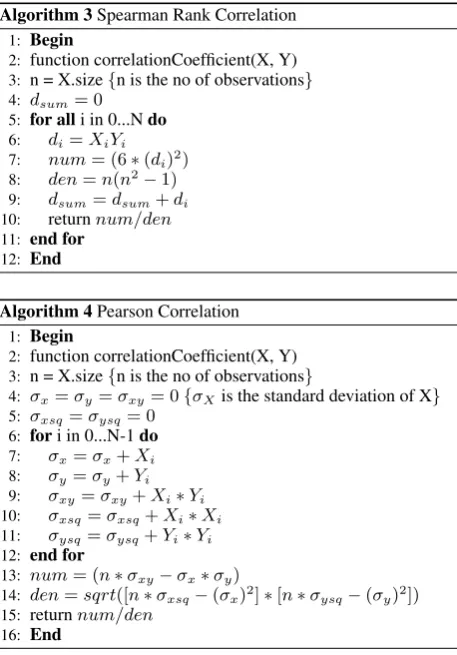
4.3.3 Correlation Algorithm. To find the correlation, two al-gorithms are
Algorithm 2Cleaning raw data 1: Begin
2: remove URL from application information 3: drop missing values
4: remove duplicate values
5: remove + symbol from installs values 6: convert string into integer for installs values 7: remove $ symbol from price values 8: convert string into float for price values 9: convert the raw data into lowercase form 10: search for html tags in application review 11: ifhtml tags found thenthen
12: remove html tags
13: search for stop words in application review 14: end if
15: ifstop words found thenthen
16: remove the stop words 17: tokenize the application review
18: apply stemming on the application review 19: end if
20: End
Algorithm 3Spearman Rank Correlation 1: Begin
2: function correlationCoefficient(X, Y) 3: n = X.size{n is the no of observations}
4: dsum= 0
5: for alli in 0...Ndo
6: di=XiYi
7: num= (6∗(di)2)
8: den=n(n2−1)
9: dsum=dsum+di
10: returnnum/den 11: end for
12: End
Algorithm 4Pearson Correlation 1: Begin
2: function correlationCoefficient(X, Y) 3: n = X.size{n is the no of observations}
4: σx=σy=σxy= 0{σXis the standard deviation of X}
5: σxsq=σysq= 0
6: fori in 0...N-1do
7: σx=σx+Xi
8: σy=σy+Yi
9: σxy=σxy+Xi∗Yi
10: σxsq=σxsq+Xi∗Xi
11: σysq=σysq+Yi∗Yi
12: end for
13: num= (n∗σxy−σx∗σy)
14: den=sqrt([n∗σxsq−(σx)2]∗[n∗σysq−(σy)2])
15: returnnum/den 16: End
5. EMPIRICAL EVALUATION
Google Play Store Data Mining and Analysis has been developed on a machine having the Windows 10, core i3 processor with 4GB RAM. The system has been developed in Python. Data is stored in csv format.
5.1 Crawling Mechanism of Data set
Application details have been crawled from google play store to make our data set. After collecting all the application details, they were classified into some different category like applica-tion name, rating, reviews, installs, size, price etc. and finally put
them in a CSV file. They were stored into two CSV file. One CSV file is for storing application name and details information. Another CSV file contains the review section related to applica-tion.
Table 2: Summary of collection method
Collection Type No of Items
Number of unique applications 10842
Number of reviews 255993
5.2 Performance Measure
50 random apps have been collected from the google play store. Then the correlation of rating with reviews, size, installs and price have been checked. The formula that was used for deter-mining
accuracy-Accuracy = (Actual Coefficient-Observed Coefficient)/Actual Coefficient
Here only positive values have been considered.
Table 3: Accuracy using Spearman Rank Correlation
Actual Coeffi-cient
Observed Coeffi-cient
Accuracy Relative Accu-racy Rating &
Re-views
0.4303 0.4123 0.958 95.8%
Rating & Size 0.0342 0.0332 0.97 97% Rating & Installs 0.3526 0.4213 0.837 83.7% Rating & Price 0.0245 0.0192 0.784 78.4%
Table 4: Accuracy using Pearson Correlation
Actual Coeffi-cient
Observed Coeffi-cient
Accuracy Relative Accu-racy Rating &
Re-views
0.0647 0.0610 0.943 94.3%
Rating & Size 0.0999 0.0854 0.854 85.4% Rating & Install 0.0706 0.0543 0.769 76.9% Rating & Price -0.0143 -.0189 0.756 75.6%
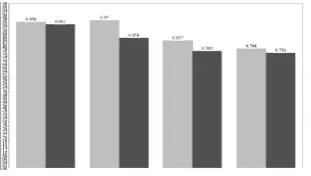
Then the accuracy result from Spearman Rank correlation and Pearson Correlation have been compared. The comparison graph is given below
From this comparison graph, it can be said that Spearman Rank Correlation gives more accurate result than Pearson Correlation.
6. CONCLUSION
Fig. 3. Comparison of Spearman Correlation and Pearson Corre-lation.
Thus, it helps the developer to decide which category of apps are performing best in the market. So, it helps app developers to develop more efficient apps to compete into application business.
In case of correlation, ratings, reviews, installs, size and price have been considered. But other factors like content rating, an-droid version, apps version can be considered for better accuracy. The system analyzes review sections. But application description can be crawled as well to find the correlation more efficiently. Analyzing this data will be challenging, but this will improve the quality of the current system.
7. REFERENCES
[1] Worldwide mobile app revenues in 2015, ”Mobile app revenues 2015-2020 — Statistic”, Statista, 2018. [Online]. Available: https://www.statista.com/statistics/269025/ worldwide -mobile-app-revenue-forecast/.
[2] ”Mobile Operating System Market Share Worldwide — StatCounter Global Stats”, StatCounter Global Stats, 2018. [Online]. Available: http://gs.statcounter.com/os-market-share/mobile/worldwide.
[3] W. Martin, F. Sarro, Y. Jia, Y. Zhang and M. Harman, ”A Survey of App Store Analysis for Software Engineering”, IEEE Transactions on Software Engineering, vol. 43, no. 9, pp. 817-847, 2017.
[4] Mark Harman, Yue Jia and Yuanyuan Zhang (2012). App store mining and analysis: MSR for app stores. 2012 9th IEEE Working Conference on Mining Software Reposito-ries (MSR).
[5] T. Johann, C. Stanik, A. B. and W. Maalej, ”SAFE: A Sim-ple Approach for Feature Extraction from App Descrip-tions and App Reviews”, 2017 IEEE 25th International Re-quirements Engineering Conference (RE), 2017.
[6] N. Chen, J. Lin, S. Hoi, X. Xiao and B. Zhang, ”AR-miner: mining informative reviews for developers from mobile app marketplace”, Proceedings of the 36th International Con-ference on Software Engineering - ICSE 2014, 2014. [7] E. Guzman and W. Maalej, ”How Do Users Like This
Fea-ture? A Fine Grained Sentiment Analysis of App Reviews”, 2014 IEEE 22nd International Requirements Engineering Conference (RE), 2014.
[8] A. Al-Subaihin, F. Sarro, S. Black, L. Capra, M. Har-man, Y. Jia and Y. Zhang, ”Clustering Mobile Apps Based on Mined Textual Features”, Proceedings of the 10th ACM/IEEE International Symposium on Empirical Soft-ware Engineering and Measurement - ESEM ’16, 2016. [9] L. Villarroel, G. Bavota, B. Russo, R. Oliveto and M. Di
Penta, ”Release planning of mobile apps based on user re-views”, Proceedings of the 38th International Conference on Software Engineering - ICSE ’16, 2016.
[10] J. Davril, E. Delfosse, N. Hariri, M. Acher, J. Cleland-Huang and P. Heymans, ”Feature model extraction from
large collections of informal product descriptions”, Pro-ceedings of the 2013 9th Joint Meeting on Foundations of Software Engineering - ESEC/FSE 2013, 2013.
[11] M. Acher, A. Cleve, G. Perrouin, P. Heymans, C. Vanbene-den, P. Collet and P. Lahire, ”On extracting feature models from product descriptions”, Proceedings of the Sixth Inter-national Workshop on Variability Modeling of Software-Intensive Systems - VaMoS ’12, 2012.
[12] H. Dumitru, M. Gibiec, N. Hariri, J. Cleland-Huang, B. Mobasher, C. Castro-Herrera and M. Mirakhorli, ”On-demand feature recommendations derived from mining public product descriptions”, Proceeding of the 33rd inter-national conference on Software engineering - ICSE ’11, 2011.