RESEARCH ARTICLE
Design and Simulation of Wireless Sensor Network
Topologies Using the ZigBee Standard
Sercan VANÇİN
Department of Computer Engineering, Firat University, Elazig, Turkey
[email protected]
Ebubekir ERDEM
Department of Computer Engineering, Firat University, Elazig, Turkey
[email protected]
Abstract –Wireless sensor networks are network systems consisting of hundreds, even thousands of sensor nodes connected to each other through a wireless environment. Sensor nodes have complex functions, such as the detection, collection, calculation and routing of surrounding data with predefined criteria by placing them randomly or according to a certain strategy into diverse areas. In this study, the IEEE 802.15.4/ZigBee wireless communication standard was used, which is more advantageous than other wireless communication standards with respect to parameters like battery usage and low power consumption, providing high performance with short-range sensors as well as making it possible to use 3 different band frequencies in the world. Additionally, the RIVERBED (OPNET) Academic Edition 17.5 simulator, capable of generating correct results and analysis to identify the actual behavior of the real system, was used. With this simulator program, the performances of star, tree, and mesh topologies supported by the ZigBee standard were compared based on end-to-end delay, throughput, mac load and traffic received parameters. Then, the performance analyses were conducted on different PANs (Personal Area Network) using single and dual ZigBee coordinators. Finally, network fixed and mobile node behavior was compared with respect to the quality parameters of the end-to-end delay and traffic received by the destination.
Index Terms –Wireless Sensor Networks, ZigBee, RIVERBED (OPNET), Wireless Network Topologies, Performance Analysis.
1. INTRODUCTION
A wireless sensor network is a network structure created by sensor nodes that collect data from the environment in which they reside with given capabilities and which transmit that data to a base station via other sensor nodes after processing them [1]. With recent developments in wireless communication, progress in areas like processor quality, memory capacity and low power consumption has increased the importance of micro electromechanical systems [2]. Sensor networks installed using devices of a small size have been inexpensive and sensors' communicating each other has become easier with self-organized devices. In this regard, sensors have different roles with some of them considered to be main sensors that process raw data coming from other
sensors and saving them temporarily in their built-in memories to be used at specific times. Some other sensors detect analog data in the environment and transmit to the other sensor or sensors. Wireless sensor networks can be used almost anywhere needed, such as home applications, in industry, the physical environment, the military field, hospitals, etc. Moreover, they can be used in unreachable places such as high mountains and danger zones [3, 4, 5]. In previous studies, the behavior of PANs with different coordinators was simulated using the OPNET Modeler program for nodes connecting to other coordinators in the case of a malfunction of the resident coordinator and the comparison of ZigBee topologies was conducted in respect to quality parameters such as end-to-end delay, number hops and throughput [6,7].
RESEARCH ARTICLE
overview related to IEEE 802.15.4/Zigbee standard. Section 4 explains the simulation model created. Finally, Section 5 concludes the paper with some suggestions.
2. WIRELESS SENSOR NETWORKS Wireless sensor networks are distributed network structures in which many sensors connect wirelessly to communicate with one another. Wireless communication is transmission between a transmitter and a receiver without any cable connection, via light or electromagnetic waves. The components in electronic applications that conduct detection are called sensors, also known as detectors or probes. Sensors have the ability to detect many physical units, such as length, area, volume, mass air flow, strength, temperature, heat transfer, voltage, electric current, resistance, flux density, magnetic torque, condensation, content, and oxidation/reduction. The main components of a sensor node are the microcontroller, memory, receiver-transmitter, power supply and other components that may number one or more. There exist a variety of types of sensor nodes on the market, such as micaZ, mica2, TelosA, TelosB, Sensenode, eMote and IMote2 to be able to generate wireless sensor networks [8, 9].
Wireless sensor networks utilize a layer structure that includes a physical layer, data link layer, network layer, transport layer and application layer similar to the OSI (Open Systems Interconnection) structure. The transmission of data packages in the network layer is performed through these layers, using different routing algorithms [10]. Although wireless sensor networks usually support several topologies, the main ZigBee based sensor network topologies are star, tree and mesh [11]. ZigBee is differentiated from other communication standards like Wi-Fi, Bluetooth and WiMAX when it comes to criteria like small-sized data transmission and low power consumption [12]. Additionally, ZigBee is more advantageous than other wireless sensor communication standards including 6LoWPAN, ISA100.11a and Wireless Hart because it provides flexible bandwidth and scalability and is self-organized.
3. THE IEEE 802.15.4/ZIGBEE STANDARD
There exist many wireless communication standards that are used in industrial applications. Among them IEEE 802.11x is a standardized communication protocol known as Wi-Fi, under the name 802.11 by IEEE. It enables data transfer at speeds from 1Mbps up to 50 Mbps. Data transfer can be achieved over up to 100-meter lengths with a standard antenna; however, with a high-power antenna, data transmission can take place over much longer distances. Another is Bluetooth [12], a more powerful personal area network standard than the IEEE 802.11x standard. It was developed for use in short-range data transfer applications between devices like computers and mobile devices [13].
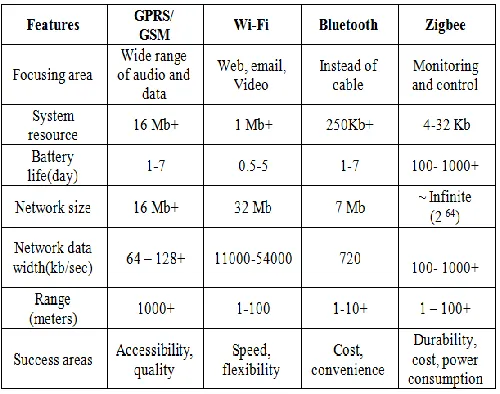
ZigBee is one of today's most useful technologies in the wireless sensor network industry. ZigBee, which is a new standard for wireless communication [14], is based on the IEEE 802.15.4standard announced in 2003 by the IEEE [15, 16]. ZigBee is established on powerful radio (physical layer) and MAC (Medium Access Control) layers defined by the IEEE 802.15.4 standard. It utilizes a standard CSMA/CA media access mechanism and supports star, tree and mesh topologies. IEEE 802.15.4 defines three license-free frequency bands. The first band uses the 2.4 GHz frequency band, i.e., the ISM (Industrial Scientific and Medical) band, and has 16 channels. The second band uses the 902-928 MHz frequency band with 10 channels. The other uses the 868-870 MHz frequency band with only one channel. The capacities of these frequency bands are 250 kb/s, 40 kb/s and 20 kb/s, respectively [15,17,18]. ZigBee deals with transferring certain amounts of data between devices used in personal area networks, measurements with networks, detection, monitoring and checking the applications. However, it is not suitable for large-size file transfers like Wi-Fi or Bluetooth. ZigBee is differentiated from Wi-Fi or Bluetooth in terms of communication approach between multiple devices, and works over simple networks with less power consumption and cost, also providing communication with lower bandwidth demands. In Table 1, a comparison of the features of ZigBee and some other wireless technologies is shown [15, 19]. As understood from the table, although the battery life of Bluetooth is 1-7 days, ZigBee’s battery life is 100-1000 days. In addition, while Wi-Fi’s fields of success are usually speed and flexibility, it can be said that ZigBee’s success rests in durability, cost and power consumption.
Table 1 Comparison of ZigBee and other wireless technology features
RESEARCH ARTICLE
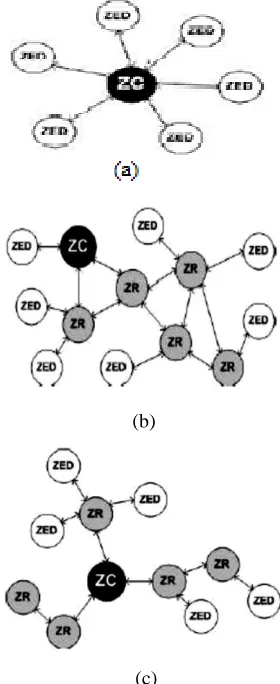
ZigBee Coordinator (ZC): The ZigBee coordinator initiates the network, protects it and generates the control functions needed. As soon as the network initiates, the PAN coordinator works as ZR. If the network operates in beacon-active mode, ZC periodically sends beacon frames to be able to synchronize the rest of the network. In cluster tree topology, all ZRs receive beacons from their parents and send their own beacons to nodes in their clusters [6].
ZigBee Router (ZR): The router has the capacity to direct the data detected to the sink node. It plays a multiple node hopping role by having a relation with ZC or any ZR previously [6].
ZigBee End Device (ZED): They serve only as normal nodes without any routing feature [6]. ZigBee technology uses three basic topologies, including star, tree and mesh, as seen in Figure 1. The star topology seen in Figure 1.a has a structure with centralized management and communication. Its architecture is based on the central node. ZEDs do not contact each other directly, instead communicating through the ZC in the center. The ZC holds a PAN ID and this ID is not defined in any other ZigBee network in the environment. Star topology consumes battery power y rapidly because it points toward the center. Also, ZigBee clustering is cumbersome while addressing large-scale networks. For this reason, the star topology is not very suitable for conventional wireless sensor networks [6]. The mesh topology shown in Figure 1.b is also centralized like the star topology and any node can reach and communicate with any other node in the network. Although this gives the network high flexibility, it also introduces the complexity of end-to-end communication. The mesh topology manages power efficiency and battery usage better than the star topology. As it does not determine a single route between nodes [6]. The tree topology shown in Figure 1.c, with its low power consumption and cost [20], is very suitable topology for wireless sensor networks. The power protection process is provided by the IEEE 802.15.4/ZigBee Mac frame [21]. Although tree topology is efficient for wireless sensor networks, it has drawbacks related to restrict routing processes and band usage. Any disconnection in tree topology delays data flow and a heavy workload is created with recovery processes. The topology does not use multiple routes. Tree topology is better than mesh topology with respect to memory usage, as a single route is used from source node to the destination node and excess memory is not saved [6].
(b)
(c)
Figure 1 ZigBee topologies a) star b) mesh c) tree 4. SIMULATION OF THE SYSTEM DESIGN In this study, a wireless sensor network system was designed by creating different ZigBee topologies. To simulate the evaluation and the analysis of the system designed and to be able to predict whether the real system results would be correct, the Riverbed (OPNET) Modeler Academic Edition 17.5 has been used as a simulation tool. Riverbed is a company that purchased the Opnet Company. This version of the program not only enables the development of robust network communication and various system models, but also communication between the administrator, the PAN coordinator, routers and end devices.
RESEARCH ARTICLE
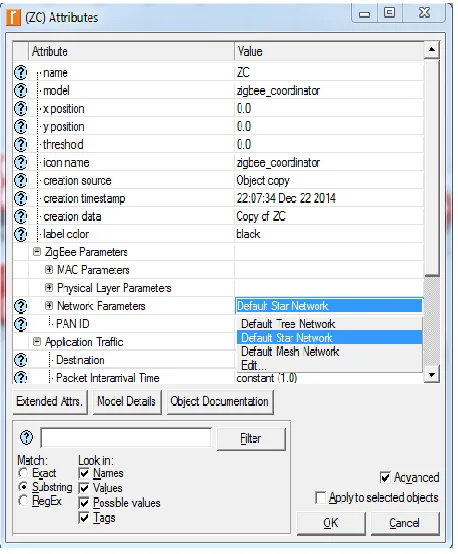
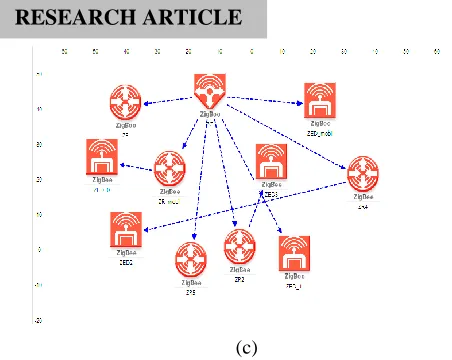
with a single ZC and those with 2 ZCs, were compared based on the 4 parameters used in the first scenario. Finally, a performance analysis of the mobile node and any fixed node in the ZigBee network was conducted based on the end-to-end delay and traffic received by destination parameters. In all scenarios and network topologies, 5 ZRs and 5 ZEDs were used, one mobile and the rest static. Also, 1 ZC was used in the first scenario and 2 ZCs in the last scenario. As the topologies were created, 1 ZC, 5 ZRs, and 5 ZEDs were selected from the Object Palette Tree, the component library of the RIVERBED (OPNET) program seen in Figure 2, and were distributed randomly to the wireless sensor network environment. Adjustments were made to the selected ZigBee coordinator to determine the attributes by right-clicking on the component and selecting Edit Attributes, as shown in Figure 3. As seen in Figure 3, the Default Star Network was selected when creating the star topology. For other topologies, the Default Tree Network and Default Mesh Network were selected for the tree and mesh topologies, respectively. Moreover, other coordinator qualifications and the number of network devices were the same. Figure 4.a, Figure 4.b, and Figure 4.c show the star, tree and mesh topologies, respectively. The network structures of the tree and mesh topologies are the same, however, the mesh topology can determine alternative routes by holding a routing table in itself.
Figure 2Object palette tree
Figure 3ZigBee coordinator configuration
(a)
RESEARCH ARTICLE
(c)
Figure 4 Topology structures a) star b) tree c) mesh In the simulation, mesh routing for tree and star topologies was made passive, but active for the mesh topology. The simulation time was set to one hour. The size of the data packages to be sent had been determined as 1024 bytes and a target was selected at random. The simulation was run in the Riverbed Modeler for sensor nodes to collect information from their environment initially. By this means, the sensors communicated with each other by sending messages to one another, and the data needed for the simulation was obtained. Then, global and object statistical values were selected for later use in the simulation, results were recorded and represented in terms of graphical format for interpretation 4.1 Scenario 1
In this scenario, the star, tree, and mesh topologies were compared with each other based on parameters like end-to-end delay, throughput, mac load and traffic received. Figure 5.a, Figure 5.b, Figure 5.c Figure 5.d show the analysis results of 3 topologies according to the end-to-end delay, throughput, Mac load and traffic received parameters, respectively. End-to-end delay is a measure of a package’s network delays. It is the duration that starts as soon as a message is queued and lasts until the last bit reaches the destination node. As seen in Figure 5.a, end-to-end delay time is the lowest in the mesh topology network, approximately 0.011 seconds during the simulation, and it is understood that the tree topology network causes the longest delay. This is due to the mesh topology holding a routing table as a structural need and ability to determine various alternative routes that take less time for a message to pass from one end to another.
Throughput can be comprehended as a quality service parameter if it is defined as the power to deliver data correctly from source to destination at a specific time. As a result of user intervention or package jams and collisions between sensors, efficiency is reduced. Figure 5.b shows the analysis result of the 3 topologies according to the throughput parameter. It is observed that the tree topology can transmit
approximately 24,000 bits of data to the destination node in a second a short period after the simulation begins. However, the mesh and star topologies are similar to each other and transmit data at a little higher than 20,000 bits. This is because the tree topology can communicate with PAN coordinators and ZRs. Communicating with ZRs but less with end devices and determining better routes to circulate on less nodes decreases collisions, and as a result achieves better output efficiency.
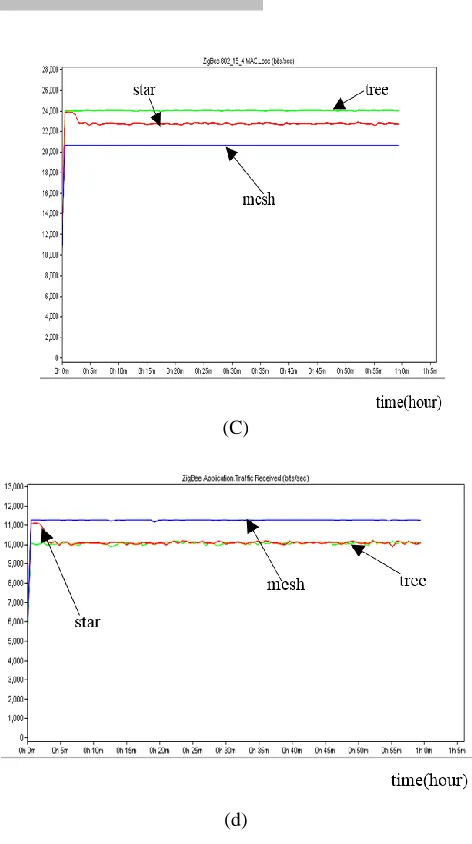
Mac load is the forwarding load for each PAN to transfer the packages to the IEEE 802.15.4 Mac layer, i.e., physical layer, by the upper layers. As shown in Figure 5.c, Mac load performance presents similar results with throughput performance. In other words, this result verifies the judgment that the faster the load transfer to the top layers from the physical layer, the more efficient the network.
(a)
RESEARCH ARTICLE
(C)
(d)
Figure 5Performance analysis of star, tree and mesh topologies based on a) end-to-end delay b) throughput c) Mac
load d) traffic received
The traffic received performance criterion refers to the density throughout the network. The number of bits per second was observed in this scenario. Figure 5.d shows the analysis result of the 3 topologies according to the traffic received parameter. It can be clearly seen that the tree and star topologies yield similar results, while the mesh topology creates more traffic density since it has several package transferring routes from node to node.
4.2 Scenario 2
In this scenario, the tree topology with 1 ZC used in the first scenario, thought of as PAN-0, was compared to the PAN-0 and PAN-1 networks configured according to the tree topology with 2 ZCs. The simulation was re-run and the
difference between the two systems tested for their end-to-end delay, throughput, Mac load and traffic received parameters. Figure 6 shows the structure of the tree topology with a 2-ZC ZigBee network. As shown in Figure 7.a, PAN-0 with its single ZC and PAN-1 with its double ZC have similar delay properties, but the PAN-0 with a double ZC encounters less delay. This is because communication time between ZEDs is shortened in a network with double ZCs. That is, when one of the ZCs is busy, the other ZC takes over the package from the relevant ZED, thereby reducing the ZED’s standby time. However, the PAN-1 yielded a result as a single ZC network since it took over the package. Figure 7.b shows that the throughput of multi-ZC networks is lower. This is due to packages with collisions that cause structural damage while passing through multiple routes. Figure 7.c shows that Mac load is the lowest in the double-ZC PAN-0 network and reaches the highest in the single-ZC PAN-0. From this, it is understood that the workload of a single ZC network is greater when transferring the package to the bottom layer. Finally, Figure 7.d shows traffic received and Mac load performances, with similar results.
Figure 6 Structure of tree topology with Dual ZC
RESEARCH ARTICLE
(b)
(c)
(d)
Figure 7 Performance analysis of networks with different PANs a) end-to-end delay
b) throughput c) Mac load d) traffic received
4.3 Scenario 3
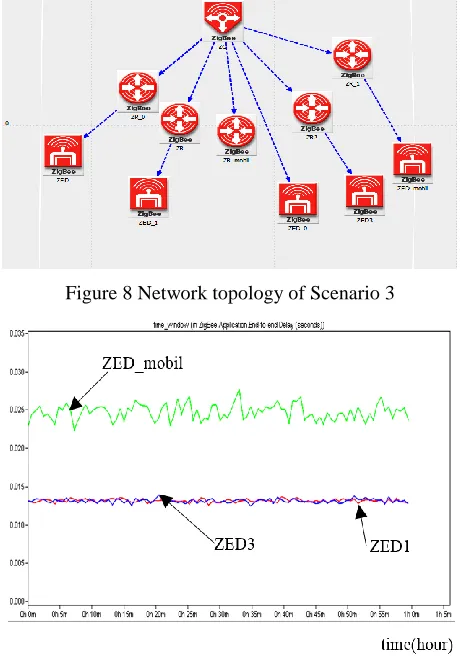
In this scenario, a comparative analysis was conducted between fixed-end nodes and mobile-end nodes according to the end-to-end delay and traffic received by destination performance criteria. Figure 8 shows the created network topology. The trajectory of the mobile end node in the network is shown in Figure 8. The positioning and configuration steps of devices in the network are similar to those in other scenarios. The simulation was run for 1 hour and the results obtained from the View Results menu of the Riverbed program according to the parameters discussed. As shown in Figure 8, ZED_1, ZED3 and ZED_mobil were able to reach their target ZC with the help of ZR, ZR2 and ZR_1, respectively. All the ZigBee routers in the network are identical. Firstly, the ZigBee network comparison based on the end-to-end delay parameter shown in Figure 9.a was conducted via the ZED_1, ZED3 and ZED_mobil end nodes. This shows that although they communicate with different
Figure 8Network topology of Scenario 3
RESEARCH ARTICLE
(b)
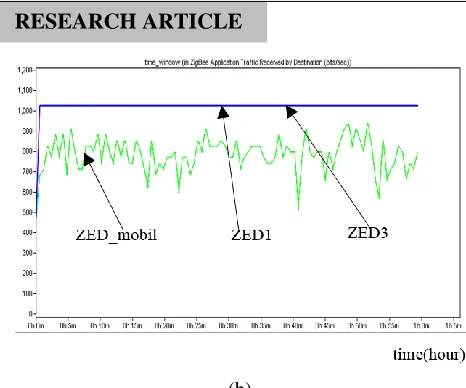
Figure 9Analysis of fixed and mobile nodes a) end-to-end delay b) traffic received by destination
routers, the delay times for fixed nodes are similar, while mobile nodes lead to further delay. This is because a mobile node moves around all network devices with a specific speed on its trajectory, causing package flow density. Also, it was observed that the mobile node is more unstable due to these fluctuations in delay time. Finally, the traffic received by destination parameter of the same nodes targeting the ZC device was analyzed with an aim to detect the difference in traffic congestion that the nodes receive from the ZC. As seen in Figure 9.b, the amount of traffic received by fixed nodes are the same and more than the mobile node's traffic density. Although it is equal to the fixed node's traffic at the start of the simulation, the mobile node's packages arrive at and return from the target more quickly because it is moving.
5. CONCLUSIONS
In this study, a performance analysis of ZigBee-based wireless network topologies was conducted using the Riverbed Modeler Academic Edition 17.5 simulator. The ZigBee standard is a wireless communication protocol with superior structure with respect to its low power consumption, efficient battery usage and low cost. In the study, 3 scenarios were carried out; their performance results may be listed as follows:
In the first scenario, star, tree, and mesh topologies were compared based on 4 parameters: end-to-end delay, throughput, Mac load and traffic received. It was determined that the tree topology is better with respect to throughput, but performs worse than mesh topology when it comes to end-to-end delay time. It was also observed that a tree topology network has a higher Mac load and similar traffic received values as compared to the star topology, however these values are lower than that of the mesh topology. In complex networks, i.e., ZigBee networks with vast
numbers of nodes, it can be said that the usage of mesh topology is important.
In the second scenario, an analysis was conducted using multi-ZCs according to the parameters of the first scenario. The PAN-0 with a single ZC and the PAN-1 with a double ZC have similar delay properties, but the PAN-0 with a double ZC has less delay. It has been observed that networks with multiple ZCs have lower throughput values. Mac load was the lowest in the double ZC PAN-0 network and reached its highest value in the single ZC PAN-0. Similar results with Mac load performance occurred when compared based on traffic received.
In the final scenario, the parameters of traffic received by destination and end-to-end delay time for mobile nodes and fixed nodes connected to different routers were compared. It has been observed that the end-to end delay times of fixed nodes are similar, while mobile nodes create more end-to-end delay. The traffic received by destination amounts for fixed nodes are similar, while they receive more than mobile nodes do. It has been determined that if mobile node has a more sensitive and less prominent role in the network, traffic load would be decreased. Although memory usage is increased by holding route tables for many alternative routes in complex sensor networks, using mesh topology may be advantageous. However, for those networks with small numbers of sensor nodes, the tree topology is suitable due to its ability to transmit data to its destination without keeping the central node too busy and with a small delay. It can also be stated that using communication standards such as ZigBee, which consumes energy at a minimal level in wireless sensor networks, provides designers an advantage as small-sized data is transferred in such networks.
REFERENCES
[1] U. Aslan, “The effects of hierarchy on mobile wireless sensor network coverage”, M.S. thesis, Middle East Technical University, Ankara, Turkey, 2006.
[2] M. F. Othman and K. Shazali, “Wireless sensor network applications: a study in environment monitoring system,” in Proceedings of the International Symposium on Robotics and Intelligent Sensors (IRIS ’12), pp. 1204–1210, 2012.
[3] J. Lloret, M. Garcia, D. Bri, and S. Sendra, “A wireless sensor network deployment for rural and forest fire detection and verification,” Sensors, Vol. 9, No. 11, pp. 8722–8747, 2009.
[4] I. F. Akyildiz, W. Su, Y. Sankarasubramaniam, and E. Cayirci, “Wireless sensor networks: a survey,” Computer Networks, Vol. 38, No. 4, pp. 393–422, 2002.
RESEARCH ARTICLE
[6] S.W. Nourildean, “A study of ZigBee network topologies for wireless sensor network with one coordinator and multiple coordinators”, Tikrit Journal of Engineering Sciences, Vol.19, No.4, 2012.
[7] B. Mihajlov and M. Bogdanoski, “Overview and analysis of the performances of Zigbee based wireless sensor networks”, International Journal of Computer Applications, Vol. 29, No.12, 2011.
[8] X. Wang and S. Zhang, “Comparison of Several Sensor Deployments in Wireless Sensor Networks”, International Conference on E-Health Networking, Digital Ecosystems and Technologies, Vol. 1, pp 236 – 239, 2010.
[9] S. Kumagai and H. Higaki, Signal Processing and Communication Systems (ICSPCS), 8th International Conference, Vol. 8, pp 1-8, 2014. [10] W. B. Heinzelman, A. P. Chandrakasan, and H. Balakrishnan, “An
application-specific protocol architecture for wireless micro sensor networks,” IEEE Transactions on Wireless Communications, Vol. 1, No. 4, pp. 660–670, 2002.
[11] M. Youn and J. Lee, “Topology Control Algorithm considering Antenna Radiation Pattern in Three-Dimensional Wireless Sensor Networks” International Journal of Distributed Sensor Networks, Vol. 2014, Article ID 801519, pp 1-11, 2014.
[12] U. Pesovic, J. Mohorko, S. Randic and Z. Cucej, “Hidden node avoidance mechanism for IEEE 802.15.4 wireless sensor networks”, Journal of Microelectronics, Electronic Components and Materials, Vol. 43, No. 1, pp 14 – 21, 2013.
[13] K. Chang, “RF and microwave wireless systems”, John Wiley& Sons, New York,2000.
[14] D. M. Amzucu, H. Li, and E. Fledderus, “Indoor radio propagation and interference in 2.4 GHz wireless sensor networks: measurements and analysis,” Wireless Personal Communications, Vol. 76, No. 2, pp. 245– 269, 2014.
[15] B. Karasulu, L. Toker and S. Korukoglu, “ZigBee - IEEE 802.15.4 Standard based wireless sensor networks”, International Conference, Information University, Istanbul, Turkey, 2009 (in Turkish).
[16] E. Callaway, P. Gorday and V. Bahl, “Home networking with IEEE 802.15.4: A developing Standard for low-rate wireless Personal Area Networks”, IEEE Communication. Magazine, Vol. 40, No. 8, 2002. [17] K. Benkic, P. Planinsic and Z. Cucej, "Custom wireless sensor network
based on Zigbee”, 49th International Symposium, ELMAR, pp 259-262, 2006.
[18] P. Kinney, “ZigBee Technology: Wireless control that simply works”, Technical-White Paper, Kinney Consulting LLC, Chair of IEEE 802.15.4 Task Group, Secretary of ZigBee BoD, Chair of ZigBee Building Automation Profile WG, 2003.
[19] S. Safaric and K. Malaric, "ZigBee wireless standard", 48th International Symposium, pp: 259-262, 2006.
[20] G. Hong and S. Jianxiu, “Design of the temperature signal wireless receiver and display system on polishing interface in chemical mechanical polishing,” Procedia Engineering, Vol. 24, pp. 417–421, 2011.
[21] Y. Yan, B. Zhang, H. T. Mouftah, and J. Ma, “Practical coding aware mechanism for opportunistic routing in wireless mesh networks,” in Proceedings of the IEEE International Conference on Communications (ICC ’08), pp. 2871–2876, 2008.
Authors
S. VANCIN received his BSc in Computer Engineering from Firat University, Turkey in 2013. At present he is pursuing MSc in Computer Engineering, Firat University, Turkey. His research interests include wireless sensor networks and embedded systems.