Remote Sensing and GIS for Hydrology and Water Resources (IAHS Publ. 368, 2015) (Proceedings RSHS14 and ICGRHWE14, Guangzhou, China, August 2014).
275
Effects of dams on river flow regime based on IHA/RVA
QINGTING ZUO
1& SHIKUI LIANG
1,21 Center for Water Science Research, Zhengzhou University, Zhengzhou, Henan Province, 450001, China
2 College of Water Conservancy, North China University of Water Resources and Electric power, Zhengzhou, Henan Province, 450011, China
Abstract The river hydrologic regime is a driving force of the river ecosystem. Operation of dams and sluices has significant impacts on rivers’ hydrological situation. Taking the example of the Shaying River, the Jieshou hydrologic section was selected to study the influence of the sluice and all its upstream dams on the hydrologic regime. Using 55 years of measured daily flows at Jieshou hydrologic station, the hydrological date were divided into two series as pre- and post-impact periods. Based on the IHA, the range of variability in 33 flow parameters was calculated, and the hydrologic alteration associated with dams and sluices operation was quantified. Using the RVA method, hydrologic alteration at the stream gauge site was assessed to demonstrate the influence of dams on the hydrological condition. The results showed that dams have a strong influence on the regime; the river eco-hydrological targets calculated in this study can afford some support for water resources and ecosystem management of Shaying River.
Key words hydrologic regime; indicators of hydrologic alteration; range of variability approach; Shaying River
1 INTRODUCTION
River flow regimes are considered to be the primary driving force of the river ecosystem (Poff et al., 1997; Yang et al., 2012). The integrity and stability of river ecosystems is largely dependent on the natural dynamic change characteristics of the streamflow (Poff et al., 1997). The development and management of water resources by humans has altered the natural flow of rivers around the world (Richter, 1997); altered flow regimes in the river system affect water quality, energy sources, the physical habitat, and biotic interactions, resulting in damage to the ecological integrity of rivers (Suen, 2011).
To meet economic and social development needs for water resources and flood control, a large number of water conservancy projects including dams and sluices have been built along the rivers. Dams and sluices can alter the downstream flow regime by affecting total flow quantity, water quality, and the magnitude, seasonal timing, duration, and change rate of specific flow events (Hu et al., 2008; Yan, 2010; Zuo, 2012). A number of ecologically important streamflow characteristics constitute the natural flow regime, including the seasonal patterning of flows; timing of extreme flows; frequency, predictability, and duration of floods, droughts, and intermittent flows; daily, seasonal, and annual flow variability; and rates of change (Poff et al., 1997). Assessment of these streamflow characteristics is essential for understanding and predicting the biological impact of both natural and altered flow regimes on riverine biota. Accordingly, researchers have developed and applied a number of hydrologic indices to characterize different components of the flow regime. As one set of proposed hydrologic indices, the Indicators of Hydrologic Alteration (IHA) are widely used, which consider a full range of natural flow variability, including magnitude, frequency, timing, duration and change rate; the 33 parameters of IHA were categorized into five groups of hydrologic features (Richter et al., 1996). In order to determine the flow regime target with IHA, the Range of Variability Approach (RVA) was established to evaluate the hydrologic alteration caused by hydraulic control structures (Richter et al., 1997, 1998). The approach for assessing hydrologic alteration is based on the differences in the streamflow regime characteristics between two defined periods at a given stream gauge. The RVA approach provides a more quantitative way to evaluate the degree of alteration by giving a target range (e.g. the percent difference between the 25th- and 75th percentile pre-impact indicator values) for each hydrologic indicator. Current RVA applications show high degrees of alteration at locations downstream of the hydraulic control structures (Shiau and Wu, 2004; Yang et al. 2008).
Analysing the hydrologic regime and determining the reasonable ecological flow are the key issues in water resources management. By studying the influence of dams on hydrologic regime
alteration in the Shaying River, the objectives of this paper were to analyse the temporal variability in hydrologic regime through hydrological parameters of Shaying River, and quantify the hydrologic alteration associated with dam operations by comparing the hydrologic regimes of two periods.
2 STUDY AREA
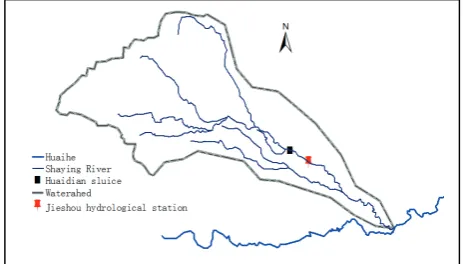
The Shaying River which has intensive dams and sluices is the study area. Belonging to the warm temperate monsoon region, Shaying River is the largest tributary of the Huaihe River in China, and lies in the area 111.95–114.03ºE, 33.07–34.42ºN. The annual average air temperature is 15.0°C, and annual average rainfall 769.5 mm. Shaying River basin has a high population density and high intensity of the economic and social activities (Zhang et al., 2013). There were few dams in the Shaying River basin before 1960, but after 1960, a large number of dams and sluices were built along the river and its tributaries. For example, large sluices at Zhoukou and Huaidian were built during this period. Jieshou hydrologic station is located on the boundary of Henan and Anhui provinces, close to the upstream of Huaidian Sluice. Considering the availability of hydrological data, Jieshou hydrologic station was selected as the control node to study the influence of the Huaidian Sluice and all its upstream dams on the hydrologic regime. The study area and location of the hydrologic station are shown in Fig. 1.
Fig. 1 Study area and the location of Jieshou hydrological station.
3 DATA AND METHOD 3.1 Data
The daily flow data were used to analyse the variation of flow regime at Jieshou hydrologic section. Using the IHA/RVA method needs more than 20 years of continuous daily flow data. We collected the observed flow data from 1956 to 2010, a total of 55 years of hydrological data, which were provided by the hydrological data management department or taken from annual hydrological reports, the effectiveness of which can be guaranteed. In this paper, the streamflow from 1956 to 2010 was divided into pre-impact period (1956–1976) and post-impact period (1977–2010), representing the streamflow under natural conditions and changeable conditions, respectively. According to the pre-impact and post-impact periods, the streamflow was investigated to address flow regime characteristics using the IHA/RVA method.
3.2 The IHA/RVA method
The IHA method was used to assess hydrologic regime alteration, including 33 ecologically relevant hydrologic parameters, and to assess hydrologic regime alteration using the parameters of the five major categories (Richter et al., 1998). The IHA method has four steps: (1) define the data series for pre- and post-impact periods; (2) calculate the values of hydrologic attributes; (3) compute inter-annual statistics, and (4) calculate the values of the IHA.
the selected percentile levels or a simple multiple of the parameter standard deviations for the natural or pre-impact hydrologic regime. The management objectives are to attain the targeted range at the same frequency as occurred in the natural or pre-impact flow regime, evaluate the effects of dams and sluices on river flow regime, and set management targets. For example, attainment of the RVA target range defined by the 25th and 75th percentile values of a particular parameter would be expected in only 50% of years. To quantify the hydrologic alteration, Richter et al. (1998) divided the ranges of hydrologic alteration into three classes of equal range: 0%–33% (L) represents little or no alteration, 34%–67% (M) represents moderate alteration, and 68%–100% (H) represents a high degree of alteration.
4 RESULTS AND DISCUSSION 4.1 Influence on the hydrologic regime
First, the mean value of 33 hydrologic parameters in the pre-impact flow data series was calculated, and the range of fluctuation of these parameters was computed. Furthermore, the mean value of those parameters in the post-impact series was calculated, and in order to find the differences both two series were compared with each other. Finally, using the 25th and 75th percentile values of the pre-impact parameters as ecohydrological targets, the deviation degree of the post-impact parameters against that of the pre-impact parameters was computed (Table 1).
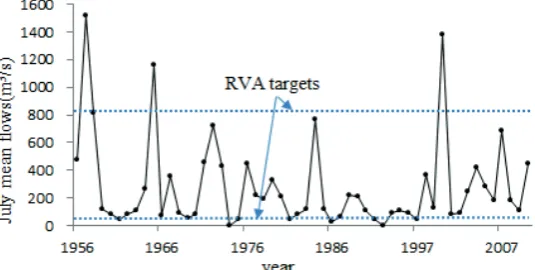
Parameters in group 1 describe the magnitude of monthly flow. In the monthly mean flow data, expect for April, May, September and December, the deviations were relatively high. The July deviation reached 83.3%, the highest degree of deviation (Fig. 2). The June, August and October deviations exceeded 33.3%, the middle degree. Means of monthly flow throughout the post-impact period indicate a decreasing trend compared with that in the pre-impact period, except in March. The decrease rate for the post-impact period ranges from 3.5% to 181.1%, indicating the lower monthly flow fluctuations in the post-impact period due to the regulation of dams and sluice operation.
Extreme events were characterized by minima and maxima of flows, zero flow days, Julian date of 1-day maximum and minimum, and high and low pulses. These parameters compromised IHA groups 2, 3 and 4.
The means of annual 1-, 3-, 7-, 30- and 90-day minimum and maximum decrease significantly between the two periods. All values in the post-impact period were smaller than the pre-impact values. For example, the annual 1-day minima flow had a decrease rate of 99.0%, the annual 1-day maxima flow had a decrease rate of 27.2, and the 1-day maxima deviation reached 72.2% (Fig. 3). Note that zero flow days, which would be expected to cause substantial mortality of aquatic organisms and threaten to alter ecological quality and continuity in the long term, increased dramatically between the pre- and post-impact periods, from 8 to 26. Results indicate that the daily, weekly, monthly and quarterly maximum/minimum flow cycles are negatively influenced by dams and sluice regulation.
Table 1 Alteration of the 33 hydrologic parameters.
Hydrologic parameters Means Mean
difference Difference rate RVA threshold Deviation % (degree)
1956–1967 1967–2010 Lower Upper
IHA Group 1
January 37.9 26.8 –11.1 –29.3 9.5 55.3 22.2(L)
February 31.2 27.7 –3.5 –11.2 3.3 51.7 22.2(L)
March 37.3 38.2 0.9 2.4 24.1 50.8 –66.7(H)
April 124.4 39.5 –84.9 –68.2 30.0 106.0 11.1(L)
May 112.8 63.4 –49.4 –43.8 37.9 104.4 –5.6(L)
June 145.0 71.8 –73.2 –50.5 10.2 172.2 61.1(M)
July 425.1 244.0 –181.1 –42.6 79.5 811.2 83.3(H)
August 369.7 237.7 –132 –35.7 44.0 401.3 55.6(M)
September 208.9 154.1 –54.8 –26.2 83.6 314.4 0.0(L)
October 153.9 116.2 –37.7 –24.5 29.3 170.0 33.3(M)
November 103.7 64.2 –39.5 –38.1 53.4 157.1 –27.8(L)
December 68.4 40.4 –28 –40.9 38.7 140.7 –12.1(L)
IHA Group 2
1-day minimum 10.1 –0.1 –10.2 –101.0 0.3 24.1 –33.3(L)
1-day maximum 1810.8 1318.8 –492 –27.2 587.0 2920.0 72.2(H)
3-day minimum 11.1 0.6 –10.5 –94.6 0.6 24.1 –33.3(M)
3-day maximum 1652.8 1169.1 –483.7 –29.3 495.0 2803.3 66.7(H)
7-day minimum 13.0 2.1 –10.9 –83.8 1.3 25.1 –22.2(L)
7-day maximum 1389.9 877.1 –512.8 –36.9 360.9 2487.1 72.2 (H)
30-day minimum 19.3 8.8 –10.5 –54.4 2.6 35.6 11.1(L)
30-day maximum 730.1 452.0 –278.1 –38.1 151.7 1287.5 72.2(H)
90-day minimum 29.2 18.5 –10.7 –36.6 4.9 52.4 38.9(M)
90-day maximum 392.6 251.7 –140.9 –35.9 97.1 637.4 72.2(H)
7-day minimum
divided 0.09 0.12 0.03 33.3 0.03 0.12 55.3(M)
Zero-flow days 8 26 18 225.0 - 0 66.1(M)
IHA Group 3
Julian date of annual
maximum 207.1 214.4 7.3 3.5 191.2 215.3 52.6(M)
Julian date of annual
minimum 132.1 78.6 –53.5 –40.5 25.2 146.2 22.2(L)
IHA Group 4
No.of high pulses 114.9 89.3 –25.6 –22.3 55.0 156.0 50.0(M)
No.of low pulses 45.3 94.8 49.5 109.3 42.0 127.0 –11.1(L)
Duration of high pulses 5.6 11.2 5.6 100.0 3.0 7.0 –66.7(H)
Duration of low pulses 1.9 6.9 5 263.2 3.0 7.0 –16.7(L)
IHA Group 5
Rise rate 1.2 31.7 30.5 2541.7 0.2 0.7 33.3(M)
Fall rate –0.1 –0.3 -0.2 200.0 –0.1 –0.1 –88.9(H)
Number of reversals 62.5 72.0 9.5 15.2 47.0 77.0 –38.9(M)
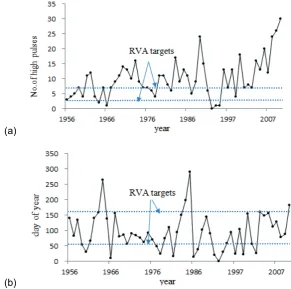
The mean Julian date of each annual 1-day maximum post-impact was later than that pre-impact, moving backs from the 207th day pre-impact to the 214th day in the post-impact period; the mean Julian date of each annual 1-day minimum moved forward from the 132th day pre-impact to the 78th day in the pre-impact period. The mean of the high pulse counts in the post-impact period was lower than in the pre-post-impact period while the low pulse counts was higher. By contrast, the duration of high and low pulses both increased; e.g. the duration of high pulses had rose from 5.6 days pre-impact period to 11.2 days in the post-impact period (Fig. 4).
(a)
(b)
Fig. 4 Variation of times (a) and duration (b) of high pulse appeared pre and post-impact.
The means of the rise rate, fall rate and number of reversals increased, while the mean difference of the rise rate and fall rate was obviously higher in the later period than in the earlier period, which indicated greater fluctuations.
4.2 Degree of hydrological alteration
As shown in Table 1, the 33rd and 67th percentiles were computed for all 33 hydrologic alteration indicators as the lower and upper limits of the RVA target range for the Jieshou station. The results show that fall rate ranked first of all hydrologic alteration values followed by July, 1-, 7-, 30-, and 90-day minimum, duration of high pulses, March, 3-day maximum, all with deviation degrees exceeding 67%. They are supposed to be strongly affected by the construction and operation of upstream dams and sluices. In practical regulation, targets should be kept from 10 to 811 m3/s for monthly flow magnitude in June, July, August, September, October and November with similar target ranges, and from 3 to 140 m3/s for the remaining six months.
5 CONCLUSIONS
(1) The annual distribution pattern of water discharge was changing during the period 1956 to 2010. Dams and sluices profoundly affect the hydrologic conditions in the Shaying River. They reduced annual peak discharges, decreased the range of daily discharges, increased the number of reversals in discharge, altered the timing of high and low flows, and changed the timing of the yearly maximum and minimum flows.
(2) Comparing with that in the pre-impact period, hydrologic features demonstrated obvious changes during the post-impact period. The flow magnitude was smaller and the frequency of low flow events increased for all the twelve months; all the maximum flows and minimum flows for 1-day, 3-day, 7-day, 30-day and 90-day reduced; the number of high pulse events presented a decreasing trend, while low pulse events appeared an increasing trend.
(3) The alteration of flow regime can bring substantial threats to wild species and consequently result in undesirable ecological effects. Therefore, it is necessary to further investigate the responses to hydrological regime alteration resulting from dam and sluice construction.
Acknowledgements This research was supported by the National Natural Science Foundation of China (No. 51279183), and the Science and Technology Project of Henan Province (No. 132102310528), and Program for Innovative Research Team (in Science and Technology) in University of Henan Province (No. 13IRTSTHN030).
REFERENCES
Hu, W, et al. (2008) The influence of dams on ecohydrological conditions in the Huaihe River basin. China. Ecological
Engineering 33, 233–241.
Richter, B D, et al. (1996) A method for assessing hydrologic alteration within ecosystems. Conservation Biology 10, 1163– 1174. Richter, B. D. (1997) How much water does a river need. Freshwater Biology 37, 231–249.
Richter, B.D., et al. (1998) A spatial assessment of hydrologic alteration within a river network. Regulated Rivers:Research &
Management. 14, 329–340.
Poff, N.L., et al. (1997)The natural flow regime: a paradigm for river conservation and restoration. Bioscience 47, 769–784. Suen, J.P. (2011) Determining the ecological flow regime for existing reservoir operation. Water Resour Manage. 25, 817–835. Yan Y., et al. (2010) Assessing effects of dam operation on flow regimes in the lower Yellow River. Procedia Environmental
Sciences 2, 507–516.
Zhang, Y.Z., et al. (2013) Concentrations, potential sources and behavior of organochlorines and phenolic endocrine-disrupting chemicals in surficial sediment of the Shaying River, eastern China. Environ Earth Sci. 70, 2237–2247.
Zuo, Q.T., et al. (2012) Climate change and its impact on water resources in the Huai River Basin. Bulletin of the Chinese
Academy of Sciences 26, 32–39.
Yang, Z.F. Yan, Y. and Liu, Q. (2012) Assessment of the flow regime alterations in the Lower Yellow River, China. Ecological