proc-iahs.net/369/7/2015/ doi:10.5194/piahs-369-7-2015
© Author(s) 2015. CC Attribution 3.0 License.
Open Access
Hydrological
Ev
ents
(JH01
–
IUGG2015)
Downscaling medium-range ensemble forecasts using a
neural network approach
M. Ohba, S. Kadokura, Y. Yoshida, D. Nohara, and Y. Toyoda
Central Research Institute of Electric Power Industry, Abiko, Japan
Correspondence to: M. Ohba ([email protected])
Received: 15 April 2015 – Accepted: 15 April 2015 – Published: 11 June 2015
Abstract. In this study, we present an application of self-organizing maps (SOMs) to downscaling weekly en-semble forecasts for probabilistic prediction of local precipitation in Japan. SOM is simultaneously employed on four elemental variables derived from the JRA55 reanalysis over area of study (Southwestern Japan), whereby a two-dimensional lattice of weather patterns (WPs) dominated during the 1958–2008 period is obtained. Down-scaling weekly ensemble forecasts to local precipitation are conducted by using the obtained SOM lattice based on the WPs of the global model ensemble forecast. A probabilistic local precipitation is easily and quickly obtained from the ensemble forecast. The predictability skill of the ensemble forecasts for the precipitation is significantly improved under the downscaling technique.
1 Introduction
Medium-range (3–10 days) ensemble forecasts can be cru-cial for reducing an impact of extreme events such as floods by increasing the capability of earlier weather warnings with more confidence than deterministic forecasts. However, in generally, spatial resolution of global models is low and therefore they are not suitable for surface variables that are of greatest relevance to users. Empirical/dynamical downscal-ing methods (e.g. Maraun et al., 2010) are often used to pro-duce output at the smaller spatial scales required by the end users. In empirical downscaling, local climate is assumed to be a function of the large-scale climatic state and physical features of the local environment. Due to the huge amount of data given in medium-range ensemble forecasts, efficient analysis and downscaling tools are required to extract use-ful features, providing more simple and manageable infor-mation. Attempts to overcome the problem of downscaling for large number of ensemble forecast, recent some studies (Gutiérrez et al., 2005) propose the usage of self-organizing map (SOM; Kohonen, 1982)-based analogue technique for precipitation downscaling of forecast. The scope of this study is to evaluate a precipitation prediction which uses at-mospheric forecasts from the JMA (Japan Meteorological Agency) Ensemble Prediction System (EPS) and verify the
ability of the SOM-based downscaling technique at forecast-ing probabilities of local precipitation for medium-range lead times.
2 Data and downscaling method
2.1 Data
WP classification by SOM
Precipitation estimation for each node from Daily local rainfall
(APHRODITE) Average
AGCM weekly forecast
Local rainfall forecast
51-ensembles 2day 51-ensembles 7day … e=1 e=51 … 1day e=1 e=51 … 2day e=1 … 7day … e=51 input output 51-ensembles 1day JRA-55 (1958-2008)
4 atm. variables
θ850 Z300
U850 V850
Probability
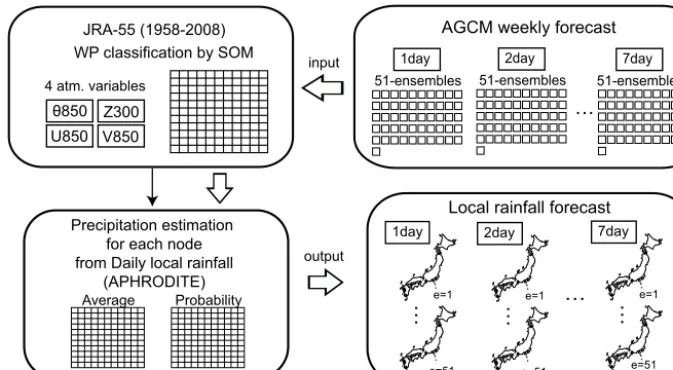
Figure 1.Schematic diagram of the SOM-based downscaling method.
2.2 SOM technique
We apply SOM for clustering a space of daily weather pat-terns (WPs) over the western Japan during the period 1958– 2008 and linking it to the local precipitation. We use the four input fields of standardized anomalies for each day that are concatenated into a vector as input vector of SOM. Each of the arrays on the SOM is denoted as a node, which has one reference vector. SOM classifies input data into a two-dimensional plane utilizing similarities with the extracted patterns (reference vectors) on the map (e.g. Hewitson and Crane, 2002; Ohba et al., 2015). In this study, we use torus-SOM that has no difference of neighborhood sets and no edge in map. The SOM map adopted in this study consists of 20×20 neurons (i.e. 400 WPs). We selected four observed variables as input for SOM: 850 hPa equivalent-potential temperature (θe), zonal and meridional wind and 300 hPa
geopotential height (GH) anomalies. Anomalies were iden-tified by removing a mean climatological cycle and normal-ized with respect to each variable. For each SOM node, we also take the subset of the related daily precipitation to esti-mate the mean local precipitation and develop a precipitation PDF for each SOM node.
2.3 Rainfall downscaling method based on SOM
The schematic diagram of the algorithm of downscaling tech-nique is represented in Fig. 1. Based on the link between the SOM derived WPs (represented by a reference vector) and related local precipitation, we obtain a forecast for a daily precipitation prediction from the EPS. This is an alternative to conventional analogue techniques (e.g. Lorenz, 1963). We take the same atmospheric window (region) and variables that we used to train the SOM and extract these from the EPS. Each WP of the ensemble forecast is assigned to its winner node, according to its distance from the reference vectors.
Thus, the search of WP is conducted in the space of reference vectors which reducing significantly the computational cost compared with the conventional analogue method. For each season (JJ and AS), 51 forecast patterns are daily available. The composited PDF of the local forecast is finally obtained from the PDF which is assigning the local precipitation to each node and each of the grids. The locations of the precip-itation data grid cells define the locations of the downscal-ing targets. This downscaldownscal-ing technique is applied to western Japan for early and late summer, respectively.
3 Rainfall downscaling of weekly ensemble forecast
Figure 2 shows the precipitation for observation (left panel), and downscaled precipitation (center panel) and raw precip-itation (right panel) of ensemble mean of EPS for the mean of forecast one day during August–September 2011. As ex-pected, because of the relatively low spatial resolution of the EPS, the precipitation response in the EPS raw cannot cap-ture both the spatial distribution and intensity of local precip-itations. However, by using the SOM-based empirical down-scaling, the predicted precipitation relatively well captures the overall features found in the observed precipitation.
Daily precipitation (2011 AS mean)
ensemble mean ensemble mean
1.25°
mm/day
Figure 2.(a) Daily mean precipitation (mm day−1) for observed, downscaled EPS (ensemble mean), 60 km EPS raw (ensemble mean).
EPS(raw)
mean
Obs.
Precipitation (mm/day)
(b) Daily-mean precipitation (northern Kyushu region)
Forecast days
1- 2- 3- 4- 5- 6- 7-(a) Ensemble Frequency (19 July 2009)
real
Fd1 Fd2 Fd3 Fd4 Fd5
Fd6 Fd7
95% 75% 25% 5% DS pr
Figure 3.(a) SOM frequency (best matched) of the 51-ensemble members on the SOM lattice for the forecast day 1–7. Solid black box
represents the actual state. (b) Daily-mean precipitation obtained from the downscaling for the forecast day 1–7. The spread of the ensemble for GSM raw is presented by orange box. The node-mean downscaled precipitation and its ensemble mean are represented by black×mark and horizontal bar, respectively. Composited PDFs of downscaled precipitation obtained from the SOM are represented by red error bar. Observational precipitation (actual state) is represented by the gray bar.
state (except for forecast day 4). This analysis provides an effective way to visually grasp the broadening of ensembles. We also show the daily-mean precipitation averaged over the northern Kyushu region for this case (Fig. 3b), obtained from the precipitation downscaling of ensemble forecast. Or-ange error bars represent the ensemble spread of the raw pre-cipitation output obtained from the EPS, while the red er-ror bars with box plots represent the PDF obtained from the downscaling. By using the downscaling of precipitation, the precipitation of EPS is significantly improved. In the first and second day of the period, the PDF and mean of down-scaled precipitations are almost agrees with the observational result. While the precipitation for the 4-day forecast is sig-nificantly overestimated, it may be comes from the failure to capture the actual WP. However, the signal of atmosphere which can potentially bring a heavy precipitation is relatively well captured by the downscaled EPS, implying that it would be worthwhile to use the information at the medium-range. As for the second half of the period, the empirical
downscal-ing relatively well capture the high-risk of heavy rainfall in some extent, while not in EPS direct rainfall. Since the en-semble forecast extend gradually, the PDF get up close to the climatological PDF.
Figure 4.(a) Daily-mean precipitation obtained from the downscaling for the forecast day 1, 3, 5 and 7 during June–July. Composited
PDFs of downscaled precipitation obtained from the SOM are represented by red error bar. The node-mean downscaled precipitation and its ensemble mean are represented by blue dots and horizontal bars, respectively. Observational precipitation (actual state) is represented by the gray bar. (b) ROC curves for the forecast days 1–7 for the precipitation of EPS raw and SOM downscaling during June–July at the periods 2009–2011.
forecast day 3–5, that in the forecast day 7 is almost similar through the days.
This downscaling technique can also be evaluated in prob-abilistic form, computing the probability of exceeding a given threshold. A standard verification methodology for probabilistic forecasting is relative operating characteristics (ROCs). The derivation of ROCs is based on contingency tables for the number of observed occurrences and non-occurrences of an event as a function of the forecast occur-rences and non-occuroccur-rences. In order to check the skill of the downscaled forecasts for different lead times, we show the ROC curves obtained for the period 2009–2011 (Fig. 4b). As expected, the precipitations in the EPS direct output has basi-cally no predictability skill. However, the predictability skill of the precipitation is significantly improved by the down-scaling. Again, the prediction skill is gradually decreased with respect to the increase of the forecast days.
4 Conclusions
The methodology presented in this study offers an inex-pensive solution that may be quickly employed with a broad range of multi-model ensemble forecast outputs while we use the single model EPS. We will try the use of the multi-model data in the future study and the application of multi-model medium-range forecasts in different sectors, such as dam-management, hydroelectric power generation, and disaster prevention.
References
Ebita, A., Kobayashi, S., Ota, Y., Moriya, M., Kumabe, R., Onogi, K., Harada, Y., Yasui, S., Miyaoka, K., Takahashi, K., Kama-hori, H., Kobayashi, C., Endo, H., Soma, M., Oikawa, Y., and Ishimizu, T.: The Japanese 55-year Reanalysis “JRA-55”: an interim report, Scientific Online Letters on the Atmosphere, 7, 149–152, 2011.
Gutiérrez, J. M., Cofiño, A. S., Cano, R., and Sordo, C.: Analysis and downscaling multi-model seasonal forecasts in Perú using self-organizing maps, Tellus A, 57, 435–447, 2005.
Hewitson, B. C. and Crane, R. G.: Self-organizing maps: applica-tions to synoptic climatology, Clim. Res., 22, 13–26, 2002. Kamiguchi, K., Arakawa, O., Kitoh, A., Yatagai, A., Hamada,
A., and Yasutomi, N.: Development of APHRO_JP, the first Japanese high-resolution daily precipitation product for more than 100 years, Hydrolog. Res. Lett., 4, 60–64, 2010.
Kohonen, T.: Self-organized formation of topologically correct fea-ture maps, Biol. Cybernet., 43, 59–69, 1982.
Lorenz, E. N.: Deterministic nonperiodic flow, J. Atmos. Sci., 20, 130–141, 1963.
Maraun, D., Wetterhall, F., Ireson, A. M., Chandler, R. E., Kendon, E. J., Widmann, M., Brienen, S., Rust, H. W., Sauter, T., The-meßl, M., Venema, V. K. C., Chun, K. P., Goodess, C. M., Jones, R. G., Onof, C., Vrac, M., and Thiele-Eich, I.: Precipita-tion downscaling under climate change. Recent developments to bridge the gap between dynamical models and the end user, Rev. Geophys., 48, RG3003, doi:10.1029/2009RG000314, 2010. Ohba, M., Nohara, D., Yoshida, Y., Kadokura, S., and Toyoda, Y.: