Sediment Dynamics from the Summit to the Sea
(Proceedings of a symposium held in New Orleans, Louisiana, USA, 11–14 December 2014) (IAHS Publ. 367, 2014).
391
Tidal modulated flow and sediment flux through Wax Lake
Delta distributary channels: Implications for delta development
KEVIN HANEGAN & IOANNIS GEORGIOU
University of New Orleans, Department of Earth and Environmental Sciences, 2000 Lakeshore Drive, 1065 GP, New Orleans, Louisiana 70148, USA
Abstract In this study, a Delft3D model of the Wax Lake Delta was developed to simulate flow and sediment flux through delta distributary channels. The model was calibrated for tidal constituents as well as velocity and sediment concentration across channel transects. The calibrated model was then used to simulate full spring–neap tidal cycles under constant low flow upstream boundary conditions, with grain size variation in suspended load represented using two sediment fractions. Flow and sediment flux results through distributary channel cross-sections were examined for spatial and temporal variability with the goal of characterizing the role of tides in sediment reworking and delta development. The Wax Lake Delta has prograded through channel extension, river mouth bar deposition, and channel bifurcation. Here we show that tidal modulation of currents influences suspended sand transport, and spatial acceleration through distributary channels at low tides is sufficient to suspend sand in distal reaches during lower flows. The basinward-increasing transport capacity in distributary channels indicates that erosive channel extension could be an important process, even during non-flood events.
Key words Wax Lake Delta; tidal-modulation; delta distributary channels; erosion
INTRODUCTION
Since the beginning of its subaerial development after the 1973 flood, the Wax Lake Delta (WLD) has prograded into the Atchafalaya Bay receiving basin in the northern Gulf of Mexico through seaward channel extension, subaqueous mouth bar formation, and channel bifurcation, building substantial new land area in the form of sandy delta lobe deposits (Roberts, 1998). With sediment supplied to the receiving basin through the constructed Wax Lake Outlet (WLO) channel, the WLD is frequently cited as a natural analogue for the land-building potential of large sediment diversions from the Mississippi River (Kim et al., 2008, 2009; Paola et al., 2011; Parker & Sequeiros, 2006).
According to delta classification systems based on the relative strengths of fluvial and marine processes (Galloway, 1975), the WLD has traditionally been described as river-dominant due to the high water and sediment discharge and low wave energy, micro-tidal conditions of Atchafalaya Bay (Olariu & Bhattacharya, 2006). Sediment and flow inputs to the delta are highly seasonal (Roberts
et al., 1997), contributing to pronounced sub-aerial land gain during large floods. These sediment deposits are further stabilized by vegetation colonization, increasing resistance to erosion from storms (Carle et al., 2013; Rosen & Xu, 2013). Morphological development of the delta has frequently been modelled using flood-dominant assumptions, where all bathymetric change occurs during a parameterized high discharge event and delta development occurs only through deposition (Parker & Sequeiros, 2006). Recent work by Shaw & Mohrig (2013) has challenged conceptual delta development models of the WLD that emphasize progradation through deposition only during flood periods. From a series of bathymetric surveys conducted during 2010–2012, they document erosive channel extension at the most distal portion of a WLD distributary channel during low flow conditions and point to tidal modulation of flow velocities as the causative mechanism (Shaw & Mohrig, 2013). The present study examines the hydrodynamics and sediment transport within the WLD during low flows in greater detail to both corroborate the findings of Shaw & Mohrig (2013) and gain greater insight into the potential sediment reworking in deltas during non-flood events. We present results from a calibrated Delft3D model developed to simulate flow and sediment flux through delta distributary channels under varying discharge and tidal conditions, and examine the potential for erosive channel extension based on the spatial and temporal variability of flow and transport results.
METHODS Delft3D
Delft3D (Lesser et al., 2004) is a modelling suite with the capability to simulate hydrodynamics, sediment transport, and resulting changes to bed levels (i.e. erosion/deposition) and bed sediment composition. The Delft3D-FLOW module integrates the computation of hydrodynamics, sediment transport, and morphology in a simultaneous, “online” approach where changes to bathymetry in one time step are immediately available to calculate hydrodynamics in the next time step (Lesser et al., 2004). Hydrodynamics are simulated by solving the unsteady shallow water equations using finite-difference methods on a curvilinear grid. Since density stratification and other three-dimensional effects are not significant in the WLD, the depth-averaged mode is implemented for the current study. The sediment transport module computes both bed load and suspended load transport for non-cohesive sediment fractions, and suspended load transport for cohesive sediment fractions. Suspended transport for both cohesive and non-cohesive sediment is executed by solving the advection-diffusion equation. The erosion and deposition of suspended cohesive sediment are calculated using the Partheniades-Krone method, and transport of non-cohesive sediment is calculated using the formulations of van Rijn (Partheniades, 1965; van Rijn, 1993).
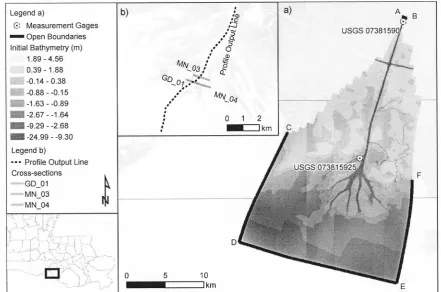
Fig. 1 (a) Wax Lake Delta Delft3D model domain and initial bathymetry. Model open boundaries are indicated by thick black lines. Line A–B is the upstream flow boundary. Line D–E is the offshore water level boundary, forced with astronomical constituents that vary linearly along the boundary. The lateral boundaries at lines C–D and E–F are assigned Neumann conditions where the water surface gradient along the boundaries is equal to zero. Locations of USGS flow and water level measurement gauges used in model development and calibration are also shown. (b) Locations of sediment flux transects (labelled MN_03, GD_01, and MN_04) and streamwise profile output line within Wax Lake Delta model. Flux through the transects is shown in Fig. 3, and various quantities along the profile output line are plotted in Fig. 4
Model development
grid resolution varies between elongated cells of approximately 50 m by 20 m near the upstream boundary and square cells of approximately 20 m by 20 m within the WLD. The bathymetry data for the model was interpolated to this high resolution grid from hydrographic surveys (US Army Corps of Engineers, 1999) and is able to resolve the primary distributary channels of the delta. Figure 1 gives the location of the model domain, the initial bathymetry, and open boundaries. The upstream flow boundary (line A–B in Fig. 1) was defined at the USGS flow, sediment, and water level gauge 07381590 at Calumet (US Geological Survey, 2014). The offshore water level boundary (line D–E in Fig. 1) was forced with tidal constituents that varied linearly along the boundary length. Constituent phases and amplitudes at the southeast and southwest corners of the domain were extracted from tidal databases (Mukai et al., 2002). At the lateral water level boundaries (lines C–D and E–F), Neumann conditions were imposed, setting the constant alongshore water level gradients equal to zero for the duration of the simulation. Since the focus of this study is aimed at specific responses to tidal fluctuations, meteorological forcings were not included in the model, although we recognize that wind stress and other remote forcings could further modify sub-tidal water level fluctuations (Roberts et al., 2005).
The suspended sediment and bed sediment grain size distributions were schematized using two sediment fractions. Each of these represent a range of coarse and fine sediment portions of the inflowing sediment load and the preserved depositional sequences. Analysis of suspended sediment load and bedload samples taken during the low flow and flood condition field campaigns of DuMars (2002) indicates that grain sizes range from very fine sand to coarse silt with a small clay fraction, and bed sediment vibra-cores throughout the delta suggested a similar bed material grain size distribution (DuMars, 2002; Wellner et al., 2005). Based on this field information, the coarser sediments were approximated by a single, very fine sand fraction with a median diameter (d50) of
100 μm, and all fine sediment was represented by a single cohesive mud fraction.
The bed sediment distribution was initially defined to be both vertically and horizontally homogenous composed of a uniform mixture of 70% fine sand and 30% mud fractions to match the observed bulk sand retention in the WLD (Roberts et al., 1997). A more realistic distribution was then obtained by updating the bed surface composition (without updating bed elevation) during a steady state simulation of high flows, where erosive sorting increased the proportion of find sand within the WLO and delta distributary channels. This sorted bed sediment distribution was then used as an initial condition in subsequent simulations.
Model calibration
To realistically simulate the sediment transport patterns within the WLD, the model was calibrated for tidal constituent amplitudes, channel-averaged velocities, and suspended sediment concentrations. Water level measurements were available at two gauging stations within the model domain (see Fig. 1 for their locations). A simulation was run for an approximately two month period in spring 2003, because this was the earliest period for which the necessary measurements were available. Because the model bathymetry was based on surveys performed in 1998, the tidal calibration period needed to be as early as possible to minimize discrepancies between calculated and measured values due to ongoing delta development. Water level timeseries were extracted from the model results at the two gauge locations, and measured water level timeseries were obtained for the same period. Both observed and simulated tidal constituents were calculated using harmonic analysis (Pawlowicz et al., 2002). Normalized amplitude errors between measured and calculated amplitudes for the dominant constituents are given for the two stations in Table 1. At both gauges, the highest amplitude diurnal constituents (O1 and K1) are reproduced by the model very well; however, greater discrepancies exist for the lower amplitude semi-diurnal components (M2 and S2). With normalized amplitude errors of less than 10% for the highest amplitude constituents, the model acceptably reproduces the tidal hydrodynamics within the WLD.
Table 1 Tidal constituent calibration results at water level gauge locations.
Station O1 η
(m) amp. ε O1 norm. K1(m) η K1 amp.norm. ε (m)M2 η M2 amp. ε norm. S2(m) η S2 amp. ε norm. USGS
07381590 0.039 –8% 0.036 4% 0.020 –33% 0.001 –43%
USGS
073815925 0.069 –8% 0.064 3% 0.050 –59% 0.017 –28 %
η, measured constituent amplitude; norm. amp. ε, normalized error between measured and calculated constituent amplitudes
profiles which were subsequently depth-averaged. For comparison with measured values, a steady-state model was set up with a constant discharge and offshore water level conditions (Hanegan, 2011). Depth-averaged velocity magnitude and suspended sediment concentrations at each grid point along the measurement transects were extracted from model results and averaged across the transect width for comparison. The Manning roughness values, critical erosion and deposition parameters for cohesive sediment, and calibration factors in the Van Rijn non-cohesive sediment transport formulations were adjusted to minimize the average difference between measured and calculated values. Table 2 gives the normalized error between measured and calculated channel averaged velocity and suspended sediment concentrations. While velocity is generally reproduced quite well, there is a slight under-prediction of sediment concentrations at most transects; however, the normalized error is still low and considered acceptable for sediment transport modelling.
Table 2 Velocity and suspended sediment concentration calibration at selected transects from DuMars (2002) measurements.
Transect cs_8 cs_15 cs_17 cs_18 cs_21
V norm. ε –10% 19% 1% 10% –9%
C norm. ε 1% –24% –26% –16% –21%
V norm. ε, normalized error between measured and calculated channel-averaged velocity magnitudes; C norm. ε, normalized error between measured and calculated channel-averaged suspended sediment concentrations
Tidal simulations
After achieving good calibration for both hydrodynamics and sediment transport, the model was then used to simulate full spring–neap tidal cycles with several representative constant upstream flow boundary conditions. Based on frequency calculations of the 24 year discharge record at the upstream flow boundary, the four flows were chosen to correspond to the five-year return period flood, two-year return period flood, annual flood, and a representative low flow condition (Q =1149.7 m3/s) with an 82% probability of exceedence. While model simulations with higher
flows produced interesting results for investigating the distribution of flow and sediment across symmetrical and asymmetrical bifurcations, this paper focuses particularly on results during low flow conditions.
RESULTS AND DISCUSSION
Sand flux through delta distributary channels
Fig. 2 Spatial distribution of sand sediment flux through WLD distributary channels at two instances during the simulation: (a) shows the sand sediment flux distribution at a low spring tide, and (b) the distribution at a rising spring tide. The position in the tidal cycle shown in (a) and (b) are denoted by the thick black lines in (c).
the most-distal ends of the channels, erosive channel extension can occur under low flow, spring-tide conditions. Conversely, sand transport during the rising spring-tide (Fig. 2(b)) completely ceases.
The sand flux variation with the tidal cycle is even more evident in Fig. 3, showing total sand flux variation through time at cross-sections directly upstream and downstream of an approximately
symmetrical channel bifurcation (the cross-section locations are shown in Fig. 1(b)). Across the full tidal cycle, the flux through the cross-section MN_03 upstream of the bifurcation is much lower than the flux through the downstream cross-sections (GD_01 and MN_04), further demonstrating the downstream-increasing flux trends within each distributary channel. The flux through the downstream cross-sections peaks during each spring low tide and ceases during the rising, high tide, and falling portions of the tide. Additionally, the low-tide peaks gradually diminish to zero as the tide cycles from spring to neap. At this particular bifurcation, sand transport is only active during the spring low tides, and the lack of sediment input from upstream of the bifurcation ensures that channel erosion will occur during these periods.
Backwater flow profiles
To gain insight into the mechanisms of the downstream-increasing sediment flux and resulting erosive channel extension during low flows, the spatial and temporal variation of hydrodynamic and sediment transport parameters were investigated along a streamwise profile line extending from the delta apex through the full length of the Gadwall pass distributary channel (location in Fig. 1). Figure 4 shows the variation of bed elevation (a), water level (b), depth-averaged velocity magnitude (c), bottom shear stress magnitude (d), and depth-averaged suspended sand concentration (f) along the channel at two points in the spring–neap tidal cycle.
The bed elevation profile begins in the very deep (approximately –15 m) Wax Lake Outlet channel near the delta apex then rises sharply to depths of less than 5 m at the start of the major bifurcations of the delta approx. 2000 m downstream. Within this distributary channel reach, the bed has a mild adverse slope through the delta, ending with the slight rise of an incipient mouth bar deposit. For the low tide profile, the water surface experiences drawdown towards the lowered water surface in the receiving basin with a convex, A2-type backwater profile. This results in flow acceleration towards the distributary mouth, indicated by the rising velocity in Fig. 4(c). Coupled with gradually decreasing depths, the spatial flow acceleration results in heightened bed shear stress (Fig. 4(d)) which is sufficient to erode the sand sediment fraction from the bed, as indicated by the increasing, non-zero sand concentration in the channel beginning approximately 6000 m down-stream of the apex (Fig. 4(e)).
During the rising tide, the water surface profile is approximately horizontal and accompanied by a gradual deceleration of velocity magnitude from the WLO through the delta front. Bottom shear stress is similarly reduced, and is insufficient to entrain the fine sand from the bed. Figure 4(e) clearly shows the effect of tidal fluctuations on sand transport at the distal ends of delta distributary channels. During low spring tides, the spatial acceleration of flow due to drawdown of the backwater profile entrains sand in suspension; during rising tides, no drawdown of the water surface profile through the delta occurs, and suspended sand concentrations are negligible.
Flow acceleration and accompanying bed erosion have been observed near the mouth of the Mississippi River, but were attributed to drawdown-induced backwater flow dynamics when high river flow discharges as a spreading plume into the static water level of the receiving basin (Lamb
et al., 2012). Our results show that similar dynamics occur in the WLD but can be controlled by drawdown of the basin water levels at low tides during low flow periods.
CONCLUSIONS
The modelling results show that fine sand can still be mobilized in WLD distributary channels during low flows due to tidal effects. During the simulation of a spring–neap cycle, episodic, basinward-increasing sand sediment flux was observed throughout the delta. Time series of total sand flux through several distributary channel transects confirm that sand is mobilized during low spring tides when the receiving basin water levels are at their lowest. Additionally, flux upstream of selected bifurcations is much lower than flux downstream of the bifurcations, confirming that sand entrainment occurs in the distal portions of channels. Stream-wise profiles of hydrodynamic and transport results through the delta along the Gadwall Pass distributary channel show an A2-type drawdown backwater profile where spatial acceleration of the flow occurs near the channel terminus. Despite the relatively-low upstream flow, this acceleration augments the bed shear stress so that fine sand is entrained in suspension. With negligible sand input from the upstream WLO, elevated suspended sand concentrations near the distributary channel terminus indicate bed erosion. Over longer time scales, this erosion will aid in delta progradation through erosive channel extension and can rework sediments deposited in the delta during flood periods.
REFERENCES
Carle, M. V., Sasser, C. E. & Roberts, H. H. (2013) Accretion and vegetation community change in the Wax Lake Delta following the
DuMars, A. J. (2002) Distributary Mouth Bar Formation and Channel Bifurcation in the Wax Lake Delta, Atchafalaya Bay, Louisiana. MSc Thesis. Department of Geology and Geophysics, Louisiana State University, Baton Rouge, Louisiana.
Galloway, W. E. (1975) Process framework for describing the morphologic and stratigraphic evolution of deltaic depositional systems.
In: M. L. Broussard (ed.), Deltas, Models for Exploration (87–98). Houston Geological Society.
Hanegan, K. C. (2011) Modeling the Evolution of the Wax Lake Delta in Atchafalaya Bay, Louisiana. MSc Thesis. Delft University of
Technology, Delft, the Netherlands. Retrieved from http://repository.tudelft.nl/view/ir/uuid:e3463391-244f-45ee-b216-b0778c1b10c4/.
Kim, W., et al. (2008) Land building in the delta of the Mississippi River: Is it feasible?, Chapter 10. In: R. R. Twilley (ed.) Coastal
Louisiana Ecosystem Assessment & Restoration (CLEAR) Program: A tool to support coastal restoration. Volume IV. Final Report to Department of Natural Resources, Coastal Restoration Division, Baton Rouge, LA. Contract No. 2512-06-02.
Kim, W., et al. (2009) Is it feasible to build new land in the Mississippi River Delta? Eos, Transactions American Geophysical Union
90(42), 373–374. doi:10.1029/2009EO420001
Lamb, M. P., et al. (2012) Backwater and river plume controls on scour upstream of river mouths: Implications for fluvio-deltaic
morphodynamics. Journal of Geophysical Research: Earth Surface (2003--2012), 117(F1).
Lesser, G. R., et al. (2004). Development and validation of a three-dimensional morphological model. Coastal Engineering 51(8),
883–915.
Mukai, A. Y., et al. (2002) Eastcoast 2001: A tidal constituent database for the western North Atlantic, Gulf of Mexico and Caribbean
Sea. Coastal and Hydraulics Laboratory Tech. Rep. ERDC. US Army Corps of Engineers, ERDC/CHL TR-02-24, 25.
Olariu, C. & Bhattacharya, J. P. (2006) Terminal distributary channels and delta front architecture of river-dominated delta systems.
Journal of Sedimentary Research 76(2), 212–233. doi:10.2110/jsr.2006.026.
Paola, C., et al. (2011) Natural processes in delta restoration: application to the Mississippi Delta. Annual Review of Marine Science 3,
67–91. doi:10.1146/annurev-marine-120709-142856.
Parker, G. & Sequeiros, O. (2006) Large scale river morphodynamics: application to the Mississippi Delta. In: Proceedings, River Flow
2006 Conference, Lisbon, Portugal, Sept. 6-8, 2006.
Partheniades, E. (1965) Erosion and deposition of cohesive soils. Journal of the Hydraulics Division, ASCE 91(1), 105–139.
Pawlowicz, R., Beardsley, B. & Lentz, S. (2002) Classical tidal harmonic analysis including error estimates in MATLAB using T_TIDE.
Computers & Geosciences 28(8), 929–937.
Roberts, H. H. (1998) Delta switching: early responses to the Atchafalaya River Diversion. Journal of Coastal Research 14(3),
882–899.
Roberts, H. H., et al. (1997) Evolution of sedimentary architecture and surface morphology: Atchafalaya and Wax Lake Deltas, Louisiana
(1973–1994). Gulf Coast Association of Geological Societies Transactions XLVII, 8.
Roberts, H. H., et al. (2005) Effects of cold fronts on bayhead delta development: Atchafalaya Bay, Louisiana, USA. In: D. M. FitzGerald
& J. Knight (eds.) High Resolution Morphodynamics and Sedimentary Evolution of Estuaries (vol. 8, 269–298). Springer
Netherlands. doi:10.1007/1-4020-3296-x_13
Rosen, T. & Xu, Y. J. (2013) Recent decadal growth of the Atchafalaya River Delta complex: Effects of variable riverine sediment input
and vegetation succession. Geomorphology 194, 108–120.
Shaw, J. B. & Mohrig, D. (2013) The importance of erosion in distributary channel network growth, Wax Lake Delta, Louisiana, USA.
Geology 42(1), 31–34. doi:10.1130/G34751.1
US Army Corps of Engineers (1999) Atchafalaya River hydrographic survey, 1998–1999: Old River to Atchafalaya Bay including main
channel and distributaries. New Orleans, LA: US Army Corps of Engineers, New Orleans District.
US Geological Survey (2014) USGS Water Data for USA. National Water Information System: Web Interface. Retrieved March 07, 2014,
from http://waterdata.usgs.gov/nwis
Van Rijn, L. C. (1993) Principles of Sediment Transport in Rivers, Estuaries and Coastal Seas. Aqua publications Amsterdam.
Wellner, R., et al. (2005) Jet-plume depositional bodies—the primary building blocks of Wax Lake Delta. Gulf Coast Association of