Eurasian Journal of Business and Economics 2014, 7 (14), 71-90.
DOI: 10.17015/ejbe.2014.014.05
The Effects of Credibility on Interest Rates in
Turkey
M. Kadir DOĞAN
*, Gülcan BOZDEMİR
**Abstract
Credibility is crucial for managing inflation expectations in countries adopting inflation targeting. This study focuses on measurement of credibility and its relation with the interest rates. It aims to determine which measures of credibility best predict the variations of interest rates by using monthly data from Turkey in 2004−2012 period which adopted infla#on targe#ng in 2002. Nine credibility indices are considered in the analysis. We find empirical evidence supporting the claim that higher credibility will lead to lower variations in interest rates of both monetary policy and the market. We also demonstrated that CICK (proposed by Cecchetti and
Krause, 2002) is the best credibility index in explaining the variations in both monetary policy interest rate and market interest rate.
Keywords: Credibility, Central Banking, Inflation Targeting, Inflation Expectations, Dynamic Inconsistency
JEL Code Classification: E42, E52, E58
* Assistant Professor, Ankara University, Faculty of Political Sciences, Department of Economics, Turkey.
1.
Introduction
Dynamic inconsistency problem in monetary policy arises if the policymakers are unable to commit to a policy rule. The dynamic inconsistency literature initiated by Kydland and Prescott (1977) and Barro and Gordon (1983) indicates that policymaking under commitment can lead to substantially better outcome than policymaking under discretion. This literature indicates that the absence of commitment in monetary policy is the main factor in the persistence of high inflation. Therefore, several countries began to adopt inflation targeting starting from early 1990s in order to reduce inflation and achieve price stability.
The main objective in the adoption of inflation targeting is to create an environment where inflation expectations converge to inflation target. Credibility of monetary authority is therefore crucial to manage the inflation expectations in inflation targeting regimes. Higher credibility will lead to lower disinflation costs.
The aim of this paper is to determine which measures of credibility best predict the variations of interest rates in Turkey. For this objective we used monthly data from Turkey between January 2004 and January 2012. Turkey adopted inflation targeting informally in 2002 and formally in 2006 in order to stabilize the price changes.
Nine credibility indices are evaluated in this paper as a measure of the credibility. CICK is proposed by Cecchetti and Krause (2002), CIM is proposed by de Mendonça (2007), CIA is introduced by de Mendonça and Souza (2009), CIRC is introduced by Nahon and Meuer (2009). CICVE and CICVX are proposed in this paper. These indices measure the credibility by considering the deviation of the expected inflation from the inflation target. The last three credibility indices discussed in this paper (CIAR, CIWR, CIMAR) are based on the reputation (past performance) of the monetary authority. The relationship between variation in interest rate and variation in credibility indices is analyzed. Two different interest rates are used in the analysis: monetary policy interest rate which is mainly determined by the central bank and market interest rate.
We provide empirical evidence supporting the claim that higher credibility will lead to lower variations in interest rates of both monetary policy and the market. We also show that CICK is the best credibility index in explaining the variations in both policy rate and market interest rate in Turkey.
The outline of the paper is as follows. Credibility measurement and credibility indices are discussed in section 2. Section 3 describes the data and application of the credibility indices for Turkey. Section 4 explains the empirical analysis and section 5 concludes.
2. Credibility Measurement
perception of credibility is a subjective and qualitative concept, it can be quantified through two different approaches: credibility creation and credibility impact approaches.
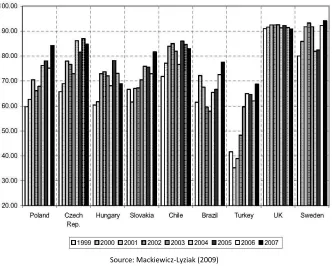
Credibility creation approach is a quantification of the determinants of credibility suggested in literature such as transparency, independence of central bank, accountability, history of honesty, past inflation performance, effectiveness in achievement of announced monetary policy targets, good governance, country risk and public debt. Mackiewicz-Lyziak (2009) calculates the credibility index for nine countries in the period between 1999 and 2007. This credibility index takes a value between 0 and 100, where 0 means no credibility and 100 means full credibility. It consists of seven sub-indices. Each sub-index is based one of the above-mentioned determinants of credibility. Index values were compiled for nine countries which are shown in Figure 1.
Source: Mackiewicz-Lyziak (2009)
Figure 1. Index Values for Nine Countries
expectations. Inflation expectations may differ depending on the analyzed cohort of the agents.
Nahon and Meurer (2009) have used the credibility impact approach to measure the credibility of Brazilian Central Bank under inflation targeting program during the years 2000-2005. They used three indices formerly defined by Cecchetti and Krause (2002), Sicsu (2002), de Mendonça (2004) and proposed two more indices. de Mendonça and Souza (2009) have also measured the credibility of Brazilian Central Bank by using six credibility indices where three of them are based on the reputation of the central bank.
In this study, we mainly use the credibility impact approach to measure the credibility of the Central Bank of Turkey between 2004 and 2012. We describe the credibility indices used in the study in the next sub-section.
2.1. Credibility Indices
Following Agenor and Taylor (1993) and Svenson (2000) credibility changes inversely with the distance between inflation expectation (E(π))and inflation target (π). Thus the credibility indices based on credibility impact approach should represent this relation. Our first credibility index (CICK) is proposed by Cecchetti and Krause (2002). This credibility index takes the values between 0 and 1, assuming full credibility when it is equal to 1.
CI =
1 if E π ≤π
1 −0.2 −1 π E π −π if π < π < 0.2
0 if E π ≥ 0.2
The index is equal to 1 if the expected inflation is lower or equal to the inflation target. It decreases linearly while the expected inflation departs from the inflation target and gets the value of 0 if the expected inflation exceeds 20%. In this index it is assumed that if the expected inflation exceeds %20, then the central bank loses the control of inflation and thus has no credibility.
The second credibility index (CIM) is proposed by de Mendonça (2007) which considers the tolerance limits together with the inflation target. It is computed by the following formula where πmin and πmax represent for the lower and upper bounds of inflation target respectively.
CI =
1 if E π =π
1 −π 1−π |E π −π| if π "#≤ E π ≤π
This index equals to 1 if the expected inflation is equal to inflation target and equals to 0 if the expected inflation is either lower than the lower bound inflation target or greater than the upper bound inflation target. If the expected inflation is in tolerance interval, it decreases linearly while the expected inflation differs from the inflation target.
The third credibility index (CIA) is proposed by de Mendonça and Souza (2009) which assumes that the central bank has full credibility while the expected inflation is in tolerance interval.
CI'=
1 if π "#≤ E π ≤π
1 −0.2 −1π E π −π if π < π < 0.2
1 −−π1 "#(E π −π "#) if 0 < π <π "#
0 if E π ≥ 0.2 or E π ≤ 0
CIA takes the value of 1 if the expected inflation is in tolerance interval. It takes the value of zero if the expected inflation is either greater than 20% or less than zero. Otherwise, it decreases linearly while expected inflation departs from tolerance interval and takes a value in the (0,1) interval.
The forth credibility index (CIRC) is suggested by Nahon and Meuer (2009) which assumes that the central bank has full credibility while the expected inflation is lower than the upper bound of inflation target.
CI* = +
π
E π if E π >π
1 if E π ≤π
CIRC is equal to 1 if the expected inflation is less than upper bound of the inflation target and decreases while expected inflation departs from the upper bound of the inflation target and takes value in the (0,1) interval. It converges to zero while the expected inflation goes to infinite.
CI ,-= +1 − .
E π −π
π −π/
0
if π "#≤ E π ≤π
0 otherwise
CI ,6= 71 − 8
E π −π
π −π if π
"#≤ E π ≤π
0 otherwise
In case of a deviation of expected inflation from inflation target, CICVX will cause a higher credibility loss than CIM, whereas CICVE will cause a lower credibility loss than CIM.
Credibility creation approach considers the deviation of the expected inflation from the inflation target. de Mendonça (2007) pointed out that credibility is synonymous with reputation in economies where credibility is still being built. Consequently, de Mendonça and Souza (2009) proposed an alternative method for measuring credibility by using the reputation instead of expectations. Note that reputation is earned due to the past performance of the central bank whereas credibility is gained based on agents’ expectations. However, past performance of the central bank can be effective in the formation of expectations and thus reputation can be used in measuring the credibility. In order to build credibility indices based on reputation, we use the reputation index (R) proposed by de Mendonça and Souza (2009).
R =
1 if π "#≤π:;<≤π
1 −0.2 −1π π:;<−π if π <π:;<< 0.2
1 −−π1 "#(E π −π "#) if 0 <π:;<<π "#
0 if π:;<≥ 0.2 or π:;<≤ 0
The reputation index is similar to CIA where expected inflation is replaced with observed inflation (πOBS). Reputation index takes the value of 1 if the observed inflation is in the tolerance interval and takes the value of 0 if the observed inflation is less than zero or higher than 20%. Otherwise it is in (0,1) interval and decreases linearly while the observed inflation departs from tolerance limits.
Based on the reputation index three credibility indices (CIAR, CIWR, CIMAR) are established as follows.
=>
?@A=
∑ C
DEF A DGFH
; =>
J@A=
∑ K. C
DEF A
DGF
∑ K
ADGF
; =>
L?@A
=
∑
AEFDGAEF0C
Dt
AR
CI is the average reputation at time t (R0 is equal to initial reputation). t WR
CI is the weighted average reputation at time t where the given weight increases while the
time approaches to the current period. So t WR
CI gives more weights to the
reputation of recent periods. t MAR
CI is the moving average reputation at time t where the lag is chosen as 12. It is simply the average of the reputations of the last twelve periods.
The first six credibility indices and the reputation index are illustrated in Figure 2.
3.
Credibility Measurement in Turkey
3.1. Data and Assumptions
The data used in the analysis were taken from Under secretariat of Treasury, Central Bank of Republic of Turkey (CBRT) and Istanbul Stock Exchange Markets. The data are in monthly frequencies and belong to the period between January 2004 and January 2012.
Expected inflation has taken from CBRT public surveys comprehending both financial sector and households answers. Even though the data of expected inflation are available for years 2001-2003, the results of CBRT public surveys to determine the expected inflation are not very efficient for this period (Kara and Küçük-Tuğer, 2010). We therefore do not use the data for years 2001-2003 in the analysis.
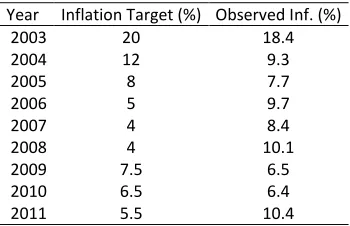
Inflation targets and observed inflation rates for the years 2003-2011 are given in Table 1. As inflation targets are decided annually, we transform the end year targets to monthly frequency by using linear interpolation method highlighted in the part “inflation path descriptions consistent with the end-year target and the uncertainty band” under CBRT’s monetary policy papers.
Table 1. Inflation Targets and Observed Inflation Rates
Year Inflation Target (%) Observed Inf. (%)
2003 20 18.4
2004 12 9.3
2005 8 7.7
2006 5 9.7
2007 4 8.4
2008 4 10.1
2009 7.5 6.5
2010 6.5 6.4
CICK
0
E(π)
πt 0.2
1
CIM
0
E(π)
πt
πtmin πtmax
1
CIA
0
E(π)
πt 0.2
πtmin πtmax
1 CICVE
0
E(π)
πt
πtmin πtmax
1
CIRC
0
E(π)
πt πtmax
1
CICVX
0
E(π)
πt
πtmin πtmax
1
x
R(reputation)
0
πOBS
πt 0.2
πtmin πtmax
1
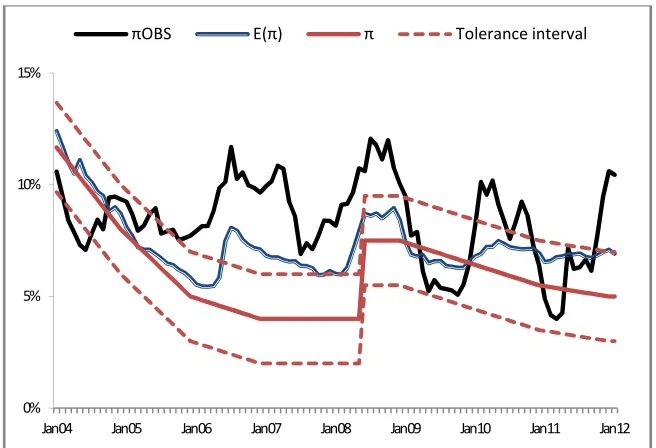
Those policy papers have been prepared in advance at the beginning of each year and shared with public for the years 2002-2011.1 As there was an implicit implementation of inflation targeting program before 2006, those monetary and exchange rate policy papers didn’t include inflation paths before that time. Thus, we have assumed that CBRT’s policy preference to decrease the inflation to the target levels would be the same before 2006. Moreover, there is no monetary explanation of inflation paths shared with public for 2010 and 2011 as the difference between the inflation targets for those years are small to describe. It is assumed that monetary paths were not parallel with the seasonal price changes generally observed in Turkish economy. However, as CBRT would declare to follow a linear decreasing path for the belonging years we thought that it is meaningful to follow this path for the years in concern. There may be some critics to CBRT’s approach. But, a smooth declining path towards the announced target is also an accepted way in inflation targeting literature. Inflation target, expected inflation, observed inflation and the tolerance interval between January 2004 and January 2012 is given in Figure 3.
As it can be seen in Figure 3, expected inflation is usually higher than inflation target in Turkey (exceptions: March-April 2004, March 2005, February-November 2009). On the other hand, expected inflation is usually in the tolerance interval (exceptions: June 2006-September 2007, Dec 2007-January 2008, March-May 2008 and December 2011). Observed inflation is higher than the upper bound of the tolerance interval in July 2005, September 2005-January 2009, February-June 2010, August-October 2010 and October 2011-January 2012.
For the policy rate we have used overnight CBRT’s interest rate which is also published according to the annually cumulated monthly data. Overnight interest rate was used as policy rate until November 2010 by CBRT. However, they began to use weekly REPO interest rates since December 2010. Thus, we have also included this change in our data set.
For the market interest rate, we have used the average interest rate of the indicator treasury bond that was exchanged mostly in each day by transforming those daily frequencies into annually cumulated monthly averages.
Moreover, since the CBRT accepted the inflation target regime formally in 2006 (there was an implicit inflation targeting regime between the years 2002-2006), CBRT did not explicitly accept an interval for inflation target before 2006 which is necessary to calculate most of the indices. Beginning from the year 2006, as CBRT accepted the inflation target regime formally, we have chosen the declared tolerance limits for the target as (-2,+2). We have also used the same tolerance limits for the years 2004-2005.
1
Figure 3. Inflation Target, Expected Inflation, Observed Inflation and the
Tolerance Interval
It is also important to mention that CBRT has revised the inflation targets in June 2008 (see Figure 3). Before the revision inflation targets were 4% for both 2009 and 2010. In June 2008 the inflation target was updated as 7.5% for 2009 and 6.5% for 2010. Thus, we have employed the updated inflation targets beginning from June 2008. We should also note that we omitted the data for the June 2008 from the analysis.
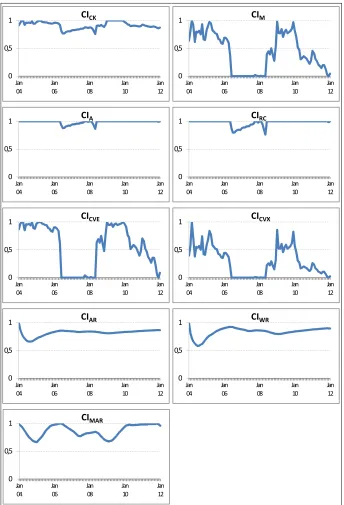
3.2. Application of Credibility Indices for Turkey
The credibility indices are computed for Turkey between January 2004 and January 2012. The paths of credibility indices are given in Figure 4. CICK takes values in [0.758,1] interval with an average of 0.914. It reaches to its minimum in May 2008.
The paths of CIA and CIRC are similar since the expected inflation is never less than the lower bound of the inflation target. The values of CIA are in [0.866,1] interval with an average of 0.987 and the values of CIRC are in [0.761,1] interval with an average of 0.975. Both indices get their minimum values in May 2008.
0% 5% 10% 15%
Jan 04 Jan 05 Jan 06 Jan 07 Jan 08 Jan 09 Jan 10 Jan 11 Jan 12
CICVE, CIM, and CICVX takes values in [0,1] interval with averages of 0.563, 0.433 and 0.293 respectively. They are equal to zero when the expected inflation is outside the tolerance limits by their settings. Thus they are equal to zero in June 2006-September 2007, December 2007-January 2008, March-May 2008 and December 2011. These indices differ from each other due to different losses in credibility when the expected inflation is in tolerance interval but deviates from the target. In case of a deviation from inflation target, the credibility loss in CICVE will be lower compared to CIM and the credibility loss in CIM will be lower compared to CICVX. Thus, the graph of CICVX path is below the graph of CIM path and the latter is below the graph of CICVE path.
The difference among the credibility indices based on reputation (CIAR, CIWR and CIMAR) is the weight given to the reputation in the previous periods. CIAR gives equals weights to previous reputations while CIWR gives more weights to recent reputations. Thus, even though they have similar paths, the path of CIAR is smoother than the path of CIWR. The average of CIAR is equal to 0.821 and a bit lower than the average of CIWR which is equal to 0.835. Both indices take their minimum values in July 2004 (0.660 for CIAR and 0.581 for CIWR).
2
The path of CIMAR exhibits more variations compared to the paths of CIAR and CIWR since it only considers the reputations in the last year (the last twelve periods). The average of CIMAR is equal to 0.867, which takes the minimum value (0.663) in January 2005 and the maximum value (1.000) in May 2006.
4. Empirical Analysis
As the credibility of the central bank increases, its ability to affect the public expectation is also increases. Thus, it is expected that change in the interest rates will be inversely related to the credibility of the central bank. We analyze the relation between credibility indices and the interest rate. Two different interest rates are used in the analysis. First one is the policy rate which is mainly determined by the central bank and the second one is market interest rate which is the average interest rate of the indicator treasury bond.
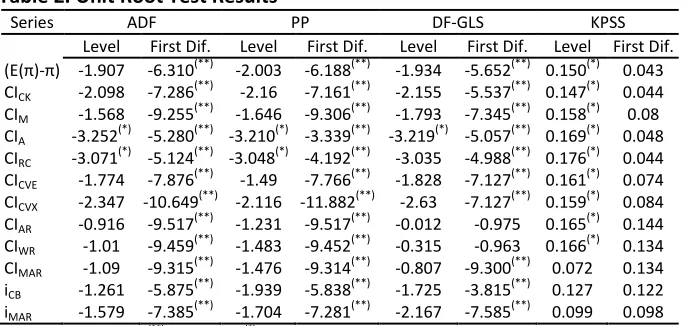
In the first step of empirical analysis, unit root tests have been carried out for all of the variables. Augmented Dickey–Fuller (ADF), Philips–Perron(PP), Dickey-Fuller GLS (DF–GLS) and Kwiatkowski–Phillips–Schmidt–Shin (KPSS) tests are held and the results are shown in Table 2.
According to ADF and PP tests, all the series are non-stationary at level but stationary at first differences at %1 significance level. However, CIA and CIRC series
2
Note that the observed inflation in December 2003 is in the tolerance interval, so the reputation index takes the value of 1 for that month. The values of CIAR and CIWR are therefore equal to 1 in the first
are stationary at level according to these tests at %5 significance level. On the other hand, KPPS test confirms that CIA and CIRC series are not stationary at level at %5 significance level.3 We treated all the series in the analysis as I(1).
If the credibility indices cause changes in interest rates, then we will observe that changes in credibility indices will precede changes in interest rates.
Table 2. Unit Root Test Results
Series ADF PP DF-GLS KPSS
Level First Dif. Level First Dif. Level First Dif. Level First Dif. (E(π)-π) -1.907 -6.310(**) -2.003 -6.188(**) -1.934 -5.652(**) 0.150(*) 0.043 CICK -2.098 -7.286
(**)
-2.16 -7.161(**) -2.155 -5.537(**) 0.147(*) 0.044 CIM -1.568 -9.255
(**)
-1.646 -9.306(**) -1.793 -7.345(**) 0.158(*) 0.08 CIA -3.252
(*)
-5.280(**) -3.210(*) -3.339(**) -3.219(*) -5.057(**) 0.169(*) 0.048 CIRC -3.071
(*)
-5.124(**) -3.048(*) -4.192(**) -3.035 -4.988(**) 0.176(*) 0.044 CICVE -1.774 -7.876
(**)
-1.49 -7.766(**) -1.828 -7.127(**) 0.161(*) 0.074 CICVX -2.347 -10.649
(**)
-2.116 -11.882(**) -2.63 -7.127(**) 0.159(*) 0.084 CIAR -0.916 -9.517
(**)
-1.231 -9.517(**) -0.012 -0.975 0.165(*) 0.144 CIWR -1.01 -9.459
(**)
-1.483 -9.452(**) -0.315 -0.963 0.166(*) 0.134 CIMAR -1.09 -9.315
(**)
-1.476 -9.314(**) -0.807 -9.300(**) 0.072 0.134 iCB -1.261 -5.875
(**)
-1.939 -5.838(**) -1.725 -3.815(**) 0.127 0.122 iMAR -1.579 -7.385
(**)
-1.704 -7.281(**) -2.167 -7.585(**) 0.099 0.098 Statistical significance: (**) at %1 level, (*) at %5 level.
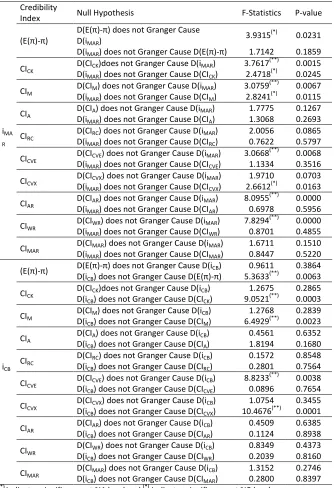
To formally analyze the precedence in the movements of credibility indices and interest rates, pair wise Granger causality tests were conducted (see the results in Table 3). Test results shows that D(CICK), D(CIM), D(CICVE) and D(CIWR) Granger causes D(iMAR) at %1 significance level and D(E(π)-π) Granger causes D(iMAR) at %5 significance level. On the other hand, the unique credible index whose movements precede the variations in the policy rate is CICVE which is first proposed in this paper. D(CICVE) Granger causes D(iCB) at %1 significance level.
There is also some evidence of causality from variation in interest rate to changes in credibility for both market and monetary policy interest rates. D(iMAR) Granger causes to D(CICK), D(CIM), D(CICVX ) at %5 significance level. D(iCB) Granger causes to D(E(π)-π), D(CICK), D(CIM), D(CICVX) at %1 significance level.
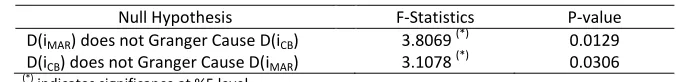
These results show that changes in monetary policy and the market interest rates precede the variations in the credibility. We performed pairwise Granger causality tests to examine the precedence in the variations market interest rate and policy rate (see Table 4 for the results). It shows that there is bicausality between them.
3
Table 3. Granger Causality Test Results
CredibilityIndex Null Hypothesis F-Statistics P-value
iMA R
(E(π)-π)
D(E(π)-π) does not Granger Cause D(iMAR)
3.9315(*) 0.0231 D(iMAR) does not Granger Cause D(E(π)-π) 1.7142 0.1859 CICK
D(CICK)does not Granger Cause D(iMAR) 3.7617 (**)
0.0015 D(iMAR) does not Granger Cause D(CICK) 2.4718
(*)
0.0245 CIM
D(CIM) does not Granger Cause D(iMAR) 3.0759 (**)
0.0067 D(iMAR) does not Granger Cause D(CIM) 2.8241
(*)
0.0115 CIA
D(CIA) does not Granger Cause D(iMAR) 1.7775 0.1267 D(iMAR) does not Granger Cause D(CIA) 1.3068 0.2693 CIRC
D(CIRC) does not Granger Cause D(iMAR) 2.0056 0.0865 D(iMAR) does not Granger Cause D(CIRC) 0.7622 0.5797 CICVE
D(CICVE) does not Granger Cause D(iMAR) 3.0668 (**)
0.0068 D(iMAR) does not Granger Cause D(CICVE) 1.1334 0.3516 CICVX
D(CICVX) does not Granger Cause D(iMAR) 1.9710 0.0703 D(iMAR) does not Granger Cause D(CICVX) 2.6612
(*)
0.0163 CIAR
D(CIAR) does not Granger Cause D(iMAR) 8.0955 (**)
0.0000 D(iMAR) does not Granger Cause D(CIAR) 0.6978 0.5956 CIWR
D(CIWR) does not Granger Cause D(iMAR) 7.8294 (**)
0.0000 D(iMAR) does not Granger Cause D(CIWR) 0.8701 0.4855 CIMAR
D(CIMAR) does not Granger Cause D(iMAR) 1.6711 0.1510 D(iMAR) does not Granger Cause D(CIMAR) 0.8447 0.5220
iCB
(E(π)-π) D(E(π)-π) does not Granger Cause D(iCB) 0.9611 0.3864 D(iCB) does not Granger Cause D(E(π)-π) 5.3633
(**)
0.0063 CICK
D(CICK)does not Granger Cause D(iCB) 1.2675 0.2865 D(iCB) does not Granger Cause D(CICK) 9.0521
(**)
0.0003 CIM
D(CIM) does not Granger Cause D(iCB) 1.2768 0.2839 D(iCB) does not Granger Cause D(CIM) 6.4929
(**)
0.0023 CIA
D(CIA) does not Granger Cause D(iCB) 0.4561 0.6352 D(iCB) does not Granger Cause D(CIA) 1.8194 0.1680 CIRC
D(CIRC) does not Granger Cause D(iCB) 0.1572 0.8548 D(iCB) does not Granger Cause D(CIRC) 0.2801 0.7564 CICVE
D(CICVE) does not Granger Cause D(iCB) 8.8233 (**)
0.0038 D(iCB) does not Granger Cause D(CICVE) 0.0896 0.7654 CICVX
D(CICVX) does not Granger Cause D(iCB) 1.0754 0.3455 D(iCB) does not Granger Cause D(CICVX) 10.4676
(**)
0.0001 CIAR
D(CIAR) does not Granger Cause D(iCB) 0.4509 0.6385 D(iCB) does not Granger Cause D(CIAR) 0.1124 0.8938 CIWR
D(CIWR) does not Granger Cause D(iCB) 0.8349 0.4373 D(iCB) does not Granger Cause D(CIWR) 0.2039 0.8160 CIMAR
D(CIMAR) does not Granger Cause D(iCB) 1.3152 0.2746 D(iCB) does not Granger Cause D(CIMAR) 0.2800 0.8397 (**)
Table 4. Granger Causality Test Results for the Interest Rates
Null Hypothesis F-Statistics P-value
D(iMAR) does not Granger Cause D(iCB) 3.8069 (*)
0.0129 D(iCB) does not Granger Cause D(iMAR) 3.1078
(*)
0.0306
(*) indicates significance at %5 level.
We also analyze the empirical relation between credibility indices and the market interest rate and the empirical relation between credibility indices and the policy rate. In general we make multiple regressions on the following models as proposed in de Mendonça and Souza (2009).
∆>CNOA = PQD+ PFD∆ AEF S − SAEF + P0D∆=DA+ TD (1)
∆>CL?@A = PQD+ PFD∆>CAEFL?@+ P0D∆=DA+ TD (2)
The first model (eq. 1) expresses the variations in policy rate by using the changes in credibility indices. The difference between expected inflation and target inflation in the previous period is used as control variable in the model. If the variations in policy rate would decrease while credibility is increasing, then an increase in a credibility index should reduce the variations in policy rate. We therefore expect negative and statistical significance coefficients for credibility indices in the estimation of the first model.
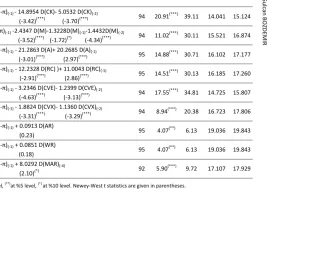
For each credibility index we choose the appropriate model by using Akaike and Schwarz information criteria.4 Estimation results for the variations in policy rate are given in Table 5.5 In the estimation of the variation in policy rate, two models (for CIAR and CIWR) are significant at %5 level and the rest of the models are significant at %1 level.
By comparing the models in terms of adjusted R2, we see that the best credibility index is CICK which accounts for the 39.11% of the variation in D(iCB). The control variable (lag of difference between expected inflation and inflation target) accounts for only %7.12 of the variation in D(iCB). Following CICK, the highest adjusted R
2
values are as follows. CICVE: 34.81%, CIA: 30.71%, CIRC: 30.13%, CIM: 30.11%, CICVX: 20.38%. The models for other credibility indices have adjusted R2 values lower than %10. In addition to having the highest explanatory power, the model for CICK has the lowest Akaike and Schwarz information criteria values (1.5521 and 1.6874, respectively) among all models. Thus, we can say that CICK is the best credibility index in explaining the variations in policy rate.
4
Statistical tests for heteroskedasticity, serial correlation, model misspecification and structural break are given in the Appendix.
. K a d ir D O G A N & G u lc a n B O Z D E M IR g e | 86 E JB E 2014, 7
Table 5. Estimation of D(i
CB)
Estimation of D(iCB)
SIC 19.365 15.124 16.874 17.177 17.260 15.807 17.806 19.843 19.843 17.929 AIC 18.828 14.041 15.521 16.102 16.185 14.725 16.723 19.036 19.036 17.107 Adj.R2 (%) 7.12 39.11 30.11 30.71 30.13 34.81 20.38 6.13 6.13 9.72 F-stat. 8.21(***) 20.91(***) 11.02(***) 14.88(***) 14.51(***) 17.55(***) 8.94(***) 4.07(**) 4.07(**) 5.90(***) N 95 94 94 95 95 94 94 95 95 92
Dependent variable: D(iCB)
Estimated Coefficients with Newey−West test staXsXcs
-0.2156+ 0.4153 D(E(π)-π)(-1)
(-2.58)(**) (1.22)
-0.2282+ 0.0921 D(E(π)-π)(-1) - 14.8954 D(CK)- 5.0532 D(CK)(-2)
(-3.71)(***) (0.48) (-3.42)(***) (-3.70)(***)
-0.2383- 0.1160D(E(π)-π)(-1) -2.4347 D(M)-1.3228D(M)(-1)-1.4432D(M)(-2)
(-3.66)(***) (-0.51) (-3.52)(***) (-1.72)(*) (-4.34)(***)
-0.2538+ 0.8673 D(E(π)-π)(-1) - 21.2863 D(A)+ 20.2685 D(A)(-1)
(-3.63)(***) (2.54)(**) (-3.01)(***) (2.97)(***)
-0.2522+ 0.8620 D(E(π)-π)(-1) - 12.2328 D(RC) )+ 11.0043 D(RC)(-1)
(-3.64)(***) (2.51)(**) (-2.91)(***) (2.86)(***)
-0.2528+ 0.1166 D(E(π)-π)(-1) - 3.2346 D(CVE)- 1.2399 D(CVE)(-2)
(-3.70)(***) (0.48) (-4.63)(***) (-3.13)(***)
-0.2163+ 0.2264 D(E(π)-π)(-1) - 1.8824 D(CVX)- 1.1360 D(CVX)(-2)
(-3.01)(***) (0.76) (-3.31)(***) (-3.29)(***)
-0.2147+ 0.4152 D(E(π)-π)(-1) + 0.0913 D(AR)
(-2.54)(**) (1.21) (0.23)
-0.2147+ 0.4149 D(E(π)-π)(-1) + 0.0851 D(WR)
(-2.54) (**) (1.21) (0.18)
-0.1857+ 0.2218 D(E(π)-π)(-1) + 8.0292 D(MAR)(-4)
T h e E ff e ct s o f C re d ib ili ty o n In te re st R a te s i n T E JB E 2014, 7 (14 ) P a g
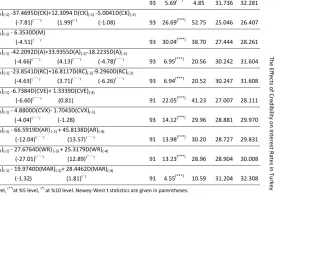
Table 6. Estimation of D(i
MAR)
Estimation of D(iMAR)
SIC 32.281 26.407 28.261 31.604 31.608 28.111 29.970 29.831 30.008 AIC 31.736 25.046 27.444 30.242 30.247 27.007 28.881 28.727 28.904 Adj.R2 (%) 4.85 52.75 38.70 20.56 20.52 41.23 29.96 30.20 28.96 F-stat. 5.69(**) 26.69(***) 30.04(***) 6.95(***) 6.94(***) 22.05(***) 14.12(***) 13.98(***) 13.23(***) N 93 93 93 93 93 91 93 91 91
Dependent variable: D(iMAR)
Estimated Coefficients with Newey−West test staXsXcs
-0.2156+ 0.4153 D(E(π)-π)(-1)
(-2.58)(**) (1.22)
-0.2006+ 0.1970D(iMAR)(-1) -37.4695D(CK)+12.3094 D(CK)(-1) -5.0041D(CK)(-2)
(-2.28)(**) (2.08)(**) (-7.81)(***) (1.99)(*) (-1.08)
-0.2227+ 0.1725D(iMAR)(-1) - 6.3530D(M)
(-2.61)(**) (2.49)(**) (-4.51)(***)
-0.1421+ 0.2055D(iMAR)(-1) -42.2092D(A)+33.9355D(A)(-2)-18.2235D(A)(-2)
(-1.41) (2.10)(**) (-4.66)(***) (4.13)(***) (-4.78)(***)
-0.1462+ 0.2044D(iMAR)(-1) -23.8541D(RC)+16.8117D(RC)(-2)-9.2960D(RC)(-2)
(-1.48) (2.07)(**) (-4.63)(***) (3.71)(***) (-6.26)(***)
-0.2464+ 0.1360D(iMAR)(-1) -6.7384D(CVE)+ 1.3339D(CVE)(-4)
(-2.36)(**) (2.05)(**) (-6.60)(***) (0.81)
-0.2026+ 0.1240D(iMAR)(-1) - 4.8800D(CVX)- 1.7043D(CVX)(-1)
(-2.08)(**) (1.14) (-4.04)(***) (-1.28)
-0.0363+ 0.2833D(iMAR)(-1) - 66.5919D(AR) (-2) + 45.8138D(AR)(-4)
(-0.37) (4.07)(***) (-12.04)(***) (13.57)(***)
-0.0948+ 0.3172D(iMAR)(-1) - 27.6764D(WR) (-3) + 25.3179D(WR)(-4)
(-0.97) (4.91)(***) (-27.01)(***) (12.89)(***)
-0.1143+ 0.1781D(iMAR)(-1) - 19.9740D(MAR)(-2)+ 28.4462D(MAR)(-4)
Note that the credibility indices based on reputation (CIAR, CIWR, CIMAR) has no power in explaining the D(iCB). These credibility indices have positive coefficients contrary to our expectation. Moreover, the adjusted R2 values of the models of CIAR and CIWR are even lower than the model with pure control variable (E(π)- π) (-1)).
The second model (eq. 2) explains the variations in market interest rate by using the changes in credibility indices. The variation in market interest rate in the previous period is included in the model as control variable. If the variations in market interest rates move inversely with changes in credibility, then an increase in a credibility index should reduce the variations in market interest rates.
We therefore expect negative and statistical significance coefficients for credibility indices in the estimation of the second model.
We select the appropriate model by using Akaike and Schwarz information criteria for each credibility index. Estimation results for the variations in policy rate are shown in Table 6.6
In the estimation of the variation in market interest rate, all of the models with credibility indices are statistically significant at %1 level. By comparing the models in terms of adjusted R2, it is seen that the best credibility index is CICK which explains the 52.75% of the variation in the D(iMAR). Note that only %4.85 of the variation in D(IRM) is explained by control variable (lag of itself). Following CICK, the highest adjusted R2 values are as follows. CICVE: 41.23%, CIM: 38.70%, CIAR: 30.20%, CICVX: 29.96%, CIWR: 28.96%. Other credibility indices have adjusted R
2
values lower than %21.
In addition to having the highest explanatory power, the model for CICK has the lowest Akaike and Schwarz information criteria values (2.5046 and 2.6407, respectively) among all models. Thus, we can say that CICK is the best credibility index in explaining the variations in market interest rate.
6. Conclusion
Credibility of the monetary authority is a crucial indicator that can promise the consistency of the policy decision. It decreases the cost of disinflation under inflation targeting regimes. The measurement of credibility is therefore important for the analysis of countries adopting inflation targeting. This study evaluates nine credibility indices to measure the credibility of central bank of Turkey between January 2004 and January 2012. Six of these indices are based on the deviation of inflation expectation from the inflation target and the rest are based on the reputation (past performance) of the central bank.
6
We provide empirical evidence supporting the claim that higher credibility will lead to lower variations in interest rates of both monetary policy and the market. Moreover, we showed that CICK (proposed by Cecchetti and Krause, 2002) is the best credibility index in explaining the variations both in policy rate and market interest rate in Turkish case.
References
Agénor, P. & Taylor, M.P. (1993) “Analysing credibility in high-inflation countries: a new approach.” Economic Journal 103: 329−36.
http://dx.doi.org/10.2307/2234771
Barro R.B. & Gordon, D.B. (1983) “Rules, Discretion, and Reputation in a Model of Monetary Policy.” Journal of Monetary Economics 12: 101−20.
http://dx.doi.org/10.1016/0304-3932(83)90051-X
Cecchetti, S.G. & Krause, S. (2002) “Central bank structure, policy efficiency and macroeconomic performance: exploring empirical relationships.” Federal Reserve Bank of St. Louis Review July/August: 47–60.
de Mendonça, H.F. (2004) “Mensurando a Credibilidade do Regime de Metas Inflacionárias no Brasil.” Revista de Economia Política 24: 344−50.
de Mendonça, H.F. (2007) “Towards credibility from inflation targeting: the Brazilian
experience.” Applied Economics 39: 2599−615.
http://dx.doi.org/10.1080/00036840600707324
de Mendonça, H.F. & Souza, G.J. (2009) “Inflation targeting credibility and reputation: The consequences for the interest rate.” Economic Modelling 26: 1228−38. http://dx.doi.org/10.1016/j.econmod.2009.05.010
Faust J. & Svensson L.E.O. (2001) “Transparency and Credibility: Monetary Policy With Unobservable Goals.” International Economic Review 42: 369–97. http://dx.doi.org/10.1111/1468-2354.00114
Kara, H. & Kucuk-Tuğer, H. (2010) “Inflation expectations in Turkey: learning to be rational.” Applied Economics 42: 2725−42.
http://dx.doi.org/10.1080/00036840801964559
Kydland, F.E. & Prescott, E.C. (1977) “Rules Rather Than Discretion: The Inconsistency of Optimal Plans.” Journal of Political Economy 85:473−92.
http://dx.doi.org/10.1086/260580
Mackiewicz-Lyziak, J. (2009) “Central bank credibility: determinants and measurement. A cross-country study”, SMYE Spring Meeting, Istanbul, Turkey.
Nahon, B. F. & Meuer, R. (2009) “Measuring Brazilian Central Bank Credibility Under Inflation Targeting.” International Research Journal of Finance and Economics 27: 72−81.
Sicsú, J. (2002) “Expectativas Inflacionárias no Regime de Metas de Inflação: uma análise preliminar do caso brasileiro.” Economia Aplicada 6: 703−11.
Appendix: Statistical Tests for the Models.
Statistical tests for Models Explaining the Variations in Policy Rate
Dependent variable: D(iCB)
Tests White
Heteroskedasticity
Breusch-Godfrey LM Ramsey RESET
Chow Break.- 2008:06
Index Estimated Model
F-statistic Obs. R-squared F-statistic Obs. R-squared F-statistic Likeliho od ratio F-statistic Log likeli-hood ratio
− -0.2156+ 0.4153 D(E(π)-π)(-1)
5.155 (***) 9.573 (***) 8.588 (***) 15.084 (***) 9.401 (***) 9.243 (***) 3.513 (**)
7.066 (**)
CK -0.2282+ 0.0921 D(E(π)-π)(-1) - 14.8954 D(CK)- 5.0532 D(CK)(-2)
1.846 (*) 15.520 (*) 4.421 (**) 8.582 (**)
1.392 1.459 0.791 3.397
M -0.2383- 0.1160D(E(π)-π)(-1)
-2.4347D(M)-1.3228D(M)(-1)-1.4432D(M)(-2)
2.774 (***) 30.977 (***) 3.970 (**) 7.862 (**)
0.363 0.387 1.338 7.202
A -0.2538+ 0.8673 D(E(π)-π)(-1) - 21.2863 D(A)+ 20.2685 D(A)(-1)
0.888 8.167 4.637
(**) 8.965 (**) 3.497 (*) 3.622 (*)
0.486 2.099
RC -0.2522+ 0.8620 D(E(π)-π)(-1) - 12.2328
D(RC)+ 11.0043 D(RC)(-1)
0.766 7.124 4.537
(**) 8.790 (**) 2.836 (*) 2.948 (*)
0.63 2.712
CVE -0.2528+ 0.1166 D(E(π)-π)(-1) - 3.2346
D(CVE)- 1.2399 D(CVE)(-2)
2.605 (**) 20.510 (**) 3.600 (**) 7.109 (**)
2.179 2.274 1.973 8.254
(*)
CVX -0.2163+ 0.2264 D(E(π)-π)(-1) - 1.8824 D(CVX)- 1.1360 D(CVX)(-2)
1.856
(*)
15.592
(*)
4.58 8.862 0.224 0.236 1.749 7.35
AR -0.2147+ 0.4152 D(E(π)-π)(-1) + 0.0913 D(AR)
2.490 (**) 11.660 (**) 8.505 (***) 15.100 (***) 9.138 (***) 9.090 (***) 2.911 (**) 8.892 (**)
WR -0.2147+ 0.4149 D(E(π)-π)(-1) + 0.0851 D(WR) 2.555 (**) 11.926 (**) 8.524 (***) 15.130 (***) 9.073 (***) 9.029 (***) 2.536 (*) 7.792 (*)
MAR -0.1857+ 0.2218 D(E(π)-π)(-1) + 8.0292
D(MAR)(-4)
1.791 8.678 8.717
(***)
15.358
(***)
0.11 0.115 2.923
(**)
8.934 (**)
Statistical significance: (***) at %1 level, (**)at %5 level, (*) at %10 level.
Statistical Tests for Models Explaining the Variations in Market Interest Rate
Dependent variable: D(iMAR)
Tests White
Heteroskedasticity
Breusch-Godfrey LM Ramsey RESET
Chow Break.- 2008:06
Index Estimated Model
F-statistic Obs. R-squared F-statistic Obs. R-squared F-statistic Likeliho od ratio F-statistic Log. likeli- hood ratio
− -0.1258+ 0.2441D(iMAR)(-1)
0.173 0.355 6.316
(***)
11.559
(***)
2.156 2.201 0.199 0.415
CK -0.2006+ 0.1970D(iMAR)(-1) - 37.4695D(CK)+ 12.3094 D(CK)(-1)- 5.0041D(CK)(-2)
4.067
(***)
39.244
(***)
2.104 4.339 2.372 2.502 1.549 8.295
M -0.2227+ 0.1725D(iMAR)(-1) - 6.3530D(M)
6.880
(***)
26.352
(***)
1.937 3.921 6.019 6.086 4.348
(***)
12.994
(***)
A -0.1421+ 0.2055D(iMAR)(-1) - 42.2092D(A)+ 33.9355D(A)(-2)-18.2235D(A)(-2)
0.074 1.224 2.732(*) 5.556(*) 1.432 1.519 0.371 2.056
RC -0.1462+ 0.2044D(iMAR)(-1) -23.8541D(RC)+
16.8117D(RC)(-2)- 9.2960D(RC)(-2)
0.081 1.328 2.878
(*)
5.833
(*)
1.158 1.23 0.343 1.902
CVE -0.2464+ 0.1360D(iMAR)(-1) - 6.7384D(CVE)+
1.3339D(CVE)(-4)
8.774
(***)
44.920
(***)
1.633 3.367 1.439 1.51 1.339 5.691
CVX -0.2026+ 0.1240D(iMAR)(-1) - 4.8800D(CVX)- 1.7043D(CVX)(-1)
2.984
(***)
22.734
(***)
2.437(*) 4.933 (*)
7.078
(***)
7.194
(***)
1.833 7.694
AR -0.0363+ 0.2833D(iMAR)(-1) - 66.5919D(AR)(-2)
+ 45.8138D(AR)(-4)
0.206 2.036 5.589
(***)
10.576
(***)
0.657 0.693 1.653 6.975
WR -0.0948+ 0.3172D(iMAR)(-1) - 27.6764D(WR) (-3) + 25.3179D(WR)(-4)
0.193 1.913 6.493
(***)
12.059
(***)
0.038 0.041 0.981 4.202
MAR -0.1143+ 0.1781D(iMAR)(-1) - 19.9740D(MAR)(-2)+ 28.4462D(MAR)(-4)
2.013 (**) 16.635 (*) 3.303 (**) 6.563 (**)
0.247 0.261 0.288 1.254