Improving HPV Vaccination
Rates Using
Maintenance-of-Certification Requirements
Alexander G. Fiks, MD, MSCE,a,b,c,d,e Xianqun Luan, MS,f Stephanie L. Mayne, MHSc,daThe Pediatric Research Consortium (PeRC), bDepartment
of Biomedical and Health Informatics, cCenter for Pediatric
Clinical Effectiveness (CPCE), dPolicyLab, and fOffi ce of
Clinical Quality Improvement, The Children’s Hospital of Philadelphia, Philadelphia, Pennsylvania; and eDepartment
of Pediatrics, Perelman School of Medicine, University of Pennsylvania, Philadelphia, Pennsylvania
Dr Fiks contributed to the conception and design of the study and drafted the manuscript; Dr Fiks and Mr Luan contributed to the acquisition of data; Ms Mayne contributed to drafting the manuscript; Dr Fiks, Mr Luan, and Ms Mayne contributed to the analysis and interpretation of the data; Mr Luan critically reviewed the manuscript; and all authors approved the fi nal manuscript as submitted. DOI: 10.1542/peds.2015-0675
Accepted for publication Oct 13, 2015
Address correspondence to Alexander G. Fiks, MD, The Children’s Hospital of Philadelphia, 3535 Market Street, Room 1546, Philadelphia, PA 19104. E-mail: fi [email protected]
PEDIATRICS (ISSN Numbers: Print, 0031-4005; Online, 1098-4275).
Copyright © 2016 by the American Academy of Pediatrics
FINANCIAL DISCLOSURE: The authors have indicated they have no fi nancial relationships relevant to this article to disclose.
FUNDING: Supported by the William Wikoff Smith Endowed Chair in Pediatric Genomics from the Children’s Hospital of Philadelphia.
POTENTIAL CONFLICT OF INTEREST: The authors have indicated they have no potential confl icts of interest to disclose.
Each year, ∼14 million people in the United States are newly infected with human papillomavirus (HPV),1 a common sexually transmitted infection that can cause cervical and other cancers as well as genital warts. A 3-dose HPV vaccine series has been licensed and recommended by the Advisory Committee on Immunization Practices for both males and females2,3
and is widely available. However, rates of HPV vaccination in both boys and girls remain low in absolute terms and relative to other adolescent vaccines (57% of girls and 35% of boys received ≥1 dose of HPV vaccine, whereas 78% and 86% of adolescents received the meningoccocal conjugate and tetanus-diphtheria-acellular pertussis vaccines, respectively).4,5
abstract
BACKGROUND: Many pediatricians are now required to participate in American
Board of Pediatrics Maintenance of Certification (MOC) Part IV programs focused on improving health care quality, but the benefits of participation are unproven.
METHODS: Twenty-seven primary care pediatricians from 11 primary care
practices participated in a 1-year MOC program for human papillomavirus (HPV) vaccine. Participants received education and electronic health record (EHR)-generated performance feedback reports with their rates of captured HPV immunization opportunities (dose given at eligible visit) and those of peers. In each of 3 cycles, clinicians collectively identified a goal for improvement. Rates of captured opportunities among adolescents 11 to <18 years old were tabulated, and statistical process control charts were created to evaluate changes over time among participants compared with 200 nonparticipants. Provider perceptions of the program and time invested were recorded via survey.
RESULTS: Participating clinicians missed fewer opportunities for HPV
vaccination than nonparticipants. MOC participants significantly increased their captured opportunities relative to nonparticipating clinicians by 5.7 percentage points for HPV dose 1 at preventive visits and by 0.7 and 5.6 percentage points for doses 1 and 2, respectively, at acute visits. There were no significant differences for other doses. The estimated program cost was $662/participant. Of the participating pediatricians, 96% felt the effort to participate was warranted, and half would not have joined the project without the MOC requirement.
CONCLUSIONS: Participation in MOC Part IV improved vaccination at modest
cost and with high pediatrician satisfaction, demonstrating benefits of the program that may help to inform future initiatives.
Missed opportunities (visits at which a vaccine-eligible adolescent presents for care but remains unvaccinated)6 present a significant barrier to achieving widespread coverage.
Locally and nationwide, many opportunities for HPV vaccination are missed, particularly for the first dose of the series at preventive visits and all 3 doses at acute or chronic care visits (subsequently referred to as “acute visits”).4,7 In a randomized controlled trial, we found that decision support targeted to clinicians in the form of electronic health record (EHR) alerts, education, and performance feedback and to families in the form of reminder phone calls improved HPV vaccination rates for all 3 doses,8 and that clinician-focused decision support increased captured opportunities for HPV vaccination.7 Missed opportunities persisted, however, as they have in other studies.9 These results underscored the need for continued improvement.
American Board of Pediatrics (ABP) Maintenance of Certification (MOC) Part IV is now a requirement for many pediatricians to maintain board certification through participation in approved quality improvement (QI) activities.10 While additional approaches are being approved, to receive MOC Part IV credit, participating clinicians have had to enroll in QI projects that meet ABP specifications.11 Although MOC is sometimes offered for QI programs required by hospital leaders, a potential benefit of MOC is that the program may engage clinicians in QI projects that otherwise would not draw participation. Despite the requirement to complete MOC, however, and despite studies that have explored benefits of MOC on process measures,12,13 the published evidence linking MOC to improved child health is lacking. Pediatricians increasingly are looking for evidence of impact to justify the investment of resources in the process.13,14
In this QI study, we evaluated the impact of an MOC program focused on individual clinicians and using education and performance feedback on reducing missed opportunities for HPV vaccination. Based on prior work and clinicalmeaningfulness7 , we hypothesized that clinicians participating in the MOC program would have greater improvements, in the range of 5 percentage points, than nonparticipants.
METHODS
Setting and Participating Population
The Children’s Hospital of
Philadelphia primary care network comprises 227 primary care
clinicians practicing at 27 practices at 31 sites, caring for >200 000 children in Pennsylvania and New Jersey.15 All practices share a common electronic health record (EHR) (EpicCare, Verona, WI). Twenty-seven of these primary care pediatricians (1 to 8 per practice) from 10 of these practices (3 from Philadelphia, 6 from elsewhere in Pennsylvania, and 1 from New Jersey) participated in the MOC project. Providers were notified about the project by 2 e-mail messages from network leaders, and each individual voluntarily chose to participate. Nurses and other office staff were not part of the project. The MOC program was implemented outside of the context of any research study, and no incentives were offered beyond MOC credit. All visits by an adolescent age 11 to 17 years due for ≥1 dose of HPV vaccine with a physician or nurse practitioner were included in the study.
The MOC Program
The MOC project met all ABP criteria for participants to receive MOC Part IV credit.11 The time period discussed in this article includes a baseline period (calendar year 2012) and an intervention period (January 1 to November 30, 2013). Before the start of the intervention, barriers
to HPV vaccination were identified by literature review and group discussion.16–20 The educational component, delivered by the project leader (AGF), consisted of a 1-hour webinar, required viewing for all MOC participants, that described current vaccination rates in the network, data on vaccine safety and efficacy, and strategies for overcoming barriers to vaccine receipt.8,21
Providers enrolled in the MOC project received quarterly performance feedback reports, extracted from EHRs, summarizing their own, their practices’, and the network’s rates of missed HPV vaccine opportunities (Fig 1). Reports listing each pediatrician’s results by name were shared among participants so that clinicians could benefit from not only reviewing their own performance but comparing it to top performers and any other clinician, a method that has previously been found to increase impact.22–24
Participating clinicians, drawn from practices across the network, met quarterly in a lunch-hour teleconference to review the results of performance feedback and decide on an area of improvement for the next quarter. MOC activities followed standard methodology for plan-do-study-act (PDSA) cycles.25 Individuals with conflicts were required to review a recording of the call.
Outcome Measures
survey regarding perceptions of the program and the time invested. Likert-scaled items were developed by the project team with input from an outside content expert to assess the perceived value of the project, the importance of MOC credit as a motivator for participation, and the importance of each component of the program in helping participants achieve project goals. Four open-ended items assessed satisfaction (see Supplemental Information).
Analysis
We compared the change in captured opportunities from baseline
(2012) to the MOC year (2013) for participants versus nonparticipants,
separately at preventive and acute visits. We calculated 95% confidence intervals (CIs) and P values by using logistic regression with the margins command in Stata version 13.1 (StataCorp, College Station, TX).
Statistical process control charts were generated to assess the MOC program’s impact on captured opportunities for HPV vaccination.27 These charts displayed biweekly proportions of captured opportunities for each vaccine dose during baseline and MOC periods for providers participating in the MOC and all other providers, and included upper and lower control limits, which were set at ±3 SDs to detect meaningful change.27 We considered a commonly
used set of tests for special cause variation, variation likely to result from the intervention: any points outside of the control limits, 8 successive points on the same side of the center line, 6 successive points increasing or decreasing (a trend), or obvious cyclic behavior.27 Charts were created separately for preventive and acute visits using QlikView (Qlik Technologies, Radnor, PA). To assess potential gender and age patterns, we also examined the charts separately for boys versus girls and for 11- to 13-year-olds versus 14- to 17-year-olds. Changes in the rate of captured opportunities in the MOC participant group were benchmarked against our expectation of 5-percentage-point improvements.
Finally, we evaluated the costs required to implement the MOC project. We calculated the total cost of each of the following components: creation of the performance feedback reports, time spent on creating and delivering the educational content, and time spent by participating providers on (1) group calls, (2) reviewing data, and (3) planning/ implementing practice change (measured by clinician survey). We then calculated the cost per participating clinician using national estimates of the median salary for a general pediatrician ($79 per hour)28 and applying the median amount of time participating clinicians reported spending on each activity to the total number of providers in the intervention group (n = 27). Details of the cost analysis are shown in Supplemental Table 5.
The Children’s Hospital of Philadelphia institutional review board determined that this study was not human subjects research.
RESULTS Participants
Characteristics of the 27 partici-pating MOC pediatricians (of 227 in the network) are shown in
FIGURE 1
Table 1. Overall, participant and nonparticipant characteristics were similar (Table 1). Baseline rates of HPV captured opportunities were slightly higher in the MOC group, especially for dose 2 at acute visits and dose 3 (Table 2).
Implementation of the Intervention
At group meetings, all participating clinicians agreed to target 3 areas, each for ∼2 months. At the first provider meeting in January 2013, participants chose to use the following language to discuss the
HPV vaccine with families: “We strongly recommend the HPV vaccine. It is a normal part of the adolescent vaccine platform that prevents cancer in both males and females. Beginning the series today is the best way to get the series completed and protect your child.” At the second meeting in April 2013, participating clinicians decided to emphasize the
importance of HPV as a tool for cancer prevention. Finally, at the third meeting in August 2013, clinicians focused on consistently recommending the HPV vaccine at acute visits. All decisions were reached by MOC participant consensus. All physicians attested to participating in every session by phone or by listening to a recording to obtain MOC credit.
Changes in Captured Vaccination Opportunities From Baseline to MOC Periods
In the baseline year, captured opportunities were especially low for HPV dose 1, with less than one-third of opportunities captured at preventive visits and only ≤2% opportunities captured at acute visits. For HPV doses 2 and 3 at acute visits, <30% of opportunities
TABLE 1 Characteristics of Participants in the HPV MOC Program Compared With Nonparticipating Primary Care Providers
Characteristic MOC Participants Nonparticipants P
Total n 27 200
Job title 0.01
Pediatrician 27 (100) 163 (82)
Nurse Practitionera 0 (0) 37 (18)
Gender 0.3
Female 19 (70) 158 (79)
Male 8 (30) 42 (21)
Number of years in practice (mean, SD)b 18.1 (1.2) 15.7 (0.7) 0.2
Practice Setting 0.4
Urban 11 (41) 64 (32)
Suburban 16 (59) 136 (68)
Data are expressed as n (%).
a No nurse practitioners were in the intervention group because nurse practitioners are not eligible for MOC credit. b As of the start of the intervention (January 1, 2013).
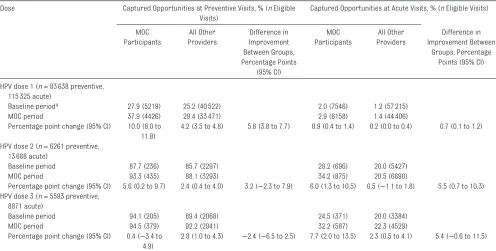
TABLE 2 Captured Vaccination Opportunities Among MOC Participants and Other Clinicians: Difference in Difference Dose Captured Opportunities at Preventive Visits, % (n Eligible
Visits)
Captured Opportunities at Acute Visits, % (n Eligible Visits)
MOC Participants
All Other Providers
Difference in Improvement Between Groups, Percentage Points
(95% CI)
MOC Participants
All Other Providers
Difference in Improvement Between
Groups, Percentage Points (95% CI)
HPV dose 1 (n = 83 638 preventive, 115 325 acute)
Baseline perioda 27.9 (5219) 25.2 (40 522) 2.0 (7546) 1.2 (57 215)
MOC period 37.9 (4426) 29.4 (33 471) 2.9 (6158) 1.4 (44 406)
Percentage point change (95% CI) 10.0 (8.0 to 11.8)
4.2 (3.5 to 4.8) 5.8 (3.8 to 7.7) 0.9 (0.4 to 1.4) 0.2 (0.0 to 0.4) 0.7 (0.1 to 1.2)
HPV dose 2 (n = 6261 preventive, 13 688 acute)
Baseline period 87.7 (236) 85.7 (2297) 28.2 (696) 20.0 (5427)
MOC period 93.3 (435) 88.1 (3293) 34.2 (875) 20.5 (6690)
Percentage point change (95% CI) 5.6 (0.2 to 9.7) 2.4 (0.4 to 4.0) 3.2 (−2.3 to 7.9) 6.0 (1.3 to 10.5) 0.5 (−1.1 to 1.8) 5.5 (0.7 to 10.3) HPV dose 3 (n = 5593 preventive,
8871 acute)
Baseline period 94.1 (205) 89.4 (2068) 24.5 (371) 20.0 (3384)
MOC period 94.5 (379) 92.2 (2941) 32.2 (587) 22.3 (4529)
Percentage point change (95% CI) 0.4 (−3.4 to 4.9)
2.8 (1.0 to 4.3) −2.4 (−6.5 to 2.5) 7.7 (2.0 to 13.5) 2.3 (0.5 to 4.1) 5.4 (−0.6 to 11.5)
In subgroup analyses, several differences were noted by age and gender. Providers in the MOC group had a larger relative increase in captured opportunities versus control providers for HPV doses 1 and 2 at preventive visits in boys (7 and 5 percentage points, respectively) than in girls (4 and 0). Similarly, MOC providers had a large relative increase in captured opportunities for dose 1 at preventive visits and dose 3 at acute visits (8 and 14 percentage points) for children aged 11 to 13 years but not older adolescents, and an increase for dose 2 at preventive visits only for those 14 to 17 years old (4 percentage points).
were captured. Overall proportions of captured opportunities in the baseline and MOC years are presented in Table 2. Despite higher baseline rates, participants in the MOC had a significant relative increase in captured opportunities compared with nonparticipants for HPV dose 1 at preventive visits (5.8 percentage points [95% CI 3.8 to 7.7]) and doses 1 and 2 at acute visits (0.7 [0.1 to 1.2] and 5.5 [0.7 to 10.3] percentage points, respectively) (Table 2). MOC participants had relative increases that did not reach statistical significance for dose 2 at preventive visits and dose 3 at acute visits (3.2 [−2.3 to 7.9] and 5.4 [−0.6 to 11.5], respectively). Several differences were noted by age and gender (see footnote, Table 2).
Preventive Visits
In the baseline period, the overall mean proportion of captured opportunities (including both MOC participants and nonparticipants) for dose 1 at preventive visits was 26% (Fig 2A). After providers decided to use consistent language to recommend the vaccine in the first PDSA cycle, captured opportunities increased substantially in the MOC group (Fig 2A). Special cause variation in cycle 1 included 6 points above the upper control limit and 8 consecutive points above the centerline for the MOC group. This special cause variation was sustained in cycles 2 and 3. The non-MOC group also had special cause variation in all 3 cycles; however, improvements were smaller than in the MOC group.
The MOC had less of an effect on doses 2 and 3 at preventive visits, where the mean proportion of captured opportunities was already very high in the baseline year (86% for dose 2 and 90% for dose 3, including both MOC and non-MOC participants). Reflecting a ceiling effect, there were no points above the upper control limit for either dose in either group (data not shown).
FIGURE 2
Acute Visits
Captured opportunities for HPV dose 1 at acute visits were rare in the baseline period (1% mean rate across all providers). In the intervention period, captured opportunities increased over time for both groups, reaching higher levels for the MOC group compared with nonparticipants (Fig 3A). The MOC group had special cause variation with improvements in all 3 cycles. The non-MOC group also had special cause variation in all 3 cycles; in cycle 1, however, this variation reflected a lower proportion of captured opportunities, and in cycles 2 and 3, improvements were smaller than in the MOC group.
For dose 2 at acute visits, the baseline mean proportion of
captured opportunities was 21%. The proportion of captured opportunities for the MOC group increased
significantly with the focus on cancer prevention in cycle 2 and acute-visit vaccination in cycle 3 (Fig 3B). Special cause variation in the MOC group included improvements in cycles 2 and 3. The non-MOC group had special cause variation only in cycle 1, reflecting a decrease in captured opportunities. For dose 3 at acute visits, the mean proportion of captured opportunities in the baseline period was 20%. As with dose 2, an increase in captured opportunities was observed in the MOC period; however, results were not significant and did not correspond to any of the 3 MOC cycles (data not shown).
Cost Analysis
The estimated total cost of the MOC program was $17 887 ($662 per participant), of which $17 064 was
for participant time spent on the program. Details regarding costs are presented in the Supplemental Information.
Participant Satisfaction
Table 3 presents the results of the clinician survey regarding the intervention. Of 27 providers, 22 (81%) completed the survey. Overall, 96% agreed that the effort invested in the MOC project was warranted, and more than half did not agree that they would have participated in the project without the incentive of MOC credit. Finally, nearly all providers felt each component of the intervention (educational presentation, data summarizing vaccination rates, and team meetings to discuss the project) was important.
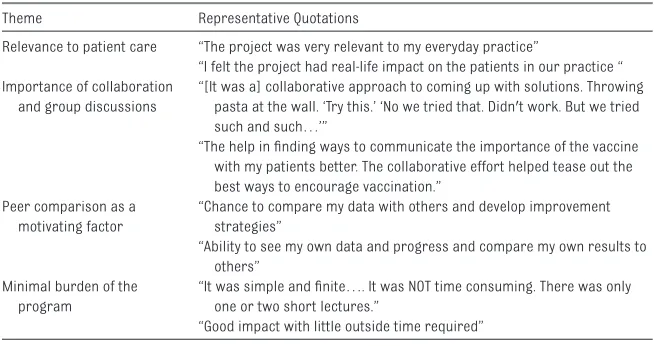
Open-ended responses regarding participants’ experience with the MOC program revealed several themes (Table 4), specifically that participants felt that the project was relevant to patient care, benefited from collaboration and group discussion, found peer comparison to be a motivating factor, and did not find the program burdensome. A majority of participants reported that they would not change anything about the program. Some found it difficult to attend group calls.
Barriers Encountered
The primary barrier encountered during the MOC project was difficulty in scheduling the calls and having all clinicians participate. This barrier was overcome by recording the phone calls and sending out minutes to all participants with a link to the recording. In addition, although the MOC educational content emphasized the benefits of vaccinating young adolescents, some providers were
persistent in their reluctance to vaccinate starting at age 11 years, limiting improvement.
DISCUSSION
We found that participation in MOC Part IV by primary care pediatricians was associated with a significant increase in captured opportunities for HPV vaccine initiation at preventive visits and for doses 1 and 2 at acute visits. Results were consistent with the rate of improvement anticipated by project leaders and fell in the range of improvement observed in other studies.8,9 Captured opportunities increased after decisions by
providers to use consistent language to describe the HPV vaccine,
focus on cancer prevention, and emphasize vaccination at acute visits. The project was completed at a modest cost, similar to the cost per clinician of attending a continuing education conference, with the greatest expense the time invested by participating pediatricians. Reflecting the importance of MOC as a potential motivator to participate in QI projects, more than half of participants indicated that MOC influenced their decision to participate in this HPV QI initiative.
Results also varied widely by dose and at acute versus preventive visits. Initiating HPV vaccination is widely regarded as a primary challenge in improving vaccination rates.29,30 Although the magnitude of improvement for HPV dose 1 at acute visits was small given clinician difficulty in engaging in lengthy conversations regarding vaccination at these visits,31–33 captured
opportunities rose significantly for dose 1 at all visits. Vaccination increased for HPV dose 2 at acute visits to a much greater extent than for dose 1, likely because families had already agreed to accept the vaccine and were
receptive to clinician recommendation, use consistent language to recommend the HPV vaccine; cycle 2, providers emphasized the vaccine
as a tool for cancer prevention; and cycle 3, providers emphasized vaccination at acute visits. Red dot, the proportion of captured opportunities was below the lower control limit for that time period; blue dot, the proportion was within the control limits; and green dot, the proportion was above the upper control limit. Labels on the x-axis indicate the year and biweek number (ex: 2012.01 indicates the fi rst biweek of 2012).
which was supported by the MOC project activities. Although the intervention improved captured opportunities for HPV dose 3, fewer opportunities occurred and results were not significant. The lack of improvement for HPV doses 2 and 3 at preventive visits likely reflected the high baseline
vaccination rates, representing a ceiling effect.
Several features of the program may have fostered increased vaccination for certain doses. First, a common EHR served as a data collection tool so that practitioners could focus on improvement instead of
measurement. EHRs may provide a foundation for improving the delivery of primary care by enabling the collection, measurement, and reporting of patient outcomes and quality of care.34–36 The ABP itself has recognized the critical role of health information systems in facilitating QI activities as part of MOC.37 When
FIGURE 3
surveyed, pediatricians uniformly felt that the burden of participation was low, a benefit of the automated extraction of EHR data. The project also benefited from collective agreement among participants on the intervention for each PDSA cycle. By using a common approach, it was possible to measure whether a particular intervention was effective and for discussion to allow those who were especially successful to provide guidance to other participants. The structure of the feedback, which included both personal feedback and comparisons to peers, leveraged strategies known to motivate improvement.22 The ability to compare results to others was widely cited by participants as an aspect of the program that they “liked best.” The sharing of individual reports among all participants likely also contributed to improvement, since transparency has been shown to motivate change.38 In terms of measuring improvement, although rates of HPV vaccination increased nationally during the project period,39 a comparison with nonparticipants allowed us to assess local improvements attributable to the project. However, larger improvements observed among boys compared with girls for certain doses may reflect national trends of increasing male vaccination.39
Despite the improvements in captured opportunities among participating providers, several barriers remained, since many opportunities were missed even during the MOC period. As mentioned in Results, many pediatricians resisted vaccinating younger adolescents under the sometimes mistaken assumption that they can determine who is and who will become sexually active.40,41 Education around this barrier was included in the introduction of the MOC, but more attention to this barrier may have been needed. In addition, clinicians are known to perceive a higher level of parental resistance among parents of younger adolescents, indicating a need to further support improved communication with specific
messaging strategies.40,42 Benefits may have been limited since provider performance feedback was only delivered quarterly. As suggested by a meta-analysis on the effect of feedback on clinical outcomes, more frequent feedback has been associated with greater practice improvement.43 We have developed an app that we plan to offer clinicians and administrators to deliver continuous feedback on vaccination rates and further drive practice improvement (Supplemental Figure 4).
By individually recruiting clinicians as opposed to offices or entire practice networks, this MOC project differed from others that grant credit when clinicians participate in organized institutional initiatives. This approach allowed us to examine the independent effect of MOC in the absence of an organizational push for change. However, this strategy may also have constrained our ability to improve vaccination rates, as administrators, nurses, and office staff were not engaged in the effort, limiting our ability to change office systems to improve vaccination.25 In addition, our project engaged only ∼10% of clinicians in the practice network, limiting the ability of the QI effort to reach families across the network. In this context, our results
TABLE 3 Results of Provider Survey by MOC Participants
Survey Item n (%)
Completed survey (total n = 27) 22 (81)
Effort invested in MOC project was warranted
Strongly agree or agree 21 (96)
Ability to obtain MOC credit was a factor in choice to participate in the project
Strongly agree or agree 20 (91)
Would have participated if MOC credit was not offered
Strongly agree or agree 10 (45)
Level of importance of intervention components Introductory presentation on barriers/solutions
Very important or important 21 (96)
Access to data summarizing vaccination rates
Very important or important 21 (96)
Team meetings to discuss the project
Very important or important 21 (96)
TABLE 4 Participant Open-Ended Responses to the Question “What Did You Like Most About the MOC Program?”
Theme Representative Quotations
Relevance to patient care “The project was very relevant to my everyday practice”
“I felt the project had real-life impact on the patients in our practice “ Importance of collaboration
and group discussions
“[It was a] collaborative approach to coming up with solutions. Throwing pasta at the wall. ‘Try this.’ ‘No we tried that. Didn't work. But we tried such and such…’”
“The help in fi nding ways to communicate the importance of the vaccine with my patients better. The collaborative effort helped tease out the best ways to encourage vaccination.”
Peer comparison as a motivating factor
“Chance to compare my data with others and develop improvement strategies”
“Ability to see my own data and progress and compare my own results to others”
Minimal burden of the program
“It was simple and fi nite…. It was NOT time consuming. There was only one or two short lectures.”
suggest that a narrowly clinician-focused intervention can modestly improve vaccination rates, but a broader effort that acts at the system level may be needed for further improvement. Locally, we have reached out to network and hospital administrative leaders to plan future efforts.
CONCLUSIONS
Pediatricians increasingly are requesting evidence of impact to justify the investment of resources in MOC activities. The results of this MOC Part IV program demonstrate the potential of this requirement to foster health, in this case the prevention of HPV-related disease, including cancer, through better vaccine coverage. Although improvements were modest and system-level changes may be needed to drive greater improvement, results were achieved at a relatively low cost and with high pediatrician satisfaction. As an increasing number of groups develop MOC programs, leaders and participants should continue to evaluate how this board certification requirement may most meaningfully improve the health of children.
ACKNOWLEDGMENTS
We thank Mark Ramos from the Department of Biomedical and Health Informatics at the Children’s Hospital of Philadelphia for his contributions to data acquisition. We also thank Lisa Biggs and Trude Haecker of the Children’s Hospital of Philadelphia for their contributions to the MOC program. Laurel Leslie provided input on the participant survey and reviewed the manuscript. We also thank Ron Keren and April Taylor of the Children’s Hospital of Philadelphia for reviewing the manuscript. Finally, we acknowledge Rachel Freedman of the Office of Clinical Quality Improvement at the
Children’s Hospital of Philadelphia for creation of the provider feedback dashboard presented in the
Supplemental Information.
ABBREVIATIONS
ABP: American Board of Pediatrics
CI: confidence interval EHR: electronic health record HPV: human papillomavirus MOC: ABP Maintenance of
Certification PDSA: plan-do-study-act QI: quality improvement
REFERENCES
1. Satterwhite CL, Torrone E, Meites E, et al. Sexually transmitted infections among US women and men: prevalence and incidence estimates, 2008. Sex Transm Dis. 2013;40(3):187–193
2. Centers for Disease Control and Prevention (CDC). Recommendations on the use of quadrivalent
human papillomavirus vaccine in males—Advisory Committee on Immunization Practices (ACIP), 2011. MMWR Morb Mortal Wkly Rep. 2011;60(50):1705–1708
3. Markowitz LE, Dunne EF, Saraiya M, Lawson HW, Chesson H, Unger ER; Centers for Disease Control and Prevention (CDC); Advisory Committee on Immunization Practices (ACIP). Quadrivalent human papillomavirus vaccine: recommendations of the Advisory Committee on Immunization Practices (ACIP). MMWR Recomm Rep. 2007;56(RR-2):1–24
4. Centers for Disease Control and Prevention. Teen Vaccination Coverage: 2011 National Immunization Survey-Teen (NIS-Survey-Teen). Available at: www. cdc. gov/ vaccines/ who/ teens/ vaccination- coverage. html. Accessed October 22, 2015
5. Stokley S, Jeyarajah J, Yankey D, et al; Immunization Services Division, National Center for Immunization and Respiratory Diseases, CDC; Centers for Disease Control and Prevention (CDC).
Human papillomavirus vaccination coverage among adolescents, 2007-2013, and postlicensure vaccine safety monitoring, 2006-2014—United States. MMWR Morb Mortal Wkly Rep. 2014;63(29):620–624
6. Wong CA, Taylor JA, Wright JA, Opel DJ, Katzenellenbogen RA. Missed opportunities for adolescent vaccination, 2006-2011. J Adolesc Health. 2013;53(4):492–497
7. Mayne SL, duRivage NE, Feemster KA, Localio AR, Grundmeier RW, Fiks AG. Effect of decision support on missed opportunities for human papillomavirus vaccination. Am J Prev Med. 2014;47(6):734–744
8. Fiks AG, Grundmeier RW, Mayne S, et al. Effectiveness of decision support for families, clinicians, or both on HPV vaccine receipt. Pediatrics. 2013;131(6). Available at: www. pediatrics. org/ cgi/ content/ full/ 131/ 6/ e1114
9. Szilagyi PG, Serwint JR, Humiston SG, et al. Effect of provider prompts on adolescent immunization rates: a randomized trial. Acad Pediatr. 2015;15(2):149–157
10. American Board of Pediatrics. About Maintenance of Certifi cation (MOC). www. abp. org/ content/ about- maintenance- certifi cation- moc. Accessed June 5, 2015
11. American Board of Pediatrics. Maintenance of Certifi cation Activity Manager. Sponsor Organizations. Part 4: QI Projects (more than 10 physicians). www. mocactivitymanage r. org/ public/ abp/ p4qiStandards/ . Accessed February 17, 2015
12. Huang JS, Chun S, Sandhu A, Terrones L. Quality improvement in childhood obesity management through the maintenance of certifi cation process. J Pediatr. 2013;163(5):1313–1316
13. Vernacchio L, Francis ME, Epstein DM, et al. Effectiveness of an asthma quality improvement program designed for maintenance of certifi cation. Pediatrics. 2014;134(1). Available at: www. pediatrics. org/ cgi/ content/ full/ 134/ 1/ e242
APS/SPR Member Feedback Regarding Maintenance of Certifi cation. Available at: meducation. net/ resources/ 1659987- APS- SPR- Member- feedback- regarding- Maintenance- of- Certifi cation. Accessed October 22, 2015
15. Fiks AG, Grundmeier RW, Margolis B, et al. Comparative effectiveness research using the electronic medical record: an emerging area of investigation in pediatric primary care. J Pediatr. 2012;160(5):719–724
16. Kahn JA, Ding L, Huang B, Zimet GD, Rosenthal SL, Frazier AL. Mothers’ intention for their daughters and themselves to receive the human papillomavirus vaccine: a national study of nurses. Pediatrics. 2009;123(6). Available at: www. pediatrics. org/ cgi/ content/ full/ 123/ 6/ e1439
17. Hughes CC, Jones AL, Feemster KA, Fiks AG. HPV vaccine decision making in pediatric primary care: a semi-structured interview study. BMC Pediatr. 2011;11:74
18. Perkins RB, Clark JA, Apte G, et al. Missed opportunities for HPV vaccination in adolescent girls: a qualitative study. Pediatrics. 2014;134(3). Available at: www. pediatrics. org/ cgi/ content/ full/ 134/ 3/ e666
19. Rand CM, Shone LP, Albertin C, Auinger P, Klein JD, Szilagyi PG. National health care visit patterns of adolescents: implications for delivery of new adolescent vaccines. Arch Pediatr Adolesc Med. 2007;161(3):252–259
20. Vadaparampil ST, Kahn JA, Salmon D, et al. Missed clinical opportunities: provider recommendations for HPV vaccination for 11-12 year old girls are limited. Vaccine. 2011;29(47):8634–8641
21. Freed GL, Clark SJ, Butchart AT, Singer DC, Davis MM. Parental vaccine safety concerns in 2009. Pediatrics. 2010;125(4). Available at: www. pediatrics. org/ cgi/ content/ full/ 125/ 4/ e654
22. Buntinx F, Knottnerus JA, Crebolder HF, Seegers T, Essed GG, Schouten H. Does feedback improve the quality of cervical smears? A randomized
controlled trial. Br J Gen Pract. 1993;43(370):194–198
23. Hadjianastassiou VG, Karadaglis D, Gavalas M. A comparison between different formats of educational feedback to junior doctors: a prospective pilot intervention study. J R Coll Surg Edinb. 2001;46(6):354–357
24. Kiefe CI, Allison JJ, Williams OD, Person SD, Weaver MT, Weissman NW. Improving quality improvement using achievable benchmarks for physician feedback: a randomized controlled trial. JAMA. 2001;285(22):2871–2879
25. Institute of Medicine. Crossing the Quality Chasm: A New Health System for the 21st Century. Washington, D.C.: National Academy Press; 2001
26. Harris PA, Taylor R, Thielke R, Payne J, Gonzalez N, Conde JG. Research electronic data capture (REDCap)—a metadata-driven methodology and workfl ow process for providing translational research informatics support. J Biomed Inform. 2009;42(2):377–381
27. Benneyan JC, Lloyd RC, Plsek PE. Statistical process control as a tool for research and healthcare improvement. Qual Saf Health Care. 2003;12(6):458–464
28. U.S. Bureau of Labor Statistics. Occupational Employment and Wages, May 2014. 29-1065 Pediatricians, General. www. bls. gov/ oes/ current/ oes291065. htm. Updated March 25, 2015. Accessed May 26, 2015
29. Hofstetter AM, Stockwell MS, Al-Husayni N, et al. HPV vaccination: are we initiating too late? Vaccine. 2014;32(17):1939–1945
30. Holman DM, Benard V, Roland KB, Watson M, Liddon N, Stokley S. Barriers to human papillomavirus vaccination among US adolescents: a systematic review of the literature. JAMA Pediatr. 2014;168(1):76–82
31. Birmingham E, Catallozzi M, Findley SE, Vawdrey DK, Kukafka R, Stockwell MS. FluAlert: a qualitative evaluation of providers’ desired characteristics and concerns regarding computerized infl uenza vaccination alerts. Prev Med. 2011;52(3–4):274–277
32. Sussman AL, Helitzer D, Bennett A, Solares A, Lanoue M, Getrich CM. Catching up with the HPV vaccine: challenges and opportunities in primary care. Ann Fam Med. 2015;13(4):354–360
33. Szilagyi PG, Rodewald LE. Missed opportunities for immunizations: a review of the evidence. J Public Health Manag Pract. 1996;2(1):18–25
34. Krist AH, Beasley JW, Crosson JC, et al. Electronic health record functionality needed to better support primary care. J Am Med Inform Assoc. 2014;21(5):764–771
35. Meyers D, Quinn M, Clancy CM. Health information technology: turning the patient-centered medical home from concept to reality. Am J Med Qual. 2011;26(2):154–156
36. Taylor EF, Genevro J, Peikes D, Geonnotti K, Wang W, Meyers D. Building Quality Improvement Capacity in Primary Care: Supports and Resources. Available at: www. ahrq. gov/ professionals/ prevention- chronic- care/ improve/ capacity- building/ pcmhqi2. html. Accessed October 22, 2015
37. Miles P. Health information systems and physician quality: role of the American Board of Pediatrics Maintenance of Certifi cation in improving children’s health care. Pediatrics. 2009;123(suppl 2):S108–S110
38. Schechter MS, Gutierrez HH. Improving the quality of care for patients with cystic fi brosis. Curr Opin Pediatr. 2010;22(3):296–301
39. Elam-Evans LD, Yankey D, Jeyarajah J, et al; Immunization Services Division, National Center for Immunization and Respiratory Diseases; Centers for Disease Control and Prevention (CDC). National, regional, state, and selected local area vaccination coverage among adolescents aged 13-17 years—United States, 2013. MMWR Morb Mortal Wkly Rep. 2014;63(29):625–633
41. Quinn GP, Murphy D, Malo TL, Christie J, Vadaparampil ST. A national survey about human papillomavirus vaccination: what we didn’t ask, but physicians wanted us to know. J Pediatr Adolesc Gynecol. 2012;25(4):254–258
42. Javanbakht M, Stahlman S, Walker S, et al. Provider perceptions of barriers and facilitators of HPV vaccination in a high-risk commu-nity. Vaccine. 2012;30(30):4511– 4516
DOI: 10.1542/peds.2015-0675 originally published online February 3, 2016;
2016;137;
Pediatrics
Alexander G. Fiks, Xianqun Luan and Stephanie L. Mayne
Requirements
Improving HPV Vaccination Rates Using Maintenance-of-Certification
Services
Updated Information &
http://pediatrics.aappublications.org/content/137/3/e20150675 including high resolution figures, can be found at:
References
http://pediatrics.aappublications.org/content/137/3/e20150675#BIBL This article cites 31 articles, 5 of which you can access for free at:
Subspecialty Collections
_sub
http://www.aappublications.org/cgi/collection/vaccine:immunization
Vaccine/Immunization
b
http://www.aappublications.org/cgi/collection/infectious_diseases_su
Infectious Disease
sub
http://www.aappublications.org/cgi/collection/quality_improvement_
Quality Improvement
_management_sub
http://www.aappublications.org/cgi/collection/administration:practice
Administration/Practice Management
following collection(s):
This article, along with others on similar topics, appears in the
Permissions & Licensing
http://www.aappublications.org/site/misc/Permissions.xhtml in its entirety can be found online at:
Information about reproducing this article in parts (figures, tables) or
Reprints
DOI: 10.1542/peds.2015-0675 originally published online February 3, 2016;
2016;137;
Pediatrics
Alexander G. Fiks, Xianqun Luan and Stephanie L. Mayne
Requirements
Improving HPV Vaccination Rates Using Maintenance-of-Certification
http://pediatrics.aappublications.org/content/137/3/e20150675
located on the World Wide Web at:
The online version of this article, along with updated information and services, is
http://pediatrics.aappublications.org/content/suppl/2016/02/01/peds.2015-0675.DCSupplemental Data Supplement at:
by the American Academy of Pediatrics. All rights reserved. Print ISSN: 1073-0397.