University of Pennsylvania
ScholarlyCommons
Publicly Accessible Penn Dissertations
1-1-2013
Mechanics of Interactions and Atomic-Scale Wear
of Tips ian Amplitude Modulation Atomic Force
Microscopy
Vahid Vahdat
University of Pennsylvania, [email protected]
Follow this and additional works at:http://repository.upenn.edu/edissertations Part of theMechanical Engineering Commons
This paper is posted at ScholarlyCommons.http://repository.upenn.edu/edissertations/812
Recommended Citation
Vahdat, Vahid, "Mechanics of Interactions and Atomic-Scale Wear of Tips ian Amplitude Modulation Atomic Force Microscopy" (2013).Publicly Accessible Penn Dissertations. 812.
Mechanics of Interactions and Atomic-Scale Wear of Tips ian Amplitude
Modulation Atomic Force Microscopy
Abstract
Wear is one of the main factors that hinders the performance of probes for atomic force microscopy (AFM), including for the widely-used amplitude modulation (AM-AFM) mode. Unfortunately, a comprehensive scientific understanding of nanoscale wear is lacking. We initially investigate and discuss the mechanics of the tip-sample interaction in AM-AFM. Starting from existing analytical formulations, we introduce a method for conveniently choosing an appropriate probe and free oscillation amplitude that avoids exceeding a critical contact stress to minimize tip/sample damage. We then introduce a protocol for conducting consistent and quantitative AM-AFM wear experiments. The protocol involves determining the tip-sample contact geometry, calculating the peak repulsive force and normal stress over the course of the wear test, and quantifying the wear volume using high-resolution transmission electron microscopy (TEM) imaging. The peak repulsive tip-sample interaction force is estimated from a closed-form equation accompanied by an effective tip radius measurement procedure, which combines TEM and blind tip reconstruction. The contact stress is estimated by applying Derjaguin-Müller-Toporov contact mechanics model and also numerically solving a general contact mechanics model recently developed for the adhesive contact of arbitrary axisymmetric punch shapes. We discuss the important role that the assumed tip shape geometry plays in calculating both the interaction forces and the contact stresses. We find that contact stresses are significantly affected by the tip geometry, while the peak repulsive force is mainly determined by experimentally-controlled parameters, most critically, the free oscillation amplitude. The applicability of this protocol is demonstrated experimentally by assessing the performance of diamond-like carbon-coated and silicon nitride-coated silicon probes scanned over ultrananocrystalline diamond substrates in repulsive-mode AM-AFM. There is no sign of fracture or plastic deformation in the case of diamond-like carbon (DLC); wear could be characterized as a gradual atom-by-atom process. In contrast, silicon nitride wears through apparent removal of the cluster of atom-by-atoms and plastic deformation. DLC's gradual wear mechanism can be described using reaction rate theory, which predicts an exponential dependence of the rate of atom removal on the contact average normal stress, allowing us to estimate kinetic parameters governing the wear process.
Degree Type
Dissertation
Degree Name
Doctor of Philosophy (PhD)
Graduate Group
Mechanical Engineering & Applied Mechanics
First Advisor
Robert W. Carpick
Keywords
Subject Categories
MECHANICS OF INTERACTIONS AND ATOMIC-SCALE WEAR OF
TIPS IN AMPLITUDE MODULATION ATOMIC FORCE MICROSCOPY
Vahid Vahdat
A DISSERTATION
in
Mechanical Engineering and Applied Mechanics
Presented to the Faculties of the University of Pennsylvania
in
Partial Fulfillment of the Requirements for the
Degree of Doctor of Philosophy
2013
Supervisor of Dissertation
______________________________________________________________________________
Robert W. Carpick, Professor and Chair, Mechanical Engineering and Applied Mechanics
Graduate Group Chairperson
_____________________________________________________________________________ Jennifer R. Lukes, Associate Professor, Mechanical Engineering and Applied Mechanics
Dissertation Committee:
Kevin T. Turner, Associate Professor, Mechanical Engineering and Applied Mechanics
Robert W. Carpick, Professor and Chair, Mechanical Engineering and Applied Mechanics
John L. Bassani, Richard H. and S.L. Gabel Professor of Mechanical Engineering
MECHANICS OF INTERACTIONS AND ATOMIC-SCALE WEAR OF TIPS IN
AMPLITUDE MODULATION ATOMIC FORCE MICROSCOPY
COPYRIGHT
2013
To my parents, Asad Baba and Nahid Maman, and my sisters, Kati and Soody, for your
ACKNOWLEDGMENTS
Professor Carpick, thank you for your support, understanding, and guidance in
both my academic and personal life. You not only taught me science, but also showed me
how to be a caring and kind person, positive, and make the best out of everything
especially experimental data!
I also would like to thank Professor Arvind Raman, Dr. David S. Grierson, Dr.
Tevis D. B. Jacobs, Graham E. Wabiszewski, Dr. Filippo Mangolini, and Dr.
Vivekenanda P. Adiga for your useful and stimulating discussions on various topics
during my studies at Penn.
I would also like to thank Dr. Andrew R. Koniceck and Dr. Philip Egberts for
your comments and suggestions on my scientific writings and presentations.
I would also like to take the chance to thank the administrative staff in the
Department of Mechanical Engineering and Applied Mechanics, including Susan W.
Pilder, Maryeileen B. Griffith, and Desirae Johnson. Thank you for your kindness and
help over the course of my PhD. Consulting and talking with you have always calmed
down my anxious mind before qualifying and proposal exams, departmental seminar, and
dissertation defense.
Peter Szczesniak and Peter Rockett, Department of Machanical Engineering and
Applied Mechanics technical staff, thank you for your technical advice and your
Finally, I would like to thank Dawn Norris, Towne Business Office staff member,
for your help to resolve my complicated visa issues when I started to work at Carpick
ABSTRACT
MECHANICS OF INTERACTIONS AND ATOMIC-SCALE WEAR OF TIPS IN
AMPLITUDE MODULATION ATOMIC FORCE MICROSCOPY
Vahid Vahdat Professor Robert W. Carpick
Wear is one of the main factors that hinders the performance of probes for atomic
force microscopy (AFM), including for the widely-used amplitude modulation
(AM-AFM) mode. Unfortunately, a comprehensive scientific understanding of nanoscale wear
is lacking. We initially investigate and discuss the mechanics of the tip-sample
interaction in AM-AFM. Starting from existing analytical formulations, we introduce a
method for conveniently choosing an appropriate probe and free oscillation amplitude
that avoids exceeding a critical contact stress to minimize tip/sample damage. We then
introduce a protocol for conducting consistent and quantitative AM-AFM wear
experiments. The protocol involves determining the tip-sample contact geometry,
calculating the peak repulsive force and normal stress over the course of the wear test,
and quantifying the wear volume using high-resolution transmission electron microscopy
(TEM) imaging. The peak repulsive tip-sample interaction force is estimated from a
closed-form equation accompanied by an effective tip radius measurement procedure,
which combines TEM and blind tip reconstruction. The contact stress is estimated by
applying Derjaguin-Müller-Toporov contact mechanics model and also numerically
solving a general contact mechanics model recently developed for the adhesive contact of
shape geometry plays in calculating both the interaction forces and the contact stresses.
We find that contact stresses are significantly affected by the tip geometry, while the
peak repulsive force is mainly determined by experimentally-controlled parameters, most
critically, the free oscillation amplitude. The applicability of this protocol is demonstrated
experimentally by assessing the performance of diamond-like carbon-coated and silicon
nitride-coated silicon probes scanned over ultrananocrystalline diamond substrates in
repulsive-mode AM-AFM. There is no sign of fracture or plastic deformation in the case
of diamond-like carbon (DLC); wear could be characterized as a gradual atom-by-atom
process. In contrast, silicon nitride wears through apparent removal of the cluster of
atoms and plastic deformation. DLC’s gradual wear mechanism can be described using
reaction rate theory, which predicts an exponential dependence of the rate of atom
removal on the contact average normal stress, allowing us to estimate kinetic parameters
TABLE OF CONTENTS
ACKNOWLEDGMENTS ... IV
ABSTRACT VI
TABLE OF CONTENTS ... VIII
LIST OF TABLES ... X
LIST OF ILLUSTRATIONS ... XI
CHAPTER 1 : INTRODUCTION ... 1
1.1: Overview of the Importance of Wear ... 2
1.2: Amplitude Modulation Atomic Force Microscopy ... 4
1.3: Previous Studies of Wear in AM-AFM... 13
CHAPTER 2 : MECHANICS OF THE TIP-SAMPLE INTERACTION ... 16
2.1: Attractive Mode Imaging and Wear in AM-AFM ... 16
2.2: Peak Repulsive Force ... 18
2.3: Contact Mechanics Model and Average Normal Stress ... 22
2.3.1: Average Normal Stress of an Axisymmetric Arbitrary Punch Shape ... 27
2.4: Mapping Stress and Selection of AM-AFM probe and Free Oscillation Amplitude ... 30
2.4.1: Peak Repulsive Force: Assumptions and Dependence on Amplitude Ratio ... 31
2.4.2: Hertzian Contact ... 35
2.4.3: DMT-Like Contact ... 43
CHAPTER 3 : EXPERIMENTAL METHODS TO STUDY WEAR IN AM-AFM ... 48
3.1: HR-TEM and Blind Tip Reconstruction ... 48
3.2.1: Pull-Off Force Measurements ... 53
3.2.2: Determination of the Cantilever Physical Properties and Tip Shape ... 55
3.2.3: AM-AFM Scanning to Induce Wear ... 56
3.3: Controlling and Maintaining Force Regime ... 57
3.4: Wear Volume Calculation ... 59
3.5: Axisymmetric Arbitrary Punch Shape Solution Applied to the Arbitrary AFM Tip Shapes ... 61
CHAPTER 4 : WEAR OF SILICON NITRIDE AND DIAMOND-LIKE CARBON COATED SILICON PROBES IN AM-AFM ... 67
4.1: Estimation of the Work of Adhesion ... 70
4.2: Silicon Nitride Coated Silicon Probes ... 73
4.3: Diamond-Like Carbon Coated Silicon Probes ... 81
4.3.1: Preliminary Study of Humidity Effects ... 86
4.3.2: Reducing DLC-Coated Tip Wear by Altering AM-AFM Parameters ... 88
4.3.3: Gradual Wear Process of DLC-Coated Tips... 89
4.4: A Comparison between the Wear of Silicon Nitride and Diamond-Like Carbon... 90
4.4.1: Wear Processes Observed in DLC- and SiNx-Coated Si Tips Operating in Repulsive Mode AM-AFM ... 93
4.4.2: An Archard-Like Wear Model ... 97
4.5: Reaction Rate Theory Applied to AM-AFM ... 100
CHAPTER 5 : CONCLUSION, AND FUTURE WORK ... 110
LIST OF TABLES
Table 1: Cantilever properties and experimental parameters used for wear experiments. 68
Table 2: Material properties used in calculations of the contact properties. Silicon nitride
LIST OF ILLUSTRATIONS
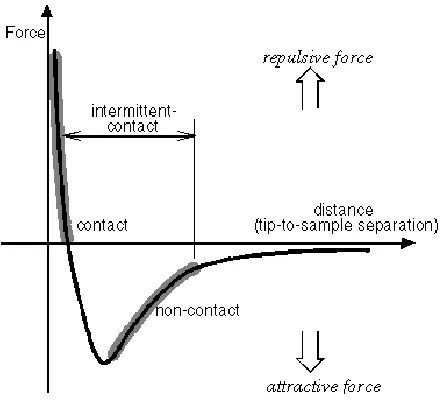
Figure 1.1: Inter-atomic force vs. distance curve. Image is taken from a Veeco
Instruments Inc. guide to scanning probe microscopy.28 ... 6
Figure 1.2: Scheme of cantilever-tip sample positions. ... 8
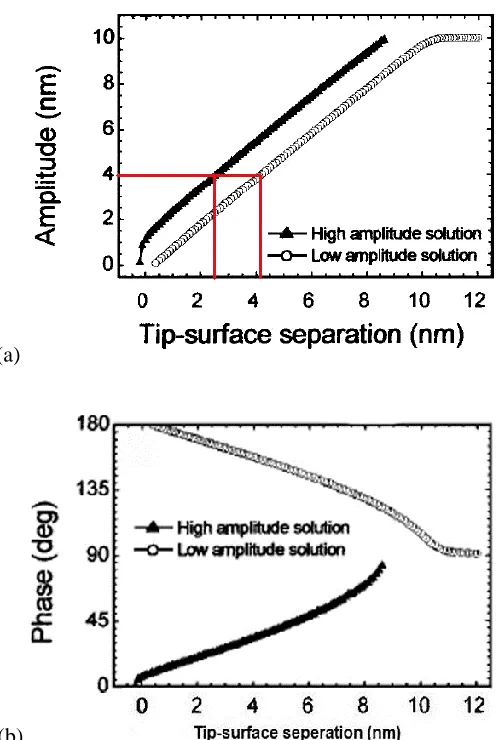
Figure 1.3: (a) Amplitude and (b) phase as a function of tip-surface separation. The
coexistence of two solutions for different tip-surface separations gi es rise to the
formation of branches. mage is ta en from arc a et al.30 ... 10
Figure 1.4: Amplitude curve (approach and retraction) taken on a UNCD sample using a
silicon tip with 24.5 nm free oscillation amplitude. The transition between the two
branches happens at different z-positions upon approach and retraction. ... 11
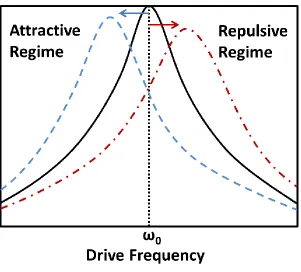
Figure 1.5: Resonance curve for a harmonic oscillator (solid black line) and under the
influence of attractive (dashed blue line) and repulsive forces (dash-dotted red line). .... 12
Figure 2.1: The Hertz/DMT normal stress distribution at the contact plotted by setting E*
= 0.75 GPa, R = 1 nm, πw = 1 J/m2, and the normal applied load equal to 3 nN. In a
DMT-like contact the normal contact stress distribution is similar to that of a Hertzian
contact with a parabolic form. The larger stress values in the case of DMT come from
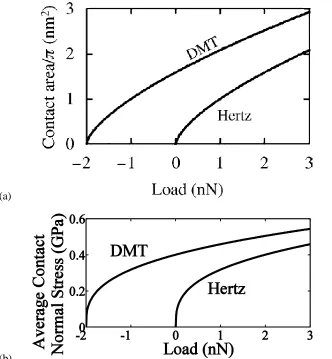
Figure 2.2: The Hertz/DMT (a) area–load and (b) average contact normal stress–load
curve plotted by setting E* = 0.75 GPa, R = 1 nm and πw = 1 J/m2. The DMT approaches
the Hertz curve in the limit w → 0 (no adhesion). n (a) adhesion increases the contact
area from the Hertz case for a given load by an amount dependent upon the range of
attractive forces. (a) is taken from Grierson et al.44 and modified to be presented here. In
(b), because of the adhesion, the contact stress is not zero at zero applied load for the
DMT case. ... 25
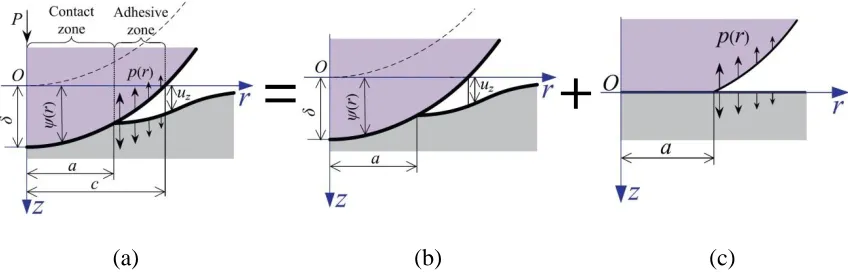
Figure 2.3: Schematic illustration of (a) an adhesive contact problem, (b) a contact
problem with displacement prescribed within the contact zone, and (c) a contact problem
with adhesive traction prescribed outside the contact. The punch is assumed to be rigid
and the half space is elastic. This picture is taken from Zhou et al.45 ... 28
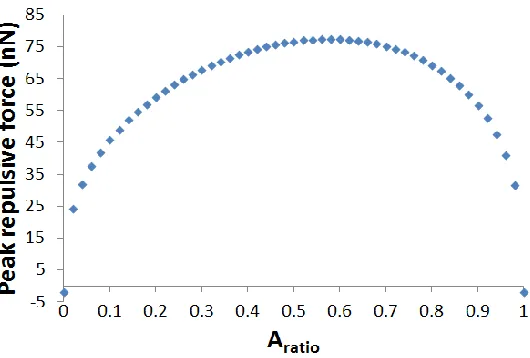
Figure 2.4: Peak repulsive force as a function of amplitude ratio for a cantilever with a
spring constant of 42 N/m, quality factor of 480, tip radius of 20 nm, reduced Young’s
modulus of 136 GPa corresponding to a diamond-like carbon-coated tip and a UNCD
sample, and free oscillation amplitude of 23 nm. ... 33
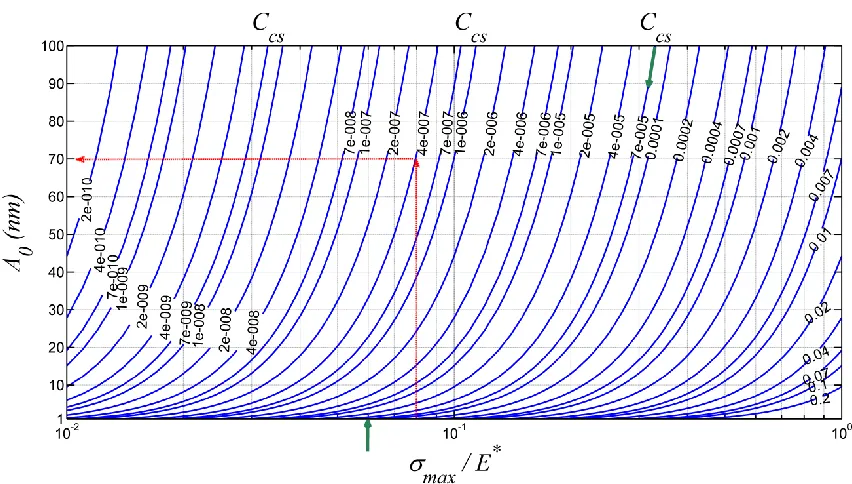
Figure 2.5: AM-AFM Hertzian contact stress map. The free oscillation amplitude is
plotted against the maximum applied stress normalized by the reduced Young’s modulus
for a variety of cantilever-sample constants ranging from 2×10⁻¹⁰ to 0.2
-3 2
nm . A vertical
red arrow denotes the normalized maximum applied stress that can be used when imaging
point with the cantilever-sample constant curve (Ccs = 4×10⁻⁷
-3 2
nm ) gives the maximum
appropriate free oscillation amplitude permitted to avoid damaging the sample/tip during
imaging. Green arrows indicate that the minimum achievable σmax/E* using a cantilever
with Ccs = 7 × 10⁻⁵
-3 2
nm with 1 nm free oscillation amplitude is 0.06. ... 40
Figure 2.6: AM-AFM DMT-like contact stress map. The free oscillation amplitude is
plotted against the dimensionless parameter H for a variety of cantilever-sample
constants ranging from 2×10⁻¹⁰ to 0.2
-3 2
nm . The map can be used to choose appropriate
cantilever and free oscillation amplitude in a particular AM-AFM experiment to avoid
tip/sample damage or plastic deformation. ... 46
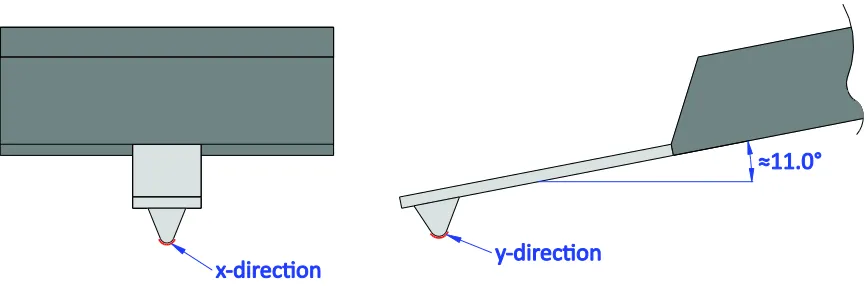
Figure 3.1: AFM probe tip x- and y-direction profiles. HR-TEM imaging is only able to
capture the y-direction profile. ... 49
Figure 3.2: Determination of the effective tip radius (along the y-direction profile, R =
Ry) by combining HR-TEM and BTR. ... 51
Figure 3.3: Flow chart illustrating the wear experiment protocol. ... 53
Figure 3.4: (a) Overlaid HR-TEM profiles of a DLC-coated tip before AM-AFM
scanning, and after completing 1, 3, 9, 21, and 45 scans. (b) Overlaid HR-TEM profiles
of a SiNx-coated tip after 9 and 21 scans, showing the height chosen for estimating
removed material. (c) Overlaid HR-TEM profiles of the same DLC-coated tip after 9 and
the horizontal as they are in the AFM. The 16° rotation is particular to these two profiles.
The angle for other profiles could be different. The rotated profiles are used for the stress
calculations. ... 60
Figure 3.5: (a) HR-TEM images of the two DLC-coated tips after 45 AM-AFM wear
scans and (b) the same images with black lines tracing the Si, red lines tracing the DLC
coating, and the yellow lines showing the direction of the worn region and the tip axis. In
the case of tip asymmetry as a result of plastic deformation of the silicon substrate, the
angle between the yellow lines should be approximately 90° because the deformation
would be coupled. ... 63
Figure 3.6: (a) Profile of an AFM tip apex with a fitted circle, R = 17 nm. (b) Right
profile, left profile (mirrored), and the average profile of the tip apex, used for
constructing the three different axisymmetric tip shapes. ... 65
Figure 3.7: Normal stress distribution at the contact of the left, right, and average profiles
of the tip apex and the fitted circle in Figure 3.6 for (a) 10 and (b) 100 nN normal loads.
... 66
Figure 4.1: HR-TEM images of the SiNx-coated silicon tips before any AFM imaging and
after completing 1, 3, 9, 21, and 45 AM-AFM images on the UNCD sample. (a) and (b)
correspond to two tips with different free oscillation amplitudes, A0, and amplitude ratios,
Figure 4.2: Tip radius estimated for the SiNx-coated tips by BTR from the height images’
fast scan direction (Rx), and combined HR-TEM and BTR of the height images’ slow
scan direction (Ry). ... 75
Figure 4.3: Peak repulsive forces calculated for the SiNx-coated tips based on the tip radii
estimated by BTR from the height images’ fast scan direction (Rx), and combined
HR-TEM and BTR of the height images’ slow scan direction (Ry). Peak repulsive forces are
also calculated using VEDA for verification. ... 76
Figure 4.4: Average elastic normal stress calculated for the SiNx-coated tips based on the
tip radii estimated by BTR of the height images’ fast scan direction (Rx), combined
HR-TEM and BTR of the height images’ slow scan direction (Ry), and the actual tip profile.
... 78
Figure 4.5: Wear volume of the SiNx-coated tips as a function of number of taps. ... 80
Figure 4.6: Number of taps to remove or plastically displace one atom of the SiNx-coated
tips as they wear out. ... 80
Figure 4.7: HR-TEM images of the three DLC-coated silicon tips before any AFM
imaging and after completing 1, 3, 9, 21, and 45 AM-AFM images on the UNCD sample.
(a), (b), and (c) correspond to three tips with different free oscillation amplitudes, A0, and
Figure 4.8: Tip radius estimated for the DLC-coated tips by BTR from the height images’
fast scan direction (Rx), and combined HR-TEM and BTR of the height images’ slow
scan direction (Ry). ... 84
Figure 4.9: Peak repulsive forces calculated for the DLC-coated tips based on the tip radii
estimated by BTR from the height images’ fast scan direction (Rx), and combined
HR-TEM and BTR of the height images’ slow scan direction (Ry). Peak repulsive forces are
also calculated using VEDA for verification. The data point after 21 scans of the Tip 1 is
not shown as the DLC coating is completely removed after this. ... 84
Figure 4.10: Average elastic normal stress calculated for the DLC-coated tips based on
the tip radii estimated by BTR of the height images’ fast scan direction (Rx), combined
HR-TEM and BTR of the height images’ slow scan direction (Ry), and the actual tip
profile. The data point after 21 scans of the Tip 1 is not shown as the DLC coating is
completely removed after this. ... 85
Figure 4.11: Wear volume for the DLC tips as a function of number of taps in a mixture
of air and nitrogen gas with 15% RH. The standard error of the measured wear volume is
negligible in compare to the wear volume itself and hard to be seen. The data point after
21 scans of the Tip 1 is not shown as the DLC coating is completely removed after this.
The wear volume of the Tips 2 and 3 in less than 5% (dashed line) and in 40%
Figure 4.12: Number of taps to remove one atom of the DLC-coated tips as they wear
out. The data point after 21 scans of the Tip 1 is not shown as the DLC coating is
completely removed after this. The relative humidity up to 45th scan is 15%. ... 89
Figure 4.13: High magnification HR-TEM images of the tip apices before any scanning,
and after 45 scans. The roughness change of the SiNx-coated tips can be observed in the
images after 45 scans. The roughness values measured over 20 nm-wide profiles of the
tip apices also show a decrease in the roughness of the DLC-coated tip and an increase in
the roughness of the silicon nitride-coated tips... 95
Figure 4.14: Wear/plastically deformed volume as a function of number of taps
multiplied by peak repulsive force. ... 99
Figure 4.15: The atom transfer from tip to the sample is simulated by a double-well
potential. Δ act is the energy barrier that should be overcome by the tip atom to transfer
from initial to final equilibrium state. ... 102
Figure 4.16: A possible atomic-scale schematic of the thermally activated process for
atom transfer in AM-AFM. Here, both the initial and activated states could happen in
state (b) or (c). The activated state is when the tip atom coordination state is lowered
enough to be removed by the bond/s made with the sample atom/s. ... 102
Figure 4.17: Calculated reaction rates plotted as a function of average normal stress for
Chapter 1
: Introduction
Since its revolutionary invention in 1986 by Binnig et al.,1 the atomic force
microscopy (AFM) has been one of the most powerful tools in nanotechnology. It has
been widely used for atomic-scale studies of chemical, biological, and engineering
materials, and has opened major opportunities for the advancement of nanoscale science.
AFM has three primary operation modes for obtaining topographic images and material
property measurements of samples: contact mode, non-contact mode (sometimes called
frequency modulation AFM – FM-AFM), and intermittent-contact or amplitude
modulation AFM (AM-AFM, also known as tapping mode AFM), where the latter two
involve an oscillating cantilever. Over the last decade, AM-AFM has become the most
popular imaging mode because of its minimal interaction with the sample, its relative
ease of use, and its ability to obtain high resolution images of materials. More recently,
the use of oscillating probes has emerged in industry as a tool to facilitate nanoscale
lithography, patterning, manipulation, surface characterization, and metrology.2–7
The mechanics of AM-AFM have been widely investigated by researchers since
being introduced in 1987 by Martin et al.8 Most of these studies have focused on
understanding the dynamics of AM-AFM. Tip-sample interactions due to van der Waals
forces, capillary forces, etc. have also been studied broadly, although there are aspects of
tip-sample interactions still not yet fully understood. Continuum contact mechanics
models such as the Hertz,9 Johnson-Kendall-Roberts (JKR),10 and
the tip-sample interface. These models assume, among other things, that the tip
terminates in a paraboloidal shape. Clearly, for an arbitrary punch shape, as in the case of
AFM tips, a more general approach is necessary to precisely capture the mechanics of
interaction. While such continuum mechanics models could be inaccurate when applied
to nanoscale geometries, they can give reasonable values in several cases depending on
the atomic structure of the tip and sample (according to Luan and Robbins12).
Considering the lack of a general atomistic method and the unknown atomic structure of the tip and surface, continuum models are a significant improvement over existing state-of-the-art which often does not even address stresses in the contact during AM-AFM.
1.1: Overview of the Importance of Wear
One of the major limitations for AFM is probe-tip blunting as a result of
nanoscale wear. Wear is also problematic for soft samples, such as polymers and
biological materials, which are of great interest for interrogation by AFM, as they
typically possess nanoscale structural features not easily accessible by other material
characterization methods. Wear of both sample and tip during contact mode imaging has
been examined in multiple studies, although it is yet to be fully understood.13–18
AM-AFM was invented in part to reduce the problem of wear by nearly eliminating shear
stresses acting on the tip due to sliding (intrinsically present in contact mode imaging),
and reducing the total amount of time the tip interacts strongly with the sample. However,
these advantages could be offset by the high frequency of the cantilever oscillations,
Having many cycles of interaction is not intrinsically a problem by itself; however, the
effect of any gradual process such as atom-by-atom removal or dislocation movement can
scale up as a result. Therefore, tip wear can still be a limiting and costly factor in
AM-AFM. Consequently, users often have to periodically replace probes to maintain high and
consistent imaging resolution. A changing tip makes quantitative analysis of tip-sample
interactions and sample property measurements challenging since tip-to-tip variations in
shape and surface composition can be substantial.
Despite the importance of wear in AM-AFM as well as in other oscillating-probe
applications, there are limited systematic studies on the phenomenon of tip wear itself. This motivates the present study, which is focused on developing and deriving novel insights from a new method for a controlled wear studies with accurate determination and control of the tip-sample interaction forces and the resulting stresses.Another motivation is application-driven. In tip-based nanomanufacturing and metrology, which can involve AM-AFM operation of the probe, wear must be avoided for the process to be commercially viable. Silicon as a common material utilized in microelectromechanical
systems, which is also widely used to make sharp AFM tips, wears out rapidly at the
nanoscale.14–16 More wear-resistant materials such as ultrananocrystalline diamond
(UNCD)19 and silicon carbide, for example, are potential candidates to replace silicon.
Understanding wear mechanisms will provide guidance for developing new
wear-resistant materials.
these mechanisms could exist in both contact mode and AM-AFM. However, how these mechanisms occur and which one(s) dominates strongly depends on the stress state and the nature of tip-sample interactions at the contact. In contact mode, tip wear occurs during sliding and is influenced by the magnitude of stresses in the contact and the nature of the interfacial interactions. The causes of wear in AM-AFM can be quite different. While interfacial shear stresses are significantly reduced, the effects of cyclic loading and impact, uniquely related to repeated contact formation and breakage of AM-AFM, and the potential for excursions to high compressive stresses may lead to distinct types of wear processes compared with contact mode AFM.Besides tip wear, tip contamination is also an important issue when it comes to reliable application of AFM15,23–27 but that requires a different comprehensive approach than what is discussed here.
1.2: Amplitude Modulation Atomic Force Microscopy
In AM-AFM, a cantilever is excited at or near its primary flexural resonance
frequency by a piezoelectric actuator. When far from the sample, the oscillation
amplitude is called the free amplitude, A0; while approaching the sample, the oscillation
amplitude reduces as a result of tip-sample interaction. During approach, the amplitude
continues to reduce until it reaches a value set by the user. This designated amplitude is
called the amplitude setpoint or tapping amplitude, A. While scanning a surface, the
oscillation amplitude tends to change as a result of interacting with topographic features.
The AFM feedback loop monitors the oscillation amplitude and keeps it constant by
precision to which the amplitude setpoint is maintained, is therefore determined by the
feedback loop. During scanning, the variation of the material properties depending on its
magnitude could create artifacts in the topography image. Some of these artifacts come
from different tip-sample deformation, adhesion, viscoelasticity, and roughness at the
contact. Some of the changes in material properties are mainly observable in the phase
image.
In AM-AFM, as the tip approaches and then retracts from a surface during a
tapping cycle, it experiences two different force regimes (Figure 1.1): when far from the
sample’s surface, the tip experiences long-range attractive forces, mainly as a result of
the an der Waals interaction with the sample; when close to the sample’s surface, the tip
experiences short-range repulsive forces as a result of Pauli and electrostatic repulsion,
and strong short-range attractive forces as a result of metallic, covalent, ionic, or
hydrogen bonding interactions for example. Capillary interactions can also contribute to
attractive forces over intermediate separation ranges. The maximum repulsive (i.e.,
normal) force is experienced by the tip during contact when it reaches its farthest distance
away from its equilibrium position. Finally, the cantilever begins to pull it away from the
sample. Then, the same sequence of the tip-sample force regimes are passed through in
Figure 1.1: Inter-atomic force vs. distance curve. Image is taken from a Veeco Instruments Inc.
guide to scanning probe microscopy.28
To understand the physics of AM-AFM, one needs to consider the dynamic
behavior of an oscillating cantilever as well as the tip-sample interaction. Researchers
have frequently simulated the dynamic response of the AFM cantilever as a
point-mass-spring model with one degree of freedom, driven by an external sinusoidal signal. The
equation of motion includes the contribution of the cantile er’s elastic response, the
hydrodynamic damping due to the medium, the tip-sample interaction, and the excitation
2
eff 0
eff 2 ts drive
m
d z( t )
dz
m
kz
F
F
cos( t )
dt
Q
dt
.(1.1)
where z is the instantaneous tip displacement, meff is the cantilever effective mass, k is
the cantile er’s spring constant, ω0 is the angular resonance frequency, Q is the quality
factor, Fts is the tip-sample interaction force, Fdrive is the driving force amplitude, and ω is
the angular frequency of the driving force. The use of cantilever effective mass instead of
actual mass originates from that fact that the cantilever body does not oscillate with the
same amplitude along its full longitudinal length. The effective mass is calculated to be
33 m
140 , where m is the cantile er’s real mass, and is arrived at by equating the kinetic
energy of the oscillating cantilever to that of the lumped-mass model. Care should be
taken while using this equation as it ignores the contribution of the higher harmonics in
the cantilever motion. This simplification does not create a fundamental problem
simulating AM-AFM as the cantilever is operated at or near its first harmonic. Changes
in the hydrodynamic damping of the cantilever during its motion are neglected in this
modeling.29
The tip-sample interaction can be expressed by the following equation. The
attractive forces arise from van der Waals interactions and the DMT contact model
forfor
c 0 2
c
ts c 3
* 2
0 c c 0
2 0
HR
z z a
6 z z
F ( z ,z )
HR 4
E R( a z z ) z z a
6a 3 , where 2 2 t s * t s
1 ( 1 ) ( 1 )
E E E
(1.2)
where H is the Hamaker constant, R is the tip radius, (z + zc) is the instantaneous
tip-sample separation, a0 is the intermolecular distance, Et and Es are Young’s moduli for the
tip and sample, and νt and νs are Poisson’s ratios for the tip and sample.29 zc and z are
shown in Figure 1.2.
Figure 1.2: Scheme of cantilever-tip sample positions.
Numerical simulations of the cantilever response using the above equation of
presence of both attractive and repulsive interactions and their nonlinear character creates
two stable oscillation states (Figure 1.3). These oscillation states are called the high
amplitude solution or repulsive regime, and the low amplitude solution or attractive
regime. If the average force experienced by the tip during a cycle is attractive (negative),
the cantilever operates in the low amplitude state. On the other hand, if the average force
is repulsive (positive), the cantilever oscillates in the high amplitude state. In other words,
there are two tip-surface separations that can attain the same stable tapping amplitude
(a)
(b)
Figure 1.3: (a) Amplitude and (b) phase as a function of tip-surface separation. The coexistence
of two solutions for different tip-surface separations gives rise to the formation of branches.
Image is taken from arc a et al.30
Transitions between these states are affected by the deterministic character of the
equation of motion, the presence of perturbations (noise), and the basins of attraction of
the two tapping states.30 The basins of attraction refer to the two regions of the tip motion
attraction of an oscillating state dominates the phase space, it is unlikely that the
perturbations trigger a transition to the other state. However, if both states contribute
nearly equally in the phase space, the presence of noise can create instability and frequent
transitions between the states. In other words, the deterministic character of the equation
of motion implies that once a stable state is reached, the tip should oscillate indefinitely
there. However, a perturbation could disturb the tip motion by introducing new initial
conditions.31 These transitions are shown from actual experimental data obtained here in
Figure 1.4.
Figure 1.4: Amplitude curve (approach and retraction) taken on a UNCD sample using a silicon
tip with 24.5 nm free oscillation amplitude. The transition between the two branches happens at
In addition to the oscillation state, attractive and repulsive regimes shift the
resonance frequency of the cantilever (Figure 1.5). The effective resonance frequency of
a cantilever interacting with a surface can be approximately calculated by
1 2
ts e
eff k ( dF / dz )
m
.
(1.3)
The approximation comes from the assumption that the tip-sample interaction
potential is parabolic.
Figure 1.5: Resonance curve for a harmonic oscillator (solid black line) and under the influence
The shift in resonance frequency is responsible for the amplitude reduction that
occurs when the cantilever approaches the surface and for the presence of two
steady-state solutions in AM-AFM. As the cantilever is oscillated at a fixed frequency near or
equal to its resonance frequency, the shift in resonance frequency moves the oscillation
off resonance, resulting in amplitude reduction. If the oscillation is dominated by the
attractive force or the repulsive force (which is dependent on the tip-sample separation),
the resonance frequency shifts lower or higher, respectively (Figure 1.5).
1.3: Previous Studies of Wear in AM-AFM
Existing studies of the wear of AM-AFM probes to date involved experimental investigations of wear reduction by using different tip materials32,33 or by controlling the AM-AFM parameters,34 and modeling wear as a thermally activated process.35 Su et al.34
showed that operating in hard tapping regime with a relatively low amplitude ratio
(tapping amplitude divided by free oscillation amplitude) has the advantage of reducing
tip wear and increasing the scanning speed as opposed to operating with a high amplitude
ratio (i.e., close to free amplitude). They also found that by decreasing the amplitude
setpoint the interaction force goes through a maximum and then reduces as the low
amplitude setpoint is approached. This implies that 50-60% oscillation damping is the
most damaging condition as the tapping velocity is maximum. They verified this by
sample with hard and sharp features. With the relative amplitude setpoint equal to 0.5,
they demonstrated faster tip wear observable through degradation of lateral resolution in
the topographic image. This work sheds light on some of the experimental parameters affecting tip wear. However, it does not explain the wear process in a quantitative and predictive way, since the tip geometry, the tip-sample deformation, and the attractive/repulsive force regimes are not included in the analysis.
Bassani and D’Acunto35
performed analytical modeling of wear in AM-AFM.
They considered wear as an irreversible atom-by-atom mass transfer from the sample to
the tip as a result of adhesive interactions. The tip-sample interaction was modeled as a
double-well potential, and mass transfer was treated as a transition between the two
potential wells. They calculated wear volume as an exponential function of the energy
barrier, and predicted that the wear rate of a single atomic volume in the model depends
on an Arrhenius rate law, which describes a thermally activated wear process. This model
represents an important first step since previously such effects on the process of material
removal had not been modeled from an atomistic point of view. However, the model
neither considers atoms that can move from the tip to the sample, nor does it consider
diffusion of atoms from one region of the tip (or the sample) to another region without
transferring across the interface. In addition, the model does not take into account the
elastic deformation of the tip and sample, and that mass transfer can occur via removal of
clusters of atoms instead of single atoms. Although these complex issues are not
addressed, this model is useful because it introduces a framework for modeling gradual
parameters like contact stresses and radius that promote and determine the reaction rate
besides the adhesion.
To highlight the key issues one might encounter and should take into account
while studying wear in AM-AFM, in the following chapters we first discuss available
analytical models to estimate contact forces and stresses, and propose methods to apply
them accurately by discussing parameters that may affect the results. We then explore the
manifestation of these calculations in practice and examine the influence of the various
parameters involved by performing wear experiments with different probes as a function
Chapter 2
: Mechanics of the Tip-Sample Interaction
Quantification and control of the interaction forces and the resulting stresses on
the tip are crucial for AFM tip wear studies. As discussed previously, the maximum
repulsive normal force is experienced by the tip during contact when it reaches its farthest
distance away from its equilibrium position (i.e. cantile er’s rest position). At this point
of highest normal stress and overall strain energy, the tip has the greatest potential to
become damaged. Therefore, the most relevant interaction force for studying AM-AFM
wear is the peak repulsive force.
2.1: Attractive Mode Imaging and Wear in AM-AFM
Although in attractive mode measurements, wear could potentially occur by
atoms being pulled off from the tip, the long-range attractive forces at play are typically
small compared to forces needed to break bonds. In a study by Tello et al.36 it was
demonstrated that repeated imaging of cobalt nanoparticles in attractive mode did not
change the height and width of the particles while imaging in repulsive mode
permanently changed their height. Although in this study, the contact forces and stresses
were not controlled in the repulsive regime imaging to avoid sample deformation, it
confirms that forces in attractive regime are not significant enough to cause any form of
Here, one might question why all the AM-AFM experiments are not done in
attractive regime to avoid any tip/sample wear and deformation. There are several issues
that make imaging in attractive regime either impossible or undesirable. As mentioned
before, in attractive regime imaging the attractive forces dominate repulsive forces. In a
lot of cases depending on the tip and sample elastic properties, cantile er’s physical
properties, and AM-AFM experimental settings, the range of amplitude ratios that
attractive forces dominate repulsive forces is very short. Sometime even the attractive
regime does not exist and the tip-sample interaction jumps into the repulsive mode as
soon as the interaction begins. This short range of amplitude ratio’s ma es stable imaging
(i.e. effectively tracking of the sample features and avoiding bi-stability) very difficult
(Figure 1.4).
In the cases that there is a wide range of amplitude ratios where the tip-sample
interaction is in attractive regime, the tip broadening37 (i.e. showing the features wider
than their real size because of the fact that attractive forces are long-range. This is in
addition to the effect of the tip finite size on the sample’s features size which will be
discussed in section 3.1) or losing track of the surface makes attractive imaging in a lot of
cases undesirable. Losing track of the surface can cause image artifacts and out of control
impact of the tip with surface resulting in the tip damage.34 This problem arises from the
fact that the transient time for amplitude error to reach equilibrium exponentially
increases as the amplitude ratio approaches 1, which is required for attractive imaging in
falsely interpreted as the sample features resulting in the losing track of the surface by the
control system.34
In the following section, a literature review of the current techniques used to
quantify tip-sample forces in AM-AFM will be discussed.
2.2: Peak Repulsive Force
Measuring the normal force acting on a tip is rather complicated in AM-AFM due
to the dynamic and nonlinear tip-sample interactions, compared to the same measurement
performed in contact mode. Several studies examining tip-sample interactions in
AM-AFM have attempted to resolve this issue.38–41 However, to date, a straightforward
technique which is accurate over the entire range of tip-sample separations and can be
used directly during the course of AM-AFM experimentation has not been established.
Below we review a force inversion technique proposed by Katan et al.38 which uses the
amplitude- and phase-distance curves acquired from approaching to and retracting from
the sample surface to estimate force as a function of the tip-sample separation distance.
We also discuss a closed-form analytical solution proposed by Hu et al.40 which estimates
peak repulsive force as a function of the cantilever and sample physical properties and
experimental settings.
Katan et al.38 extended a force inversion technique primarily derived for
frequency modulation atomic force microscopy by Sader et al.42 to AM-AFM. This
requires one to obtain data for the amplitude and phase as a function of the tip-sample
separation distance. Although this technique does not require any information to be
provided regarding the tip geometry and solely depends on the experimental
measurements of the phase and amplitude as a function of z-motion, it is quite sensitive
to small offsets of the phase data and miscalculates the interaction force in cases where
the tip-sample interaction stiffness exceeds the cantilever stiffness.39 In addition, it cannot
be used in a straightforward, real-time manner by an AFM user during an experiment.
Specifically, the interaction force cannot be deduced from the phase and amplitude
images alone, as such images are acquired at a nominally fixed tip-sample distance.
Rather, data corresponding to a range of tip-samples distances are required for the
application of this method. These challenges make this technique unsatisfactory for the
purpose of monitoring forces during wear studies.
Hu et al.40 proposed closed-form equations for peak attractive and repulsive
interaction forces derived from applying a nonlinear, dynamical one-term
harmonic-balance method to the point-mass model. These equations are accurate over a wide range
of experimental parameters, including various environments such as vacuum and air.
Having closed-form equations to calculate peak interaction forces would be convenient
for AFM users. However, these equations are limited to cases where the tip remains
paraboloidal, and requires that the tip radius be accurately measured experimentally.
In the present work, the peak repulsive force experienced by our AFM tips in
wear studies are estimated using equations developed by Hu et al. Given the importance
independent techniques: high-resolution transmission electron microscopy (HR-TEM)
and blind tip reconstruction (BTR). This requires interrupting the AFM experiment, removing the tip from AFM, transporting to the TEM, taking back to the AFM after TEM imaging and so on. This is a time-consuming, delicate, and fairly onerous task which affects throughput; however, it is necessary to accurately estimate the forces and stresses and calculate the wear volume. The procedure for quantifying the tip shape with these
two techniques will be discussed in Section 3.1.
In determining the peak repulsive forces, we have assumed the DMT model.11
Justification for the choice of a DMT contact model will be given in Section 4.1. The
equation of motion of the point-mass spring model (Eq. (1.1)) and Eq. (1.2) to describe the tip-sample forces are used to predict peak repulsive force using asymptotic theory of
the periodic averaging. In this theory, the driving, interaction, and damping forces are
assumed to be small perturbations to an undamped harmonic oscillator. Then, the
time-averaged effects of the forces and the frequency detuning between drive and oscillator
resonance frequencies are used to determine the response of the harmonic oscillator. All
the assumptions used for the DMT contact model described in the section 2.2 apply to the
derivation of the following equation. Also, it is assumed that Fts/k and Fdrive/k are very
small and negligible in compare to the tip oscillation amplitude.40 Given the DMT contact
1
1 1 3 3 9 9
rep 8 4 4 * 4 4 8 8
peak 0 ratio
3 4 2
2 2 2 2 2
2 ratio
adhesion
F 2 3 E R k Q A A
1
1 Q 1 Q
A F 2 , (2.1)
where E* is the reduced Young’s modulus, R is the tip radius, k is the cantilever spring
constant, Q is the cantile er’s quality factor for the primary flexural mode, A0 is the free
oscillation amplitude, Aratio is tapping amplitude A divided by A0, Ω is drive frequency ω
divided by resonance frequency of the primary flexural mode ω0, and Fadhesion is the
adhesion force.40 All the above mentioned parameters except adhesion force are
discussed in Chapter 1. Here, Fadhesion is also calculated using the DMT model:
adhesion
F
2 wR
.(2.2)
where w is the work of adhesion, which is determined independently by performing
pull-off force measurements using tips of the same type from the same vendor, i.e.,
composed of the same material as the tips studied in the wear experiment. This is
described in section 3.2.1.
To verify the accuracy of the equation, one can use an online tool developed by
Melcher et al.41, provided by http://nanohub.org, and called the Virtual Environment for
differential equation of a thin cantilever beam to construct amplitude and phase approach
curves and to calculate the peak repulsive/attractive forces for a given set of experimental
parameters. It also provides a more accurate estimation of forces since it does not involve
the same mathematical approximations used to derive Eq. (2.1).
2.3: Contact Mechanics Model and Average Normal Stress
Before calculating interaction forces and stresses in any contact mechanics problem, an appropriate model needs to be chosen. In AM-AFM, initially one needs to investigate if the tip-sample impact can be considered to be quasi-static. If the impact is quasi-static, then the well-developed contact mechanics models derived for static contact problems can be safely applied to AM-AFM. According to Johnson, dynamic effects of an impact can be ignored or assumed to be quasi-static if the contact time is either short or long compared with the time required for the elastic wave to travel back and forth through the impacted object.9 The next paragraphs examine the suitability of this assumption in AM-AFM contact mechanics.
object. Therefore, the quasi-static assumption for our dynamic problem in AM-AFM is valid and allows for the use of static contact mechanics models to describe the stress distribution in the vicinity of the contact area ignoring the inertial effects.
In contact mechanics models, it is normally assumed that the tip and sample are
composed of homogeneous, isotropic, linear elastic materials, and that the tip shape is a
paraboloid. It is also assumed that deformations in the surface and tip are small compared
to the contact radius, which in turn is small compared to the tip’s radius of cur ature. One
then needs to calculate the Maugis parameter, λ, and the non-dimensional load, P, and use the adhesion map proposed by Johnson and Greenwood43 to select the proper contact
mechanics model. The Maugis’ parameter, λ, and the non-dimensional load, P, are calculated as follows:43
1 2 3
2 3 0
1 16
.
Rw
*E z
,(2.3)
P P
wR
.(2.4)
where z0 is the equilibrium separation and P is the normal load, which in this case is the
peak repulsive force. As will be shown in the section 4.1, our tip and sample interaction
In a DMT-like contact the normal contact stress distribution is similar to that of
Hertz theory and has a parabolic form (Figure 2.1). However, including the adhesion between the contacting bodies results in larger stress values and contact area (Figure 2.1 and Figure 2.2(a)). Also, at zero applied load, the contact area and stresses are not zero in a DMT-like contact (Figure 2.2).
Figure 2.1: The Hertz/DMT normal stress distribution at the contact plotted by setting E* = 0.75
GPa, R = 1 nm, πw = 1 J/m2, and the normal applied load equal to 3 nN. In a DMT-like contact
the normal contact stress distribution is similar to that of a Hertzian contact with a parabolic form.
The larger stress values in the case of DMT come from adding the adhesion force to the normal
(a)
(b)
Figure 2.2: The Hertz/DMT (a) area–load and (b) average contact normal stress–load curve
plotted by setting E* = 0.75 GPa, R = 1 nm and πw = 1 J/m2. The DMT approaches the Hertz
curve in the limit w→ 0 (no adhesion). In (a) adhesion increases the contact area from the Hertz
case for a given load by an amount dependent upon the range of attractive forces. (a) is taken
from Grierson et al.44 and modified to be presented here. In (b), because of the adhesion, the
contact stress is not zero at zero applied load for the DMT case.
Using DMT model, the average normal stress, when the tip is at its farthest
2
1 * 3
norm rep 3
avg peak adhesion
1 4E F F 3R . (2.5)
Comparing this equation with Eq. (2.1), one can recognize that the dependence on tip radius is stronger in the stress calculation as compared to the repulsive-force
calculation. In Eq. (2.1), R is raised to the power of 1/8, while in Eq. (2.5) R is raised to -5/8 (= -2/3 + (1/8)(1/3)), a factor of 5 larger. It should be mentioned that the values of the
force and stress are dominated by the first terms in Eq. (2.1) and (2.5); therefore, the dependence of the second term, Fadhesion/2, on R does not significantly contribute to the
calculation of the force and stress. This shows how errors in the determination of the tip
geometry (or deviation of the tip shape from paraboloidal) can greatly influence the stress
calculation. As will be demonstrated in the following HR-TEM images, AFM tips are not
always simple spheres or paraboloids and can have nanoscale roughness. Additionally,
they are often not axisymmetric. Thus, imposing contact mechanics models that assume a
simple tip shape can introduce significant errors in the calculation of the stress.
To mitigate this issue, in the present work, the average normal stress and
correspondingly the contact radius and deformation are also calculated numerically by
solving a general contact mechanics model proposed by Zhou et al.45 for the adhesive
contact of arbitrarily shaped axisymmetric punches described in the following section and
2.3.1: Average Normal Stress of an Axisymmetric Arbitrary Punch Shape
As the AFM tip apices are not always simple smooth paraboloids, it is important
to consider the difference between the stress calculated by simply fitting a paraboloid to
the tip apex and the stress calculated using a line fit to the actual tip profile. As
mentioned earlier, we use the solution presented by Zhou et al.45 for an axisymmetric
arbitrary punch shape. All the classic contact mechanics models, including Sneddon’s and
Boussinesq’s solutions, are special cases of the proposed solution. To solve this adhesive
contact problem (Figure 2.3(a)), Zhou et al. superpositioned two contact problems with different boundary conditions. One of the contact problems was a rigid punch pushing
against an elastic half space with displacement prescribed inside the contact zone similar
to that of a Hertzian contact (Figure 2.3(b)). For this problem, the normal stresses inside the contact zone and the normal stresses and the displacements outside the contact zone
were sought. In the second contact problem, adhesive traction was prescribed outside the
contact zone (Figure 2.3(c)) and the expressions for the normal stresses inside and the displacements outside the contact zone were derived. The second problem is similar to
=
+
(a) (b) (c)
Figure 2.3: Schematic illustration of (a) an adhesive contact problem, (b) a contact problem with
displacement prescribed within the contact zone, and (c) a contact problem with adhesive traction
prescribed outside the contact. The punch is assumed to be rigid and the half space is elastic. This
picture is taken from Zhou et al.45
The general solution of an adhesive contact problem with an axisymmetric
arbitrary punch shape by Zhou et al. is summarized in the following equations. The
displacement components and the radial and tangential stress components at the contact
are not presented here as they are not used in this thesis.
,
(2.6)
,
.
(2.8)
where δ is the rigid-body displacement, a is the contact radius, f(t) is the shape function
of the axisymmetric punch, t is the integration variable representing the radial position, ν
is the Poisson’s ratio, µ is the shear modulus, p(t) is the adhesive interaction force
function, σzz is the normal stress distribution, r is the radial position at the contact, χ is
another integration parameter to represent radial position at the contact, and P is the
applied normal load. To utilize these equations, the term p(t) is set to zero because of the
fact that there is not a straightforward way to accurately determine the adhesive function
for the AFM tips. Instead, the adhesion force is added to the peak repulsive force as is
done for the Hertz model to lead to the results for the DMT model. Although here we are
applying this concept to the arbitrary tip profiles which are not necessarily paraboloidal,
it is the most straightforward approach currently available. By setting p(t) to zero Eqs.
(2.6) to (2.8) will be reduced to the following equations. Using these equations, one can
easily derive the Hertzian solution by replacing f(r) with the equation of a parabola,
r2 f r2R
.
,
,
(2.10)
.
(2.11)
To apply this solution to the more complicated AFM tip shapes, one needs to
determine the correct orientation of the AFM tip’s profile with respect to the sample, and
the approximate region in the profile that makes the initial contact with the sample. Also,
the AFM tip profiles are not necessarily axisymmetric imposing another challenge in the
application of Zhou et al. solution to AFM tips. These issues and how to address them are
described in section 3.5.
2.4: Mapping Stress and Selection of AM-AFM probe and Free Oscillation
Amplitude
The advantage of minimizing the sample-tip interaction in AM-AFM compared to contact mode AFM can be lost if one selects experimental settings (i.e. free oscillation amplitude, A0 and amplitude ratio, Aratio) that result in the contact stresses beyond the
experimental parameters to ensure that contact stresses are sufficiently low to prevent failure.
In this section, we simplify Eqs. (2.1) to (2.5) for two objectives. First, with a simpler closed-form equation, one will be able to then more easily choose free oscillation amplitude, which is the most critical parameter controlling tip/sample wear and permanent deformation. Second, this simplification will be used to plot stress maps. These maps will be used to reveal the achievable range of contact stresses for a particular tip and sample, guiding one in choosing the appropriate probe for a particular AM-AFM experiment.
2.4.1: Peak Repulsive Force: Assumptions and Dependence on Amplitude
Ratio
An AM-AFM experiment involves two distinctive steps: approaching the sample,
and then scanning it. We briefly discuss approaching the tip to the sample as this imposes
a constraint to the calculation of the maximum possible normal contact stress. Before
approaching the sample, the primary flexural resonance frequency of the cantilever is
determined. The cantilever is then excited at a fixed drive frequency at or near this
measured resonance frequency. Subsequently, the sample is brought closer to the tip,
either through moving the sample up or the probe chip down. As the approach continues,
the oscillation amplitude decreases as a consequence of a shift in resonance frequency
and increased damping. Both the shift in the cantilever resonant frequency and increased
oscillation amplitude reaches a predetermined value, usually referred to as the set-point
amplitude/tapping amplitude, defined by the user.
is an important parameter to take into account in the following calculations to estimate the maximum possible contact stress.
Figure 2.4: Peak repulsive force as a function of amplitude ratio for a cantilever with a spring
constant of 42 N/m, quality factor of 480, tip radius of 20 nm, reduced Young’s modulus of 136
GPa corresponding to a diamond-like carbon-coated tip and a UNCD sample, and free oscillation
amplitude of 23 nm.
Before proceeding to the next section, the following important assumptions used in the subsequent analytical expressions will be listed. First, we assume that the tip-sample contact is either Hertzian or DMT-like. Therefore, if the contact cannot be described by the Hertz or DMT contact mechanics model, the results here will not be accurate and one should seek other means such as VEDA to calculate relevant forces.
formation in AM-AFM that can be used to account for the additional stresses caused by the formation of a capillary. Through friction force microscopy, it has been shown that the time required for capillary meniscus nucleation between the sample and tip at 40% relative humidity (RH) is on the order of few milliseconds.46 However, in typical AM-AFM experiments, the contact time is on the order of a few microseconds; in the experiments performed in this thesis, contact time ranges from 0.1 to 0.2 μs. Because of the short contact times and the strong dependence of water condensation on RH,47 Sahagún et al.48 concluded that in AM-AFM, capillary bridges only form when the RH exceeds 50%.
Therefore, the capillary forces are not accounted in the estimation of forces and stresses in this thesis. Under these assumptions, we consider the Hertzian and DMT-like contacts separately in the following sections.
2.4.2: Hertzian Contact
2.4.2.1: Non-Dimensionalization of the Maximum Contact Stress
When one considers the contact to follow Hertzian behavior, the adhesion force is
ignored. Therefore, we just use the first term of the Eq. (2.1) to calculate the peak repulsive force. In a Hertzian contact, the maximum normal stress is located at the center
of contact and can be calculated through:
2 1
* 3
rep 3
max peak
3 4E
F
2 3R
,
(2.12)
Notice that Eq. (2.12) is different from Eq. (2.5), which gives the average stress in the contact, through an additional pre-factor of 3/2. By plugging in the Eq. (2.1) with