GSJ: Volume 6, Issue 7, July 2018, Online: ISSN 2320-9186
www.globalscientificjournal.com
ESTIMATION OF SHELF LIFE USING
ACCELERATED SHELF LIFE
TEST
(ASLT) METHOD ARRHENIUS MODEL ON SHEET NILE
TILAPIA JERKY
Felisha Gitalasa, Iis Rostini, and Rusky Intan Pratama
Laboratory of Fisheries Processing Product, Padjadjaran University, Indonesia. E-mail: [email protected]
KeyWords
Arrhenius, ASLT, determine, parameter , sheet nile tilapia jerky, shelf life, temperature.
ABSTRACT
This estimation of the shelf life of sheet Nile tilapia jerky research was conducted in the Laboratory of Fishery Products Processing Technol-ogy, Faculty of Fisheries and Marine University of Padjadjaran. The aim of this research was to determine the shelf life of sheet Nile tilapia jerky using Accelerated Shelf Life Test (ASLT) Method Arrhenius Model. Determining shelf life using ASLT method by accelerating the degra-dation process by increasing the storage temperature on some degrees above the room temperature, so that accelerated shelf life with the time analysis. Water content test and sensory test used as a parameter to determine the expired date. The sheet Nile tilapia jerky saved for 35 days at the storage temperature 250C, 350C, and 450C. The calculation result Arrhenius model was chosen flavor parameter as a critical
INTRODUCTION
According to Fachruddin (1997), jerky is a traditional processed product that is very popular in Indonesia which is using herbs and spices and has an added value if done process modification that improves the quality and benefit and also has a good prospect. In cooking of jerky, usually the materials are dried by adding a mixture of salt, sugar, and seasonings including sugar, tamarind, salt and herbs and spices aim to produce flavor, distinctive taste, and giving durability on jerky and can postpone microbes growth due to content of tannin compound and antioxidant (Sumbaga 2006).
According to Ashriyyah (2015), a kind of jerky reviewed from the way of making was divided into three groups, they are beef jerky, sliced jerky, and yeast jerky. A jerky that would make in this research was beef jerky with the final product result of a sheet jerky. This kind of jerky considered more superior because the grinding process could improve the texture and the taste of the pro-duced jerky. This is because the seasonings that added to would absorb more evenly to all of jerky surfaces (Ainurrohmah 2012).
According to Purnomo (1995), jerky as a half-wet food that has 15-40% of water content is generally durable enough and stable in storage at the room temperature. A semi-wet product like fish jerky has generally a short shelf life, because easy to having damaged due to microorganism work and being obstacles in expansion effort of fishery products marketing.
To guarantee that the fish jerky is still worth consuming and doesn’t having damaged yet it’s required an information about that product shelf life so it needed to do a research about determining shelf life of sheet jerky using Accelerated Shelf Life Test (ASLT) method Arrhenius model using an acceleration temperature so can accelerate the reaction that causes a damage on the products. The excess of this method is the time that needed to determine shelf life is relatively short, but still has a high accuracy.
METHOD OF RESEARCH
Place and Time of Research
The research of shelf life estimation of Nile tilapia sheet jerky was conducted in Laboratory of Fisheries Products Processing Technology, Faculty of Fishery and Marine University of Padjadjaran and the test of the water content of fish jerky was done in La-boratory of Test Service Faculty of Agricultural Industrial Technology University of Padjadjaran. The research was conducted in Febru-ary-March 2018.
Tools and Materials
The tools used in this research were a knife, a cutting board, a food processor, a meat grinder, basins, oven, and pan. The materials used were Nile tilapia, salt, onion, tamarind, coriander, brown sugar, galangal, ginger, and carrageenan.
This research used ASLT method Arrhenius model, the test was conducted by saving the products in the incubator at the temperature of 250C, 350C, and 450C for 35 days. The observation was conducted on the days 1, 7, 14, 21, 28, and 35 for every stor-age temperature. The parameter that tested to estimate the shelf life ASLT method Arrhenius model was using sensory testing data (texture, flavor, appearance, and taste) and test of water content.
The calculation of shelf life of the sheet Nile tilapia jerky used Accelerated Shelf Life Test (ASLT) method with Arrhenius model approach was done with stages as follows:
a.
The determination of the right reaction ordo described the fish jerky damage through R2 value comparison (linear regres-sion) at ordo 0 or ordo 1. Ordo used was the ordo that had the biggest R2 value or the closest to one. R2 value aimed to find out the percentage of appearance changing affected by the storage time, if R2 value was the biggest value or the closest to one then would provide the most right of the calculation result of expired time.Simple Linear Regression
A simple linear regression analysis used to know the effect between one independent variable to one dependent variable. The general equation is: Y = b X + a . With Y is a dependent variable and X is the independent variable. Coefficient a is a constant (in-tercept) that is an intersection between regression line with Y axis on the Cartesians coordinate while coefficient b is a slope data. In this Arrhenius method, a linear regression is the first phase to obtain Arrhenius equation. The variables can be observed in this re-search were as follows:
a) Independent Variable : Days of Storage (X)
Days of storage was a time that used on the certain interval to know the damage signs of the sheet Nile tilapia jerky so due to the days of storage would obtain an analysis result then computed the rate of quality degradation using Arrhenius method.
b) Dependent Variable :
= (∑ y)(∑ x ) − (∑ x)(∑xy) n (∑ x ) − (∑ x)
b = (∑ xy) − (∑ x)(∑y) n (∑ x ) − (∑ x)
b.
Making Arrhenius PlotR2 value at the three temperatures and determined the reaction ordo, slope value from that equation was K value at the storage temperature respectively. Chosen between ordo 1 and ordo 0 that had the biggest constant b value. After obtaining K value at the storage temperature respectively, made Arrhenius plot with Ln K value as an ordinate and 1/T value as an abscissa.
1. Counting Ln k (this process was done per temperature respectively)
Through taking variable b coefficient from linear regression equation above then counted Ln from every variable, and made into LnK.
2. Counting 1/T+273
This counting took the temperature of user inputted then counted by that formula above, where T = user inputted tempera-ture. I.e. : temperature = 25°C, then : 1/25+273 = 0,0034. In this process was done at the each of user inputted temperatempera-ture.
3. Linear Regression (2nd Regression Process)
Made the Arrhenius plot by counting linear regression again between Ln K (from point 2 above) and 1/T (from point 3 above) where X = Ln K and Y = 1/T processed by the same linear regression formula then projected with a graphic. Obtained an equa-tion y = a + b 1/T ( a = Ln K and b = 1/T ).
4. Activation Energy ( Ea )
The next process was searching (Ea) value of each parameter (appearance, flavor, texture, taste, and water content). Activa-tion Energy (Ea) was an energy that required to start a change/degradaActiva-tion of quality.
Ea = - (b × R) Information :
Ea : Activation energy (kJ/mol) b : Slope data
R : Gas constant (8,315 J/K)
c.
Calculation K value at the various storage temperatures. K and Ko with Arrhenius equation that could describe the relation-ship between the damage rate and the high temperature. Arrhenius equation used was:K = K × e −ea RT⁄
Information :
K : quality degradation constant
Ko : Constant (not depend on the temperature) Ea : Activation energy
T : Absolute temperature (C+273) R : Gas constant 8,315 (J/K mol)
d. Finding shelf life based on kinetic rate model ordo zero or ordo one. The reaction of C concentration degradation to reaction rate function on the temperature (T), if following kinetic rate model of ordo zero the formula is as follows:
C − C = K
Information :
K: K value at various storage temperatures,
C: Total of Quality unit
C0: Total of Quality unit until expired t
RESULT AND DISCUSSION
Appearance
(a) (b)
Figure 1. Graphic of Relationship of Appearance Score Degradation to Time
R2 value (Figure 1) R2 value comparison on three temperatures, ordo 0 is bigger than ordo 1 on the graphic of Relationship of appearance score degradation to time so in determining Arrhenius equation then chosen ordo 0.
Figure 2. Graphic of Appearance Arrhenius Plot
Flavor
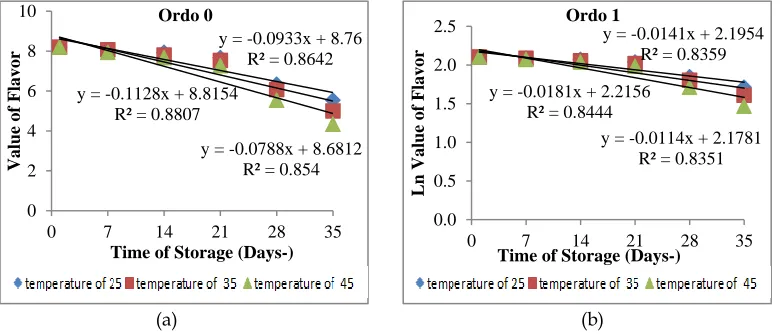
The longer product storage and the higher storage temperature then the flavor hedonic score of sheet Nile tilapia jerky would decrease on average, then the panelist's pleasure to the flavor of the product will be more decreased. Degradation of the panelist's calculation to the flavor of sheet Nile tilapia jerky could occur due to volatile compounds evaporated on the sheet Nile ti-lapia jerky (Wijaya 2007).
(a) (b)
Figure 3. Graphic of Relationship of Flavor Score Degradation to Time
Three temperatures of R2 value (Figure 3) between ordo 0 and ordo 1 then could be seen that ordo 0 had bigger R2 value than R2 value from ordo 1 on the graphic of the relationship of flavor score degradation to time so it’s chosen ordo 0 to be
deter-y = -1520,4x + 2,6723 R² = 0,9766
-2.50 -2.40 -2.30 -2.20 -2.10 -2.00
0.0031 0.00315 0.0032 0.00325 0.0033 0.00335 0.0034
Ln
K
1/T Arrhenius Plot
y = -0.0893x + 8.8885 R² = 0.9154
y = -0.101x + 8.9399 R² = 0.8967
y = -0.1232x + 8.9772 R² = 0.9189
0 5 10
0 7 14 21 28 35
Value
of
Ap
pearance
Time of Storage (Days-) Ordo 0
y = -0.0129x + 2.2047 R² = 0.8882
y = -0.0152x + 2.219 R² = 0.8573 y = -0.02x + 2.2406
R² = 0.8645
0.0 0.5 1.0 1.5 2.0 2.5
0 7 14 21 28 35
Ln
Value
of
Ap
pearance
Time of Storage (Days-) Ordo 1
y = -0.0788x + 8.6812 R² = 0.854 y = -0.0933x + 8.76
R² = 0.8642
y = -0.1128x + 8.8154 R² = 0.8807
0 2 4 6 8 10
0 7 14 21 28 35
Value
of
Fl
avor
Time of Storage (Days-) Ordo 0
y = -0.0114x + 2.1781 R² = 0.8351 y = -0.0141x + 2.1954
R² = 0.8359
y = -0.0181x + 2.2156 R² = 0.8444
0.0 0.5 1.0 1.5 2.0 2.5
0 7 14 21 28 35
Ln
Value
of
Fl
avor
mined the Arrhenius equation.
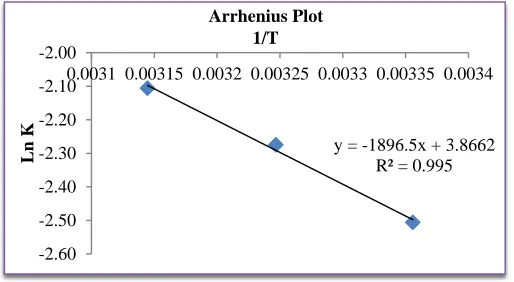
Figure 4. Graphic of Flavor Arrhenius Plot Texture
The longer product storage and the higher storage temperature then the texture hedonic score of sheet Nile tilapia jerky would be decreased on average, then the panelist's pleasure to the texture of the product would be more decreased. The texture had a relationship with the water content, the storage process in a certain time could change the texture from each treatment oc-curred a degradation of quality due to the water content in sheet Nile tilapia jerky was reduced. It strengthened with the statement, According to Rahmanto et al (2014), the rates of food product acceptance from texture parameter is strongly affected by the water content, the lower water content value of a jerky then the texture isn’t elastic and easily broken unlike the initial quality from the elastic and isn’t easily broken jerky.
(a) (b)
Figure 5. Graphic of Relationship of Texture Score Degradation to Time
Three temperatures of R2 value (Figure 5) seen that R2 value at ordo 0 was bigger than R2 value ordo 1 on the graphic of the relationship of appearance score degradation to time so it’s chosen ordo 0 to be determined the Arrhenius equation.
Figure 6. Graphic of Texture Arrhenius Plot
y = -2083,8x + 4,4231 R² = 0,9685
-3.00 -2.50 -2.00 -1.50 -1.00 -0.50 0.00
0.0031 0.00315 0.0032 0.00325 0.0033 0.00335 0.0034
Ln
K
1/T Arrhenius Plot
y = -1697.9x + 3.1517 R² = 0.9973
-2.60 -2.50 -2.40 -2.30 -2.20 -2.10
0.0031 0.00315 0.0032 0.00325 0.0033 0.00335 0.0034
Ln
K
1/T Arrhenius Plot
y = -0.0749x + 8.7672 R² = 0.8559
y = -0.1006x + 8.91 R² = 0.8246 y = -0.1161x + 8.918
R² = 0.8895
0 2 4 6 8 10
0 7 14 21 28 35
Value
of
Texture
Time of Storage (Days-) Ordo 0
y = -0.0106x + 2.1864 R² = 0.8288
y = -0.0156x + 2.2203 R² = 0.7778
y = -0.0187x + 2.2304 R² = 0.839
0.0 0.5 1.0 1.5 2.0 2.5
0 7 14 21 28 35
Ln
Value
of
Texture
Taste
The longer product storage and the higher storage temperature then the taste hedonic score of sheet Nile tilapia jerky will be decreased on average, then the panelist's pleasure to the products taste will be more decreased. It strengthened by a statement of Frans (2016) that the food products in the storage till will occur the change of taste.
(a) (b)
Figure 7. Graphic of Relationship of Taste Score Degradation to Time
Three temperatures of R2 value (Figure 7) could be seen that ordo 0 had bigger R2 value than R2 value from ordo 1 on the graphic of the relationship of texture score degradation to time so it’s chosen ordo 0 to be determined the Arrhenius equestion.
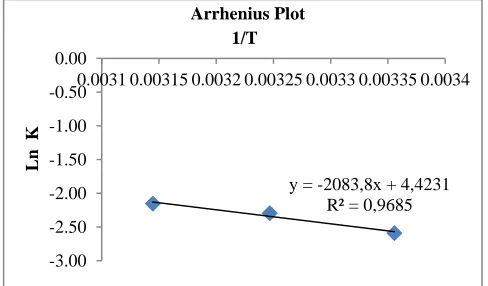
Figure 8. Graphic of Taste Arrhenius Plot
Water Content
The degradation of water content in the product was caused by the temperature and the storage time that accelerated evaporation process in the storage time. This is caused by the temperature and the high airspeed would accelerate the evaporation process on the surface and the inside of the particle due to the different liquid vapor pressure (Djaeni et al 2012). It strengthened by the statement of Rosidin (2012) that the higher air temperature, the more water vapor that can be accommodated by that air and the faster of taking water from the foodstuff then occur a water content degradation. Water content value of the sheet Nile tilapia jerky was ranged between 15,79 – 30,83%. This water content if compared with SNI water content, the cow jerky water content ac-cording to Industry Department (1992) didn’t meet the standard yet that was 12% maximum.
y = -0.0816x + 9.0632 R² = 0.8974
y = -0.1028x + 9.1713 R² = 0.9004
y = -0.1217x + 9.194 R² = 0.9174
0 2 4 6 8 10
0 7 14 21 28 35
Value
of
Taste
Time of Storage (Days-) Ordo 0
y = -0.0112x + 2.2193 R² = 0.8807 y = -0.0149x + 2.2429
R² = 0.8702
y = -0.0189x + 2.2604 R² = 0.8654
0.0 0.5 1.0 1.5 2.0 2.5
0 7 14 21 28 35
Ln
Value
of
Taste
Time of Storage (Days-) Ordo 1
y = -1896.5x + 3.8662 R² = 0.995
-2.60 -2.50 -2.40 -2.30 -2.20 -2.10 -2.00
0.0031 0.00315 0.0032 0.00325 0.0033 0.00335 0.0034
Ln
K
(a) (b)
Figure 9. Graphic of Relationship of Water Content Score Degradation to Time
Three temperatures of R2 value (Figure 9) can be seen that R2 value at ordo 0 was bigger than R2 value ordo 1 on the graphic of the relationship of water content score degradation to time so it’s chosen ordo 0 to be determined the Arrhenius equation.
Figure 10. Graphic of Water Content Arrhenius Plot
Determinating the Shelf Life
The shelf life also can be defined as the time until the product occurs a rate of certain quality degradation due to deteriora-tion reacdeteriora-tion that causes that product isn’t worth consuming or not feasible anymore based on criteria listed on the packaging (the quality doesn’t correspond anymore with the promised quality rates) (Arpah 2001).
Determination of the critical value on the sheet Nile tilapia jerky was obtained from flavor parameter, picking of reaction or-do was or-done by plotting the data of quality degradation to follow zero reaction oror-do and one reaction oror-do then created the linear regression equation.
Table 1. R2 value from Each Parameter
No. Parameter R2 Ea (Kj/mol) 1 Appearance 0,977 12642,13 2 Flavor 0,997 14118,04 3 Texture 0,969 17326,80 4 Taste 0,995 12335,30 5 Water Content 0,948 10124,34
y = -0.2864x + 31.243 R² = 0.9889
y = -0.3443x + 31.488 R² = 0.9278 y = -0.3699x + 31.187
R² = 0.8813
0 5 10 15 20 25 30 35
0 7 14 21 28 35
Value
of
Wate
r Con
te
nt
Time of Storage (Days-) Ordo 0
y = -0.0112x + 3.454 R² = 0.9746
y = -0.0143x + 3.4723 R² = 0.8836 y = -0.0143x + 3.4723
R² = 0.8836
0.0 0.5 1.0 1.5 2.0 2.5 3.0 3.5 4.0
0 7 14 21 28 35
Ln
Value
of
Wate
r Con
te
nt
Time of Storage (Days-) Ordo 1
y = -1217.6x + 2.8522 R² = 0.9482
-1.4 -1.2 -1 -0.8 -0.6 -0.4 -0.2 0
0.0031 0.00315 0.0032 0.00325 0.0033 0.00335 0.0034
Ln
K
The parameter which had the biggest correlation coefficient value (R2) on the sheet Nile tilapia jerky was flavor. R2 value was 0,997 with an activation energy of flavor parameter changing was 14118,04 kJ/mol that meant to start the flavor changing required the energy as big as that. The shelf life if assumed that the temperature as long as distribution and storage was 250C room temperature or 298 K that was 76.532 (76 days 12 hours 46 minutes 4 seconds). So at the temperature of 250C the sheet Nile tilapia jerky was longer shelf life than at the temperature of 350C dan 450C.
Conclusion
The shelf life of sheet Nile tilapia jerky which saved at the temperature of 350C and 450C was shorter shelf life than at
the temperature of 250C. The shelf life of sheet Nile tilapia which saved at the room temperature (250C) was 76 days 12 hours 46
minutes 4 seconds. The shelf life of sheet Nile tilapia jerky (temperature 350C) was 63 days 14 hours 34 minutes 4 seconds and at
(temperature 450C) the shelf life was 53 days 11 hours 35 minutes 31 seconds.
References
[1] Ainurrohmah. 2012. Pengaruh Persentase Gula Aren Terhadap Mutu Dendeng Giling Jamur Tiram. Tesis. Fakultas Teknik. Universitas Negeri.
Semarang.
[2] Arpah. 2001. Penentuan Kedaluwarsa Produk Pangan. Program Studi Ilmu Pangan. Institut Pertanian Bogor. Bogor.
[3] Ashriyyah, A. 2015. Eksperimen Pembuatan Dendeng Giling Jamur Tiram (Pleurotus ostreanus) Substitusi Ikan Lele. Skripsi. Fakultas Teknik,
Universitas Negeri Semarang. Semarang.
[4] Badan Standarisasi Nasional. 1992. Dendeng Sapi. SNI 01-2908-1992. Jakarta.
[5] Djaeni, A.M, Prasetyaningrum., dan A. Mahayana. 2012. Pengeringan Karaginan Dari Rumput Laut Eucheuma Cottonii Pada Spray Dryer
Menggunakan Udara Yang Didehumidifikasi Dengan Zeolit Alam Tinjauan: Kualitas Produk Dan Efisiensi Energi. Momentum. 8(2) : 28- 34
[6] Elfirah., Rostiati Dg., Rahmatu, dan Nilawati, J. 2015. Kualitas Dendeng Ikan Selar (Selaroides Leptolepis) Dengan Penambahan Likopen Dari
To-mat (Lycopersicum Pyriforme). Jurnal Sains Dan Teknologi Tadulako. 4 (3): 44-54.
[7] Frachrudin, L. 1997. Membuatan Aneka Dendeng. Kanisius. Yogyakarta.
[8] Frans, S.K., Detha, A.I.R., dan Tangkonda, E. 2016. Pengaruh Pemberian Konsentrasi Gula Lontar pada Dendeng Ikan Tembang (Sardinella
fim-briata) terhadap Lama Simpan berdasarkan Kadar Air, Nilai Organoleptik dan Total Cemaran Mikroba. Jurnal Kajian Veteriner. 4 (2) : 28-39.
[9] Purnomo, H. 1995. Aktivitas Air Dan Peranannya Dalam Pengawetan Pangan. UIP. Malang.
[10] Rahmanto, S.A., Parnanto, N.H., Nursiwi, A. 2014. Pendugaan Umur Simpan Fruit Leather Nangka (Arrtocarpus Heterophyllus) Dengan
Penam-bahan Gum Arab Menggunakan Metode Accelerated Shelf Life Test (Aslt) Model Arrhenius. Jurnal Teknosains Pangan. 3(3): 35-43.
[11] Rosidin., Yuliati, K., RJ, Siti. 2012. Pengaruh Suhu dan Lama Pengeringan terhadap Mutu Silase Limbah Pengolahan Kodok Beku (Rana sp.) yang
Dikeringkan dengan Penambahan Dedak Padi. Fishtech. 1 (1): 78-90.
[12] Sumbaga, D.S. 2006. Pengaruh Waktu Curing (Perendaman Dalam Larutan Bumbu) Terhadap Mutu Dendeng Fillet Ikan Lele Dumbo (Clarias
gariepinus) Selama Penyimpanan. Skripsi. Fakultas Teknologi Pertanian Institut Pertanian Bogor. Bogor.
[13] Wijaya, C.H. 2007. Pendugaan Umur Simpan Produk Kopi Instan Formula Merk-Z Dengan Metode Arrhenius. Skripsi. Fakultas Teknologi