A NOVEL APROACH TO FEATURE
BASED RECOMMENDATION SYSTEM
BASED ON USER RATINGS
SHAZIA AFREEN
Computer Science and Engineering Department, Amity University, Gomti Nagar, Lucknow, Uttar Pradesh 226028, India
Dr. DEEPAK ARORA
Computer Science and Engineering Department, Amity University, Gomti Nagar Lucknow, Uttar Pradesh 226028, India
POOJA KHANNA
Computer Science and Engineering Department, Amity University, Gomti Nagar, Lucknow, Uttar Pradesh 226028, India
Abstract: With the increase in online shoppers, the demand for suggesting users with appropriate items in lesser time has also increased. The objective of this paper is to propose and devise a method that can take over the current techniques in the aspects of both time and complexity by filtering large databases on the basis of the intended features. The proposed recommendation technique groups the entire user based product dataset into clusters of similar ratings by using Clustering techniques. Each cluster formed can be further classified into Feature based Classes on the basis of the features of the products. The classes under each cluster gives items that are similar to each other on the basis of the feature considered. The proposed concept integrates clustering with classification thereby helping in refining the recommendation process. The results generated thereafter are expected to produce much more personalized, faster and accurate recommendations.
Keywords: Clustering; Feature Extraction; Classification. 1. Introduction
recommendation generation algorithms given by Sarwar was reviewed [Sarwar and et al. (2004)]. A survey on computing item based similarity approaches with time of execution and complexities was done. This paper concentrated upon the advantages and disadvantages of each similarity measure. The conclusion included, that item based algorithm in collaborative filtering provides much faster execution time as well as better quality than the user based collaborative Filtering Approach.
2. Background Study
The paper presents the idea of Collaborative filtering approach of finding users that are similar to each other. The collaborative filtering approach is further classified into user based and item based approach. The next section of paper further emphasizes on item based collaborative filtering approach with the help of diagrams and flow charts. The paper further expresses various similarity measures that are used in existence along with the proposed methodology of a Feature based Recommendation System.
2.1 Collaborative Filtering
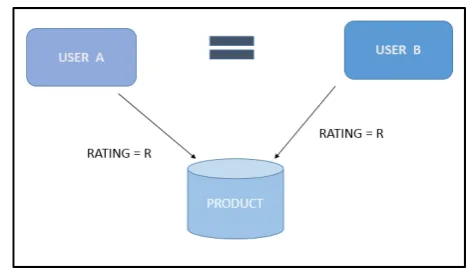
The concept of Collaborative Filtering is based on maintaining a database of users along with the items rated by each of them. The purpose of this is to find the users that strongly match with the user under consideration, thereby recommending the items that were strongly rated by the similar users. This concept is used by almost all the existing recommendation systems in the commercial applications like Amazon. Collaborative filtering needs both the user data and the item data along with the ratings. According to the Fig. 1, if User A has rated a Product with the Rating R, and another User B, has rated the same product with same rating R, then it can be said that User A and User B strongly correlate to each other. Collaborative Filtering can be broadly classified into two classes:
1. User based Collaborative Filtering 2. Item based Collaborative Filtering
Fig. 1. The collaborative filtering process
2.1.1 User based Collaborative Filtering
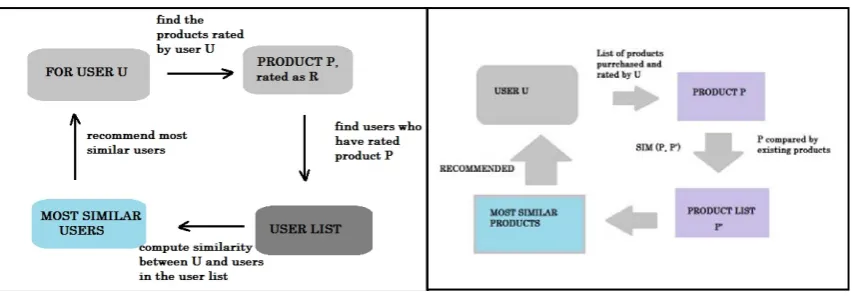
This approach aims at finding recommendations, by matching users and finding the most similar users in terms of preferences and tastes. This method is almost similar to item based collaborative filtering. A similarity method based on correlation is used to find similar users by computing the similarity index between the users. This method is lesser preferred as it consumes much more time than the item based approach. This method works well when the data is not so large, but as the data is scaled to a larger number, the efficiency of this method reduces. The fig. 2. depicts the process of finding the users similar to a particular user U. In this, the products rated by user U is found out. Next the a list containing the users who have rate the same product is created, the users in the list is then compared with the user U, on a certain similarity criteria, the most similar users are then recommended depending upon similarity index used. 2.1.2 Item based Collaborative Filtering
The pseudo code for item to item collaborative filtering is explained as follows: STEP 1: for every item I in the ITEM list:
Find the customers C from the CUSTOMER list, who has rated the Item I STEP 2: for each of the customer C, who has rated the Item I:
Find the Items rated by Customer C, excluding the Item I STEP 3: for each of the Items I’ that have rated by C, Compare I and I’ using some similarity metric
Step 4: Return the Item I’ depending upon the similarity metric.
Fig. 2. User based collaborative filtering process Fig. 3. Item based collaborative filtering process
2.2 Existing Similarity Measures
A similarity method is a way by which the degree of similarity or correlation can be calculated and measured. The existing recommendation systems use many similarity methods. In this paper, the following similarity methods will be touched upon.
1. Cosine Item based Similarity 2. Pearson Item based Similarity 3. Euclidean distance based similarity 4. Tanimoto coefficient based similarity 2.2.1 Cosine based Similarity (COS)
This is a common way of measuring similarity between two customers say, c1 and c2. In this method the two users are expressed in form of vectors, containing the ratings of each product. In the cosine based similarity method, the cosine of the angle between the two vectors c1 and c2 is calculated. The lesser the angle between them, the more is the similarity. The formula that is used to compute the angle between two vectors is depicted by equation (1). Cosine Similarity is easy and efficient to evaluate. The resultant outcome of this similarity measure lies in the range of [0, 1]. The major drawback inferred by Saranya is that it provides high similarity between two vectors which have considerable difference in rating factor [Saranya and et. al. (2017)].
Similarity (c1, c2) = cosine (c1, c2) = .
|| ||^ ∗ || ||^ (1)
2.2.2 Pearson Correlation Coefficient (PCC)
• Pearson correlation quantifies how well two objects fit in a line. • Pearson correlation = 1, means that the two data are perfectly correlated • Pearson correlation = -1, means that the two data are not correlated at all
The formula to calculate the Pearson correlation is depicted by equation (2).
• Pearson correlation = ∑r.r' - ∑r ∑r'
( ∑ ∑ r)^2/N) (∑ ∑ )^2/N ) (2)
Where r and r’ are the ratings by the customer c1 and c2. 2.2.3 Euclidean Distance based Similarity
Euclidean based item similarity measures the degree of similarity between two points by measuring the distance between them.
• Euclidean distance for two points (x1, y1) and (x2, y2) is defined by equation (3).
• E.D.= 2 1 ^2 2 1 ^2 (3)
Where r1, r2, r3 . . . are the ratings by customer c1 And r1’, r2’, r3’ . . . are the ratings made by customer c2. 2.2.4 Tanimoto Coefficient based Similarity
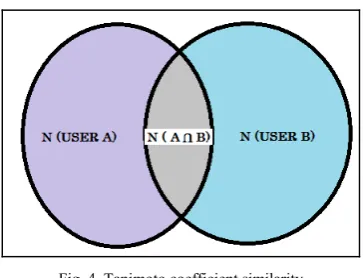
• Tanimoto coefficient measures the similarity by measuring the overlap or the intersection between the two sets.
• Assuming two sets be A and B, then Tanimoto coefficient is defined by equation (4).
T (A, B) = N (A intersection B) / N (A) +N (B) - N (A intersection B) (4) • Where N (A intersection B) = number of elements that exist both in set A and B.
• N(A) = number of elements in set A • N(B) = number of elements in set B
Fig. 4. Tanimoto coefficient similarity
N (An intersection B) in the Fig. 4. expresses the number of items for which both user A and User B have shown interest. Whereas N (A) and N (B) express the items in which only User A and User B has shown interest respectively.
3. Proposed Method
This paper aims to present a new methodology to aid users in providing relevant items by filtering large databases on the basis of the intended feature. Unlike item based and user based collaborative filtering, the proposed method is based on rating the product differently on different aspects of products, i.e. on the basis of the different features of each product. A matching function is defined which measures the degree of similarity between two items or products. If a user U1 rates product P1 and user U2 rates product P2, then they can be considered similar if the difference between their respective ratings is in the range of {0,1 }. The function given below in equation (5) and (6) explains this concept in mathematical terms.
If, match (R1, R2) ∈ {range between 0 and 1} user U1 and user U2 are similar (5) If, match (R1, R2) ∉ {range between 0 and 1} user U1 and user U2 are dissimilar (6) Where R1 and R2 are the ratings given by a User U1 and User U2 on a “same feature”.
Considering an example as shown in the table 1 below, U1 and U2 have rated a particular product on four different features f1, f2, f3 and f4. By computing the difference between the ratings on each feature, match function gives whether the ratings are similar or dissimilar. And according to the match function, if the two ratings are similar then their products can be recommended to each other.
Table 1. An example to evaluate the match function
User X rating Feature f1 Feature f2 Feature f3 Feature f4
User U1 5 2 2 4
User U2 4 5 3 2
Match (U1, U2) Similar Dissimilar similar Dissimilar
Consider user likes product ‘ ‘Q’ and adidas sh add mean coming t 5 and ano are simila new meth By viewi “RAM” “Operatin
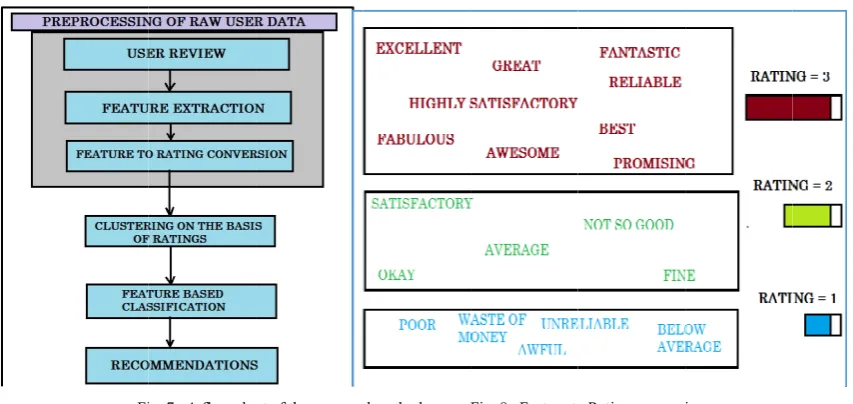
Fig. 5. C The main feature b System” converted further se feature b
4.1 Prep The idea be based user is ta Natural L
ring the fact th s or rates on t ‘P’ as 5 and a coming to the hoe and produ
ning to sense o to the situation other user rate ar in terms of hodology of f ing the Fig. 6 and can be r ng System” an
Clustering the dat
n idea of the based Recomm
a dataset is cr d into feature egregated into ased recomme
Fi
processing of of preprocess d on distinctiv
aken into cons Language Pro USER PRO
CLUSTE
4. hat different u the product on another user li e conclusion t uct Q might be of similarity, n number 2, a es the mobile f its camera fe finding simila . it can be sai recommended nd “Finger Se
taset into groups o
paper is henc mendations. T reated by anal e based rating o feature based
endations in d
ig. 7. A flow cha
f raw data sing the raw d ve features of sideration to e ocessing techn ODUCT DATA
ERING TECHN
Feature bas users have dif n a certain fea
ikes and rates that the P and e a Hair X con it is necessary as shown in Fi
“XYZ” in ter eature, which m ar products in
id that mobile for each oth ensor”.
of similar ratings
ce centralized To elaborate t
lyzing the revi s. The compl d classes. The detail. The flow
art of the propose
data obtained i the product. T extract the sub niques like pa
ASET
NIQUES
sed Recomme fferent levels o ature. Taking t s a product ‘Q d Q are simila nditioner, thu y to rate the pr ig. 6, a user ra rms of its cam makes it a sen
terms of spec e Motorola is her, but they
Fig. 6. An
around featu the concept o iews given by ete dataset is e upcoming se
w chart in Fig
d method
is to divide the The user revi b ratings of th art of speech t
endation Pro of perception two different Q’ as 5, by on ar has little s s to say, havin roduct on the ates a mobile mera as say, 4.
nsible thing th cific features a
similar to XY are dissimilar
n example depictin
ure based ratin of the propose y the user. The segregated in ection of the p g. 7 shows the
Fig. 8. Feature to
e rating of the ews or basica he product. Th tagging, entity
cess
with different situations, say nly matching t
ense because ng no connect basis of each “Motorola” in Thus it can b his time. Henc and not just re YZ mobile in
r when judge
ng feature match
ng, feature ba ed “Feature b e raw dataset i nto similar ra aper contains
flow of the pr
o Rating conversi
e product into ally the comm his is impleme y recognition,
t levels of liki y a user likes the rating 5 fo product P co tion at all. Th of its feature. n terms of its be said, the tw ce, the paper p ecommending terms of “cam ed under the f
ing based on ratin
ased similarity based Recomm
is further proc ating clusters w
step by step p roposed proce
ion
sub ratings w ments mention ented by empl , and event re
etc… so taken, a u inspired storyline and adjec scale of o doesn’t c powerful speech li whereas transform 4.2 Clus The next with a di clusters u ranges of 1. Clus 2. Clus 3. Clus 4. Clus Thus the clustering rating be can be su
Since, bo problem 4.3 Feat The solut in the Fig range of X on a se given in of feature movie N applicatio which ca
to find out th user might rat
by the ancie is not very s ctives associat one to three, a concentrates m l NLP tools li ike noun, pro the “adjectiv med onto a sca stering on the t step is to gro ifference in th using the avai f ratings. ster 0: contain ster 1: contain ster 2: contain ster 3: contain
Fig
e whole datas g is to bring to ing calculated uggested to on A use And a oth movies M
to this is to fin ture based Cla tion to the pro g. 10. Thus to rating. Explai et of features f the table 2. A e f1 and f3, an N if the user i
on of classific an be recomme
he degree of te a movie say ent Greek my trong.” By an ted with them as shown in th much upon t ke GATE and onoun, adjecti ves” and the ale of one to th e basis of Rat oup data into he range {0, 1
lable clusterin
s all movies a s all movies a s all movies a s all movies a
g. 9. Feature Extr
set of user m ogether the us d by taking the ne other on the
er X has rated another user Y
and N belong nd out on “wh assification oblem mentio o say a movie ining in terms f1, f2 . . . fN. According to th
nd are dissimi is looking for cation over clu
ended to each
liking of a p y, “the baby bo ythology. The nalyzing the d m can be identi he Fig. 9. the the NLP tech d ANNIE. Suc ive, etc. The
“adverb” def hree thus prod tings
similar cluste 1} are conside ng techniques.
and user data p and user data p and user data p and user data p
raction
movie rating i ser movie data
e average of a e fact that they d a movie M a Y has rated mo g to the rating hat terms” is m
oned above is e M is similar s of an exampl And another m he above exam ilar on the bas r a movie on ustering is to i
other
articular user oss” with com e animation a different parts ified, and hen sub ratings o hniques, and ch tools help “noun” and t fine the qual ducing the sub
ers that contain ered to be sim . The four clu
points whose r points whose r points whose r points whose r
Fig
is transformed a points are si all the sub rati y have similar as 4.2 ovie N as 5.0
group {4, 5} movie M simil
to classify ea r to movie N, le as shown in movie N has b mple, it can be sis of feature f the basis of identify the m
for that spec mments like, “
and sounds ar of the text th nce by mappin f respective fe it is assumed in converting the “pronoun ities and beh b ratings as sho
n similar ratin milar, hence th usters namely c
rating is withi rating is withi rating is withi rating is withi
g. 10. The classifi
d into four d imilar in terms ings of each f r ratings. For e
hence they ca lar to movie N
ch cluster on , if they share n the Table 2, been rated by e said that mo f2 and f4. Thu
feature f1 an movies that hav
cific feature. I it was one of re superbly r hat was given ng the adjectiv features can be d to be direct g the input tex ” represent fe havior of that
own in the Fig
ngs. As discus he entire data cluster 0, 1, 2
in the range of in the range of in the range of in the range of
cation of the clus
distinct cluster s of their over feature. The ite
example,
an be thought N?
the basis of e e a common f if a movie M user Y on the ovie M and N us, movie M c nd f3. Summin
ve similar rati
In case of the the best anim endered. Alth n by user, prop
ves of each fe e found out. T
tly produced xt into differen eatures of the t feature and g. 8.
ssed before, t aset is conver , and 3 contai
f {4, 5}. f {3, 4}. f {2, 3}. f {1, 2}.
sters
rs. The motiv rall ratings. Th ems in the sam
t of being simi
each feature as feature which M has been rate e same set of f
are similar on can be recomm
ng up the con ings on simila
e example ated films hough the
per nouns ature on a This paper by using nt parts of e product, are later
he ratings rted into 4 in the four
ve behind he overall me cluster
ilar. Yet a
Table 2. An example to explain the concept of Feature based Classification.
User movie f1 f2 f3 F4
X M 4.2 3.7 4.1 1.7
Y N 4.5 5.0 4.2 3.0
Match (X,Y) similar dissimilar similar Dissimilar
4.3 Recommendation of Results based on the Euclidean Distance
The next step is locate the data point (say, p1) of the user for which recommendations are being searched. By employing the distance metrics of Euclidean distance measure from the present data point p1 to all the data points in the cluster in which it lies, the distances can be calculated. Nearer the data points, stronger is the similarity between them, and hence are more likely to be considered and be recommended.
for data point, p1 → f r1 , f r2 , f r3 , . . . f r n
for data point, p2 → f r1′ , f r2′ , f r3′ , . . . f r n′
where f1, f2, … fn represent the features and
r1, r2, … r n represent the ratings of f , f , … f for
and r1′, r2′, … r n′represent the ratings of f , f , … f for p2.
Applying the Euclidean distance formula from the equation (7), the distance between p1 and all the rest data points in a particular cluster can be formulated. The data points that are lesser in distances will be greater in similarity with the point p1 and hence will be recommended.
Euclidean distance = 1 1 2 2 3 3 . . . (7)
5. Future Scope and Concluding Results
The idea of the proposed method is to lessen up the cost of complex calculations used in the existing similarity measures. The existing systems tend to have complexity of O (MN), where M is the number of Users and N is the number of products which is quite large and scales from thousands to millions. By strongly analyzing the user based reviews on different movies (or products), it is possible to assess the distinctive features of the product. The different features can be further extracted by employing NLP techniques such as entity recognition, parts of speech tagging, etc. The nouns and pronouns basically represent different features of the product and the adjectives and adverbs represent the ratings of that particular feature. Thus by matching the products on the basis of each of its feature adds on a much more sense of meaning to the concept of similarity. To bring the idea into implementation, a feature based recommendation process is proposed which highlights the clustering and classification of data.
methodology aims to predict more accurate and faster results than the existing user based and item based recommendation systems.
6. References
[1] Adomavicius, G.; Tuzhilin(2005): A. Toward the next generation of recommender systems: a survey of the state-of-the-art and possible extensions, IEEE Transactions on Knowledge and Data Engineering 17, 734-749.
[2] Agrawal, R.; Mannila, H.; Srikant, R.; Toivonen, H.; Verkamo, A. (1996): Fast discovery of association rules, 307– 328.
[3] Arsan, Taner; Köksal, Efecan; Bozkuş, Zeki(2016): COMPARISON OF COLLABORATIVE FILTERING ALGORITHMS WITH VARIOUS SIMILARITY MEASURES FOR MOVIE RECOMMENDATION, Vol. 6, No. 3
[4] Babu, Maddali Surendra Prasad; Kumar, Boddu Raja Sarath(2011): An Implementation of the User-based Collaborative Filtering Algorithm, Vol. 2 (3) , 2011, 1283-1286
[5] Bell, R. ; Koren, Y. (2007): Scalable Collaborative Filtering with Jointly Derived Neighborhood Interpolation Weights, pp. 43–52, 2007.
[6] Breese, J.; Heckerman, D.; and Kadie, C. (1998): Empirical Analysis of Predictive Algorithms for Collaborative Filtering, pp. 43-52. [7] Deshpande, M. and Karypis, G. (2004): Item-based top-n recommendation algorithms. ACM Trans. Inf. Syst., 22(1):143–177. [8] G., Saranya K.; and Sadasivam, G. Sudha(2017): Modified Heuristic Similarity Measure for Personalization using Collaborative
Filtering Technique, 307-315
[9] Goldberg, D. ; Nichols, D. ; Oki, B. M.; Terry, D. (1992): Using collaborative filtering to weave an information tapestry , vol. 35, no. 12, pp. 61–70.
[10] Herlocker, J.; Konstan, J.A.; Terveen, L.; Riedl, J. (2004): Evaluating collaborative filtering recommender systems. (TOIS) 22. [11] Resnick, P.(1994): GroupLens: An Open Architecture for Collaborative Filtering of Netnews,Proc. ACM, pp. 175-186.
[12] Sarwar, B.; Karypis, G.; Konstan, J.; and Riedl, J.(2001): Item-based collaborative filtering recommendation algorithms”. In Proc. of the WWW Conference
[13] Sarwarm, B.M.(2000): Analysis of Recommendation Algorithms for E-Commerce, pp.158-167.