University of New Hampshire
University of New Hampshire Scholars' Repository
NH Water Resources Research Center Scholarship NH Water Resources Research Center
6-1-2010
Final Report: Watershed Assessment of New
Boston Air Force Station
Emily DiFranco
University of New Hampshire
William H. McDowell
University of New Hampshire, [email protected]
Follow this and additional works at:https://scholars.unh.edu/nh_wrrc_scholarship
This Report is brought to you for free and open access by the NH Water Resources Research Center at University of New Hampshire Scholars' Repository. It has been accepted for inclusion in NH Water Resources Research Center Scholarship by an authorized administrator of University of New Hampshire Scholars' Repository. For more information, please [email protected].
Recommended Citation
DiFranco, Emily and McDowell, William H., "Final Report: Watershed Assessment of New Boston Air Force Station" (2010).NH Water Resources Research Center Scholarship. 56.
Project: Watershed Assessment of New Boston Air Force Station to be completed by Emily DiFranco of the University of New Hampshire under the direction of Dr. William H. McDowell
Problem Statement:
New Boston Air Force Station (NBAFS), located in a rapidly-growing region of southern New Hampshire, has a history of past use that has potentially contaminated the water resources on the site as well as altered the site’s hydrology. Past use includes a landfill as well as training operations during WWII, primarily for use as a target site for bombing runs. Both live and inert ordnance were used during training, with thousands of bombs dropped. Many bombs detonated during training exercises, but some live ordnance remained on site after training ceased. Most of this ordnance has been identified and detonated in place over the last few decades. The impacts of these past land uses on water resources are largely unknown. Alteration of soils and
groundwater flow paths in the basin, as well as contamination from the ordnance and landfill leachate may have occurred. In the region, the uncertainty over the possible impacts of Air Force operations poses a water resources management challenge. Thus, better understanding of the hydrology and water resources issues on NBAFS will benefit regional management of water resources.
Overall Objective: Assess the quantity, quality, and distribution of surface and groundwater resources of NBAFS.
Specific Objectives:
1). Evaluate surface water flow and develop a delineated watershed profile showing surface water movement.
2). Inventory the annual inputs (precipitation)and outputs (evapotranspiration and streamflow) for NBFAS using the hydrologic model BROOK90.
3). Identify groundwater flow paths and lake level fluctuations throughout the year.
Objective 1: Evaluate the surface water flow and develop a delineated watershed profile showing surface water movement.
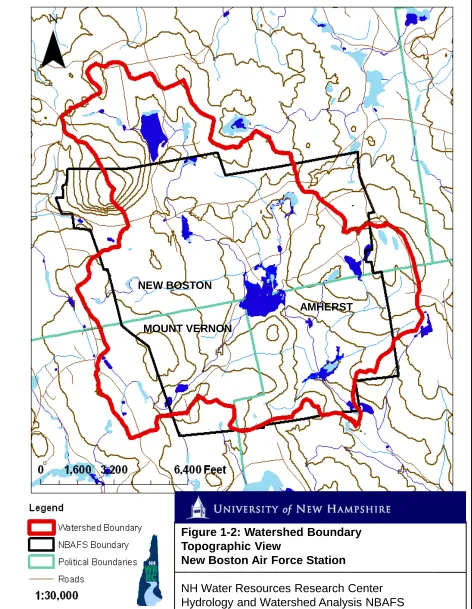
Deliverable 1: Watershed delineation and surface water flow maps:
1). Watershed delineation: Aerial and topographic views
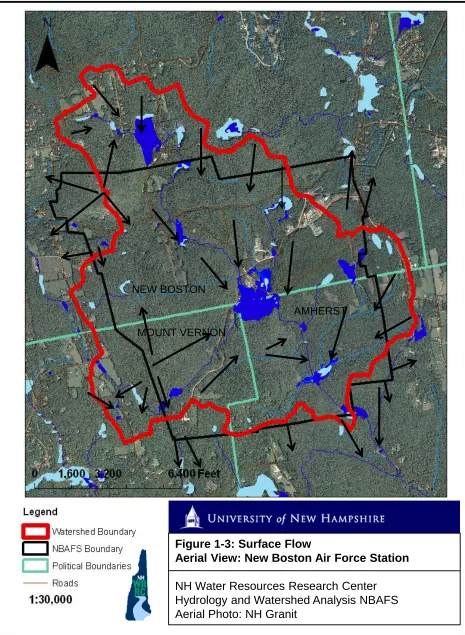
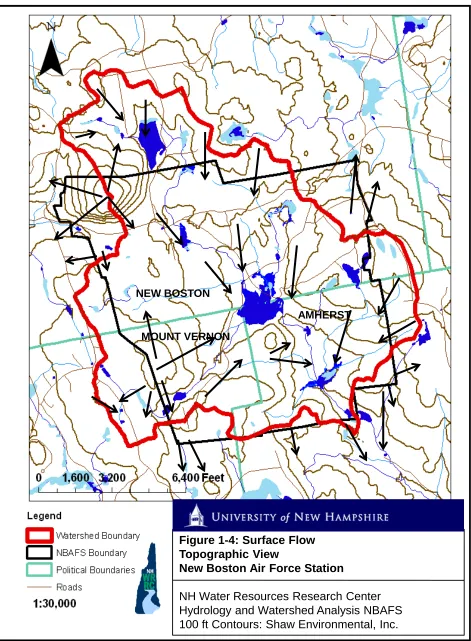
2). Surface water flow map: Aerial, topographic, and water body view
Summary:
NEW BOSTON
MOUNT VERNON
AMHERST
Figure 1-1: Watershed Boundary
Aerial View: New Boston Air Force Station
Figure 1-2: Watershed Boundary Topographic View
New Boston Air Force Station
NH Water Resources Research Center Hydrology and Watershed Analysis NBAFS 100 ft Contours: Shaw Environmental, Inc.
NEW BOSTON
MOUNT VERNON
NEW BOSTON
MOUNT VERNON
AMHERST
Figure 1-3: Surface Flow
Aerial View: New Boston Air Force Station
Figure 1-4: Surface Flow Topographic View
New Boston Air Force Station
NH Water Resources Research Center Hydrology and Watershed Analysis NBAFS 100 ft Contours: Shaw Environmental, Inc.
NEW BOSTON
MOUNT VERNON
Objective 2: Inventory the annual inputs (precipitation)and outputs (evapotranspiration and streamflow) for NBAFS using the hydrologic model BROOK 90.
Deliverable 2: Completion of BROOK 90 model
1). Detailed description of model and parameters
2). Graphical and tabular presentation of the water budget for NBAFS from 11/07- 2/09
Model Summary:
BROOK 90 is a simulation model for evaporation, soil water, and streamflow developed by C. Anthony Federer. It was originally designed for use at the Hubbard Brook Experimental Forest in New Hampshire, but has since been used in watersheds in places as diverse as Arizona, California, Pennsylvania, and New England. BROOK 90 has been cited in over 30 publications. This model is parameter-rich and provides estimates of difficult to measure variables of a local water budget, such as evapotranspiration and soil water movement, at a daily-time step. Streamflow can be modeled making BROOK 90 particularly useful in areas that may be inaccessible to continuous on-site field work provided there is some background knowledge of watershed characteristics.
Input variables:
BROOK 90 input files allow for the input of the following variables (only starred variables are required:
1). Year* 2). Month*
3). Day of the month*
4). Solar radiation on a horizontal surface (MJ/m2) 5). Maximum temperature for the day (Celsius)* 6). Minimum temperature for the day (Celsius)* 7). Average vapor pressure for the day (kPa) 8). Average wind speed for the day (m/s)* 9). Precipitation for the day (mm)*
10). Measured streamflow for the day (can be predicted by the model if there is no measured streamflow available).
Input Parameters:
Location Parameters: These parameters are site specific. Latitude, slope (overall slope of watershed from highest to lowest point) and aspect (direction the watershed faces) of the watershed are required and were estimated from topographic and watershed maps of NBAFS.
Flow Parameters: These parameters are also site specific and affect infiltration and drainage. The initial values provided in the model were designed for Hubbard Brook Watershed 6, a moderately steep, forested watershed. Parameters were changed only slightly, as most of the parameters were within a range of values appropriate for NBAFS. Many of these parameters were determined from suggestions provided in the BROOK 90 documentation for specific types of geographic locations. The percent of impervious surfaces influence the timing of peak flows and were estimated from land cover maps of the installation.
Canopy Parameters: These parameters depend on the type and height of the dominant vegetation within the watershed and are necessary to determine the amount of water lost to transpiration. Many of these parameters were determined from provided tables in the BROOK 90 documentation for specific types of land cover.
Soil Parameters: These parameters are important to determine infiltration rates and were determined from soil maps created by Shaw Environmental, Inc.
Fixed Parameters: These parameters were set in the original model, and it was not advised to change them for a specific location.
Output Variables:
BROOK 90 uses the inputted weather data to produce modeled estimates for the following variables:
- Discharge (mm/day, month, year): amount of water leaving the watershed through a stream outlet (in this case, JEB)
- Evapotranspiration (mm/day, month, year): amount of water returned to the atmosphere through a combination of evaporation and transpiration (from plants)
- Soilwater (mm/day, month, year): amount of water stored in the soil - Groundwater (mm/day, month, year): amount of water stored in the
Conclusions:
This model allows for an understanding of the water budget of a watershed and allows for predominant pathways of water movement throughout the year to be determined. Assuming water enters the watershed solely through precipitation (measured), the major losses are due to discharge and evapotranspiration (modeled) and the major storage reservoirs are soil water and groundwater (modeled).
Most water that enters the base leaves as discharge through the outlet JEP (Table 2-1). Precipitation is highest in the spring and fall (2008). Highest discharge occurs in March 2008 which can be expected due to the spring melt. Lowest discharge occurs in the summer months (2008) as more water is removed from the soil by plants and evapotranspiration is highest (due to increased solar radiation and temperatures). In general, evapotranspiration is lowest in the winter months, as plants are dormant and temperatures are low. Soil water and groundwater are lowest in the summer which is expected due to lower precipitation and higher demand from plants.
Table 2-1: Monthly water budget for New Boston Air Force Station (November 2007-February 2009) Month Year Precipitation (mm/month) Discharge (mm/month) Evapotranspiration (mm/month) Soil Water (mm/month) Groundwater (mm/month)
November 2007 87.86 73.24 9.11 186.98 5.39
December 2007 55.5 45.14 5.51 189.82 6.27
January 2008 44.2 52.52 7.25 179.14 2.5
February 2008 191.76 110.2 13.86 188.38 5.94
March 2008 125.73 165.52 13.9 189.47 5.83
April 2008 23.1 38.72 17.32 161.93 0.79
May 2008 14.16 7.39 35.97 133.6 0.22
June 2008 105.65 4.06 116.38 119 0.03
July 2008 158.48 9.37 96.62 169.32 2.21
August 2008 121.91 53.54 107.36 132.22 0.32
September 2008 227.04 73.24 91.92 188.51 5.9
October 2008 71.12 41.84 24.77 190.51 8.41
November 2008 108.71 82.11 9.45 194.13 11.62
December 2008 108.71 123.75 7.99 185.54 5.64
January 2009 51.29 28.92 6.86 172.13 1.3
February 2009 35.29 38.77 9.82 190.62 4.6
Figure 2-1: Water budget for NBAFS watershed for November and December 2007
Figure 2-2: Water budget for NBAFS watershed for 2008
10*Flow
SNOW SWAT 10*EVAP
PREC
FLOW‐MESFL
10*Flow
SNOW SWAT 10*EVAP
PREC
Figure 2-3: Water budget for NBAFS for January and February 2009
* 10*FLOW = 10 * Discharge at the outlet; 10* MESFL = 10 * any measured flow at outlet (as this variable is always 0 for this case, it is absent from the graph); 10* EVAP = 10 * water lost to evaporation; PREC = amount of precipitation; SWAT = amount of stored in the soil; SNOW = amount of water held as snowpack; FLOW-MESFL = difference between the estimated
discharge and measured discharge (as there was no measured discharge, this variable can be ignored).
FLOW‐MESFL
PREC
10*EVAP
SWAT
10*Flow
Objective 3: Identify groundwater flow paths and JEP level fluctuations throughout the year.
Deliverable 3: Completion of identification of groundwater flow paths
1). Graphical presentation of annual JEP surface level fluctuation
2). Graphical presentation of monthly groundwater depths relative to JEP surface elevation
3). Map of monthly groundwater flow paths within watershed
4). Map of surrounding private and public wells (wells that may be affected will be noted)
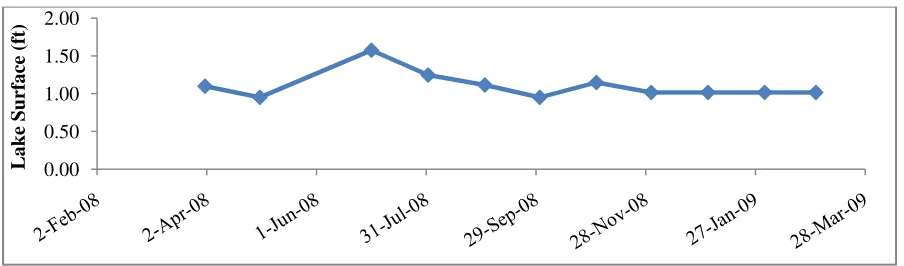
Annual lake surface level fluctuation:
The surface of JEP fluctuated 0.623 ft from April 2008 to March 2009. JEP was highest in July 2008 and lowest in May and October 2008. From December 2008 to March 2009, JEP was visibly frozen and did not fluctuate (Figure 3-1).
Figure 3-1: JEP Surface Fluctuation from April 2008 to March 2009 (measured at Daughton’s Landing)
Annual relative groundwater elevation fluctuations:
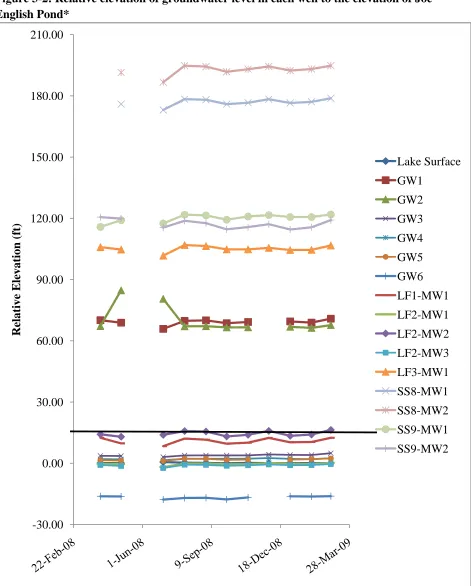
The depth to groundwater (DTWT) was measured once a month from April 2008 to March 2009 from fifteen wells scattered throughout the NBAFS (Figure 3-4). Surface level of Joe English Pond was also measured throughout this period. Wells located close to JEP as well as the lake itself were surveyed together to determine relative elevation of groundwater
throughout the year. Wells located farther uphill in the watershed were not surveyed as their locations were well above JEP, and the accuracy of surveying was not necessary in these cases as a margin of error of ± 10 ft was deemed acceptable for these wells. Previous elevation data from Shaw Environmental (determined to have a margin of error of ± 10 ft ) was used to determine relative elevation to the lake surface for these wells.
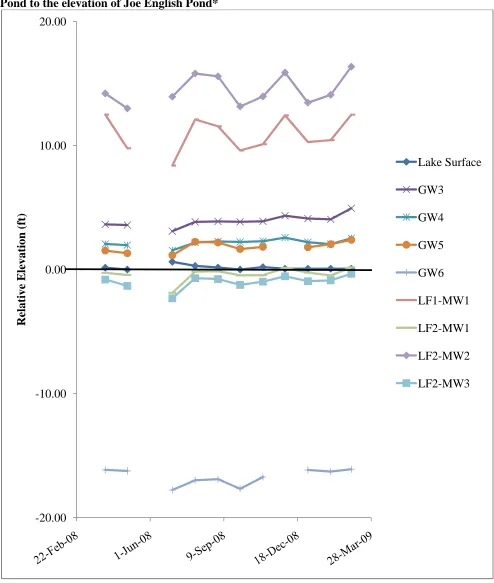
Relative elevation of groundwater to JEP surface can be used as an indication of groundwater flow direction. If the relative elevation of the groundwater for a sample date is above the relative elevation of JEP for that date, water is expected to flow from the well towards
0.00 0.50 1.00 1.50 2.00
the lake. If the relative elevation of the groundwater for a sample date is below the relative elevation of JEP for that date, water is expected to flow from JEP towards the well. In the graphs below, most of the groundwater in the studied wells flows towards JEP on the base for most of the year (Figures 3-2 and 3-3). However, by examining the wells closer to JEP, three wells (GW-6, LF2-MW1, LF2-MW3) consistently have groundwater below the level of the lake, indicating these wells receive water from JEP (Figure 3-3).
Figure 3-2: Relative elevation of groundwater level in each well to the elevation of Joe English Pond*
* From April 2008 to March 2009 (if relative groundwater elevation is below relative lake elevation (approximately 0 ft, note reference line), water drains from Joe English Pond towards that well)
-30.00 0.00 30.00 60.00 90.00 120.00 150.00 180.00 210.00
Relative Elevation (ft)
Lake Surface
GW1
GW2
GW3
GW4
GW5
GW6
LF1-MW1
LF2-MW1
LF2-MW2
LF2-MW3
LF3-MW1
SS8-MW1
SS8-MW2
SS9-MW1
Figure 3-3: Relative elevation of groundwater level in each well located near Joe English Pond to the elevation of Joe English Pond*
* From April 2008 to March 2009 (if relative groundwater elevation is below relative lake elevation (approximately at reference line), water flows from Joe English Pond towards that well)
-20.00 -10.00 0.00 10.00 20.00
Relative Elevation (ft)
Lake Surface
GW3
GW4
GW5
GW6
LF1-MW1
LF2-MW1
LF2-MW2
Monthly groundwater flowpaths within the NBAFS watershed:
Overall, groundwater flow direction determined from DTWT in the monitoring wells appears to follow topographic contours and flows southeast towards the outlet (Figure 3-5). As such, most groundwater within the northern section of the NBAFS installation boundaries drains towards JEP. However, as the watershed boundary does not match up exactly with the
installation boundaries, it is likely that some groundwater is leaving NBAFS. The southeast corner of NBAFS includes the outlet of JEP and most likely transfers both surface and
groundwater off-site. Further, the northeast corner of the base, near wells MW1 and SS9-MW2, is located outside of the watershed boundary. Though it is clear that water from JEP is not flowing towards those wells, it is unclear with the data collected if the groundwater in those wells is flowing towards the lake by crossing the watershed boundaries, or if the groundwater is flowing northeast (similar to surface flow) and off of the boundaries of NBAFS. Based on the direction of flow determined for NBAFS, it is more likely that the groundwater is flowing offsite and follows surface flow paths.
Surrounding Private and Public Wells:
Figure 3-4: Groundwater Monitoring Wells Location: Aerial View
New Boston Air Force Station
Figure 3-5: Groundwater Monitoring Wells Flow Direction: Topographic View
New Boston Air Force Station
NH Water Resources Research Center Hydrology and Watershed Analysis NBAFS
Figure 3-6: Location of Public and Private Wells: Aerial View
New Boston Air Force Station
NH Water Resources Research Center Hydrology and Watershed Analysis NBAFS Aerial Photo: NH Granit
NEW BOSTON
AMHERST NEW BOSTON
Figure 3-7: Groundwater Flow Direction: Public and Private Wells: Topographic View
New Boston Air Force Station
NH Water Resources Research Center Hydrology and Watershed Analysis NBAFS
100 ft Contour Intervals: Shaw Environmental, Inc.
Estimated Groundwater Flow
Measured Groundwater Flow
Objective 4: Identify potential contaminant migration through ground and surface water flow paths using water quality data from Shaw Environmental, Inc.
Deliverable 4: Completion of water quality assessment and contaminant migration/transport.
1). Written report assessing water quality data obtained by Shaw Environmental, Inc. with respect to identified ground and surface water flow paths.
Methods:
Through analysis of the NBAFS Comprehensive Site Evaluation (CSE) Phase II report and NBAFS Site Investigation (SI) report completed by Shaw Environmental, Inc. and received from Jeff Oja on June 16, 2009, an evaluation of the ground and surface water quality on NBAFS was undertaken. Two pieces of this report, entitled “IRP Site Descriptions and Investigation Results” and “Munitions Response Site Characteristics,” provided current
groundwater quality data from three wells near JEP (GW3, GW4, and LF001-MW1), and surface water quality data from JEPand JEB, respectively. For the purposes of this study, only water samples from the wells used in this study, as well as those from JEP and JEB were obtained from the report. The regulatory limits of any potential contaminants were then obtained from
established EPA Maximum Contaminant Levels (MCLs), EPA Secondary MCLs, EPA Health Advisory Levels, EPA Water and Fish Ingestion Guidelines, and NHDES Ambient Groundwater Quality Standards. Many of the potential contaminants had no published regulatory limit.
Overall, most potential contaminants of concern found in the ground or surface water on NBAFS originated from unexploded ordnance, oil, landfill leachate, and degraded metals from machinery. Human health effects range from short-term nausea and skin irritation, to long term damage to major bodily organs and cancer (EPA, 2009). A list of potential contaminants, their concentrations found in ground and surface water on NBAFS, and established regulatory limits for each potential contaminant are listed in Table 4-1. These standards were used as a
benchmark for water quality as nearby residents relying on private wells should be notified if any water originating from NBAFS that enters their wells exceeds regulatory limits so residents can determine if their well is also contaminated and poses health risks.
Data Summary:
Based on the most recent data available for an individual location (Table 4-1), it can be seen that one contaminant exceeded the established regulatory limits in surface water. For surface water, JEP was analyzed for 11 explosives on 1 date, and of these, 1 exceeded regulatory limits. JEB was analyzed for 11 explosives on 2 dates, and of these, none exceeded regulatory limits. JEP and JEB were analyzed for 11 metals on 2 dates, and of these, 3 exceeded the regulatory limit. For groundwater, six wells were sampled for 21 metals and of these, 2 exceeded regulatory limits. However, as discussed in the CSE Phase II report, theses analytes were determined to be attributable to background concentrations. Groundwater was not analyzed for explosive contaminants.
Future Sampling Recommendations:
A background determination for metal concentration in surface and groundwater was carried out by Shaw Environmental, Inc. on conservation lands that border the installation. They found that concentrations of aluminum, chromium, copper, iron, manganese, lead, and mercury were attributable to background. Because one explosive contaminant was found to exceed regulatory limits in surface water, it is recommended that monitoring of this site continue. Further, though many potential contaminants were below detection limits, some detection limits were above a set regulatory limit. As such, it is recommended that future sampling of both ground and surface water for these potential contaminants should be conducted with lower detection limits.
The temporal and spatial variability in water quality may not be accounted for in this study as individual wells or surface water sites were sampled only once. Water quality, particularly surface water quality, can vary with season and during precipitation events which cause a flushing of nearby soils. It is likely that the concentrations of potential contaminants vary both annually and throughout a given year. Further, many of the sampling locations were not analyzed for the same list of potential contaminants (i.e. groundwater was not sampled for explosives). As such, it is possible that not all potential contamination was identified with this current sampling analysis. It is recommended that a more regular and extensive sampling regime of groundwater wells, JEP, and JEB be implemented to account for both spatial and temporal fluctuations in water quality as well as to monitor current locations where concentrations exceed the regulatory limit.
Figure 4-1: Groundwater Monitoring Wells Flow Direction and Water Quality Flowpath:
Topographic View: New Boston Air Force Station
NH Water Resources Research Center Hydrology and Watershed Analysis NBAFS
100 ft Contour Intervals: Shaw Environmental, Inc.
GW1
GW2
LF001-MW1
GW3 GW4
JEP
JEB GW5
Table 4-1: Ground and surface water concentrations (µg/L) of potential contaminants on NBAFS
Location LF001-MW1 GW-3 GW-4 JEP JEB
Water Type Ground Ground Ground Surface Surface
Analyte Regulatory Limit (µg/L) Results Results Results Results Results
Explosives (µg/L)
2,4,6-Trinitrotoluene NEL BDL! BDL!
2,4-Dinitrotoluene 0.11 0.33! BDL!
2,6-Dinitrotoluene 0.11 BDL! BDL!
2-Amino-4,6-Dinitrotoluene 0.11 BDL! BDL!
4-Amino-2,6-Dinitrololuene 0.11 BDL! BDL!
Nitrocellulose NEL BDL! BDL!
Nitroglycerin NEL BDL! BDL!
RDX NEL BDL! BDL!
Tetryl NEL BDL! BDL!
Perchlorate 15 BDL!
Metals (µg/L)
Aluminum 50 BDL* BDL* BDL* 828! BDL!
Antimony 6 BDL* BDL* BDL* BDL! BDL!
Arsenic 10 BDL* BDL* BDL*
Barium 2000 BDL* BDL* BDL*
Beryllium 4 BDL* BDL* BDL*
Cadmium 5 BDL* BDL* BDL*
Calcium NEL 4610* 14100* 11000* 2120! 2100!
Chromium 100 BDL* BDL* BDL* BDL! BDL!
Copper 1300 BDL* BDL* BDL* BDL! BDL!
Iron 300 BDL* BDL* BDL* 2660! 384!
Lead Action Limit 15 BDL* BDL* BDL* BDL! BDL!
Magnesium NEL BDL* BDL* BDL* BDL! BDL!
Manganese 50 15.1* BDL* BDL* 206! 69!
Mercury 2 BDL* BDL* BDL* BDL! BDL!
Potassium 35000 BDL* BDL* BDL*
Selenium 50 BDL* BDL* BDL*
Silver 100 BDL* BDL* BDL*
Sodium 100-250 mg/L BDL* 16700* BDL*
Thallium 2 BDL* BDL* BDL*
Vanadium NEL BDL* BDL* BDL*
Zinc 5000 BDL* BDL* BDL* BDL! BDL!
Sample Dates: October 2006!; August 2007*
NEL: No established limit
BDL: Below Detection Limits
EPA 2009 Maximum Contaminant Level (national drinking water standards) (EPA, 2009)
EPA 2009 Secondary Maximum Contaminant Level (contamination level that affects aesthetic characteristics of drinking water (EPA, 2009a)
NHDES Ambient Groundwater Quality Standards (Shaw Environmental, Inc. 2009)
EPA Health Advisory Level (EPA, 2009b)
EPA Water and Fish Ingestion Standard (EPA, 2009c)
Exceeds regulatory limit
BDL, however detection limit exceeds regulatory limit
Title
: Watershed Assessment of New Boston Air Force Station (NBAFS)
Emily DiFranco and William H. McDowell
University of New Hampshire
y
p
Research Objectives
:
•
Delineate the watershed on NBAFSSurface Water Flow:
Figure 2: NBAFS watershed and surface water flow direction
Study Purpose
:
•Assess the quantity and distribution of surface and groundwater resources of NBAFS
Delineate the watershed on NBAFS •Determine surface and groundwater flow paths within NBAFS
•Create an annual hydrologic budget using the model BROOK 90
•Evaluate current water quality data
Hydrologic Budget:
Figure 1: Annual hydrologic budget for NBAFS
200 250
Groundwater Flow:
Figure 3: NBAFS groundwater wells and groundwater flow direction
50 100 150 mm/month P Q Et GW
Summary of Hydrologic Budget:
0y
y
g
g
Most water that enters the base as precipitation (P) leaves as discharge (Q) through Joe English Brook. Precipitation was highest in the spring and fall. Highest discharge occurred in March (spring melt). Lowest discharge occurred in the summer months. In general, evapotranspiration (Et) was lowest in the winter months. Groundwater (GW) was lowest in the summer due to lower precipitation and higher demand from plants.
References:
Federer, C.A., C. Vörösmarty, and B. Fekete. 2003. Sensitivity of annual evaporation to soil and root properties in two models of contrasting complexity. J Hydrometeorology 1290.
Shaw Environmental, Inc., New Boston Air Force Station Preliminary Assessment/Site Investigation Installation Restoration Program: Final Work Plan, May 2007.
Shaw Environmental, Inc., New Boston Air Force Station CSE Phase II: Received June 16, 2009.
U.S. Environmental Protection Agency, Drinking Water Contaminants; updated March 18, 2009 <http://www.epa.gov/safewater/contaminants/index.html>, accessed April 8, 2009.
U.S Environmental Protection Agency (a), Secondary Maximum Contaminant Levels; updated November 28, 2006 < http://www.epa.gov/OGWDW/consumer/2ndstandards.html >, accessed July 7, 2009.
U.S. Environmental Protection Agency (b), Drinking Water Contaminants; updated January 13, 2009 < http://www.epa.gov/ogwdw000/contaminants/unregulated.html >, accessed July 6, 2009.