An evaluation of current lunchroom food waste and food
rescue programs in a Washington state school district
Courtney L. Schupp,a * Katherine M. Getts,b and Jennifer J. Otten c University of Washington
Submitted October 2, 2017 / Revised December 21, 2017, and January 20 and February 9, 2018 / Accepted February 9, 2018 / Published online April 5, 2018
Citation: Schupp, C. L., Getts, K. M., & Otten, J. J. (2018). An evaluation of current lunchroom food waste and food rescue programs in a Washington state school district. Journal of Agriculture, Food Systems, and Community Development, 8(1), 167–186. https://doi.org/10.5304/jafscd.2018.081.013
Copyright © 2018 by the Authors. Published by the Lyson Center for Civic Agriculture and Food Systems. Open access under CC BY license.
Abstract
Public schools waste approximately 30% to 50% of edible food and thus provide opportunities to study the problem of food waste and explore food rescue initiatives. This case study evaluates lunch-room waste sorting and food waste diversion prac-tices in a Washington State school district. It pro-vides a comprehensive analysis including descrip-tive characteristics and comparadescrip-tive statistical analyses to determine the types and amount of edible, wasted food and the potential to reduce or recover this wasted food. Waste audits were performed at 18 schools to quantify the amount and type of waste generated at each school. Audits
consisted of weighing, sorting, and recording the pre and post-sort weights of all lunchroom com-post, recycling, and trash. Edible, rescuable food items were removed from bags and counted separately. Lunchroom-specific observational data, including lunchroom layout and implementation of food rescue programs, were also recorded.
Statistical analysis evaluated the effect of these programs on lunchroom waste sorting. Data revealed significantly higher post-sort compost rates than pre-sort rates and significantly lower post-sort trash rates than pre-sort rates. Pre- and post-sort recycling rates were not significantly
a * Corresponding author: Courtney L. Schupp, Nutritional
Sciences Program, School of Public Health, University of Washington; Box 353410; Seattle, WA 98195 USA; +1-716-566-8573; [email protected]
b Katherine M. Getts, MPH, RD, Center for Public Health
Nutrition, School of Public Health, University of Washington; [email protected]
c Jennifer J. Otten, PhD, RD, Nutritional Sciences Program,
Department of Environmental and Occupational Health Sciences, School of Public Health, University of Washington; [email protected]
Author Note
This study is part of Courtney L. Schupp’s master’s thesis research. Portions of this study were published and presented in a report for city officials of the City of Auburn,
Washington, as part of the University of Washington Livable City Year, Spring 2017.
Funding Disclosure
different. This suggests that a significant amount of trash could be diverted from landfills with imple-mentation of a lunchroom composting system. Additionally, participation in sustainability initia-tives, such as a county-wide resource conservation program, and use of lunchroom monitors affected waste sorting. Further, audits uncovered a large amount of wasted, edible food. This type of food could potentially be diverted to feeding students or community members experiencing food insecurity by means of food rescue programs, such as lunch-room food share programs or school-to-food-bank donation services. Overall, this study identified potential points for food waste reduction strategies in public school lunchrooms.
Keywords
Compost; Food Waste; Food Recovery; Food Share Table; Public Schools; Washington State
Introduction
Food waste occurs at every point in the food system, ultimately resulting in 31% to 40% of the food introduced into the food economy going uneaten (Buzby, Wells, & Hyman, 2014; Gunders, 2017; Spiker, Hiza, Siddiqi, & Neff, 2017). This has population health and environmental health rami-fications. The food wasted in the U.S. per person per day is estimated at 1,200 calories, 33 grams of protein, and 6 grams of dietary fiber (Spiker et al., 2017). If the amount of edible wasted food could be reduced by 15% and redistributed to food insecure individuals nationwide, an additional 25 million people could be fed each year (USDA Economic Research Service, 2017). Edible food that is wasted also represents squandered labor, energy, water, and land resources. It is estimated that the U.S. wastes 16% of energy, 67% of total used U.S. freshwater, and 50% of U.S. land annually via wasted food (Gunders, 2017). In addition, diverting food from landfills to other more preferred uses could lessen the environ-mental impact of landfill-generated carbon emis-sions from food waste, which comprise 17% of landfill mass (Hickey & Ozbay, 2014).
Recently, the U. S. Department of Agriculture (USDA) and the U.S. Environmental Protection Agency (EPA) have issued calls to action to reduce
the amount of wasted food (EPA, n.d.-b; EPA, 2017b; USDA, 2012a). Large institutions such as schools are considered to be appealing sites for intervention due to their high volume of food service consumers as well as their ability to
systematize practices. The EPA has created a Food Recovery Hierarchy, which provides a guide to diverting food waste to more preferred uses. This process includes reducing the problem at the source, followed by donating extra food to feed hungry people (EPA, n.d.-a). The EPA then recommends that extra food be donated to feed animals, applied to industrial uses, or composted. The least preferred method of disposal is to send extra food to the landfill. This paper briefly reviews what is known about school food waste
prevalence, reduction, donation, and diversion efforts and examines one school district’s attempt to measure and design approaches to improve this food system problem.
milk alone could equate to 247 billion liters of wasted water as well as a yearly cost of over US$274,000 for a school district without inter-vention to reduce milk purchasing or without trying to increase consumption (Blondin et al., 2017). These findings underscore the opportunity and the need to reduce school food waste to preserve nutrient content in the food supply, conserve resources, and save districts and municipalities money.
Public schools are ideal environments for studying food waste. They have structured lunch hours, designated spaces for students to eat and throw away their lunch waste, and the same or similar daily lunch components for those students choosing on-site school lunch or participating in the NSLP. Moreover, school lunchrooms consist of a sizable and stable population of students, unlike restaurants or other foodservice institutions where the quantity and type of customers can vary from day-to-day.
Food Waste in Schools: Research Studies
As mentioned above, school lunchrooms allow for insights into food consumption and waste due to the “standardization” of the foods served by the school or district and the monitoring they receive for federal reimbursement purposes. NSLP regu-lates what foods and portions schools can serve in order to receive federal subsidies (USDA, 2012b). The meals served under NSLP are heavily researched regarding both students’ nutrient con-sumption and plate waste. Currently, the results of these studies are mixed in terms of what is con-tributing to food waste and what works well for reducing it. This is due in large part to the differing methodologies used and different endpoints reported. A systematic review of food waste related research reveals that methods such as direct weigh-ing, digital photography, in-person visual estima
-tion, and a combination of such methods effec-tively measure lunchroom waste; however, measur-ing and reportmeasur-ing results from different methods creates inconsistencies across food waste research (Byker Shanks, Banna, & Serrano, 2017). Different observation periods, study designs, and character-ization of food waste results, such as by weight, calories, and observation, also contribute to
challenges in comparing findings in the current food waste literature (Byker Shanks et al., 2017).
In general, research has not definitively shown how much or what types of foods students are most likely to waste. Younger students typically consume less and waste more of all the food they choose compared to older students; this is typical consumption behavior in younger children (Cohen Richardson, Austin, Economos, & Rimm, 2013; Niaki, Moore, Chen, & Weber 2017; Smith, Conroy, Wen, Rui, & Humphries, 2013). Studies have also shown that regulating the types of food items that students take in the lunch line, such as requiring one fruit and one vegetable for a federally subsidized lunch, increases food waste (Cohen et al., 2013; Niaki, Moore, Chen, & Weber, 2017). In addition, studies have determined that nutrient-dense items, especially fruits and vegetables, are wasted more by weight and by total amount than less nutritious foods such as refined grains and animal products (Amin, Yong, Taylor, & Johnson, 2015; Byker, Farris, Marcenelle, Davis, & Serrano, 2014; Byker Shanks et al., 2017; Cohen et al., 2013; Marlette, Templeton, & Panemangalore, 2005; Spiker et al., 2017). In contrast, research studies have found that new NSLP minimum and maxi-mum nutrient standards improve the fruit and vegetable intake of middle schoolers, thus reducing waste (Bergman, Englund, Taylor, Watkins, Schepman, & Rushing, 2014; Cohen et al., 2013). Schools utilizing Cornell University’s “Smarter Lunchroom” principles to promote fruit consump-tion also have improved consumpconsump-tion and less plate waste (Greene, Gabrielyan, Just, & Wansink, 2017). Other lunchroom studies have shown that increased time, increased choice, and smaller portion sizes each contribute to better consump-tion and less food waste in elementary and middle schools (Adams, Bruening, Ohri-Vachaspati, & Hurley, 2016; Byker et al., 2014; Cohen, Jahn, Richardson, Cluggish, Parker, & Rimm, 2016). These findings suggest a need for a combination of programs and initiatives to reduce, prevent, and divert food waste.
increased in recent years, in part to address the environmental and economic costs of food waste. However, there is variability by state, locality, dis-trict, and among grade levels (Food Rescue, 2017; ReFED, 2016). The Bill Emerson Good Samaritan Food Donation Act (1996) exempts institutions and organizations that donate food in good faith from any liability for food-related illness and injury from the donated foods. To encourage food waste reduction and food recovery, the USDA and EPA have recommended ways that schools and other large institutions can implement food recovery pro-grams. For example, the EPA’s Food Recovery Challenge encouraged 800 businesses and organiza-tions to adopt food recovery and diversion tactics, which resulted in 1.2 billion pounds of food recovered in 2015 (EPA, n.d.-b).
One promising food recovery initiative is the adoption of food share tables and areas– locations in school lunchrooms where edible and rescuable foods are set aside for consumption by other stu-dents or for donation. The USDA has created specific guidelines for the operation of food share tables within schools to encourage the reduction of wasted food (USDA, 2016a). Following the release of the USDA guidelines, some individual states and municipalities have released their own guidelines for implementing share tables throughout their state school systems (State of Connecticut Depart-ment of Education, 2017; Food Rescue, 2017; Melia, 2017). North Carolina representatives report that their share tables could collect thousands of food items annually to share amongst classmates (Terry, 2017). In Washington State, the Bremerton School District donates food share table items remaining at the end of lunch periods to a local food bank and estimates that approximately 3500 pounds of food are donated each month (EPA, 2017b).
Further food waste reduction initiatives include school-centered resource conservation educational programs, such as Washington State’s King County Green Schools Program (King Coun-ty, n.d.). This four-level program, sponsored by the King County Solid Waste Division, aims to provide schools with the ability to adopt environmentally sustainable practices through waste reduction, recycling, and energy conservation (EPA, 2017b;
King County, n.d.). The county provides training materials, recycling containers, and public recog-nition for schools that progress through the pro-gram’s levels. Some of the activities suggested by the Green Schools Program aim specifically at food waste reduction. These include the collection of compostable materials, the creation of signage for waste bins, the education of students and staff about waste prevention strategies, the adoption of a food rescue program, and the formation of a faculty and student-led Green Team to monitor lunchroom waste and lead the school’s effort in waste reduction (King County, n.d.).
Scope of the Project & Research Questions
This study focuses on the Auburn School District in King County, Washington. Auburn is a city located southeast of Seattle, Washington with a total population of 77,472. The county has 15,777 students enrolled in public elementary, middle, and high schools. The Auburn School District serves free or reduced-price school lunches to 53% of all students at all grade levels, which range from 21% to 85% of students at individual schools (Office of Superintendent of Public Instruction, n.d.). This is higher than both the national average (48%) and Washington state average (40%) of students receiv-ing free or reduced-price lunch in public schools (U.S. Department of Education, 2012). King County reports that food insecurity affects 16% of the population of the City of Auburn, which is higher than both the national average of 13% and King County average of 12% (Seattle & King County Public Health, 2013). Thus, for the City of Auburn, the possibility of finding ways to recover edible, uneaten food from schools could be impor-tant in creating additional food access for hungry students and community members. However, little is known about the quantity and type of wasted food being generated by the school district or about current school-level practices and programs aimed at reducing, recovering, and diverting wasted food.
has been on the reduction of food waste by means of food rescue and recovery programs, such as lunchroom food share programs. The City of Auburn and the Auburn School District partnered with the University of Washington to measure the quantity and type of wasted yet rescuable food in schools and the type and extent of food recovery programs within and across schools. In addition, the City of Auburn was interested in determining the potential for each school to improve food compost rates by comparing the current trash, recycling, and composting practices between schools that did or did not compost at the time of this evaluation. We hypothesized that schools (a) with composting systems were likely adhering to waste sorting standards better than schools without composting systems, (b) participating in the King County Green Schools Program were likely adher-ing to waste sortadher-ing standards and waste reduction better than those not participating in the program, and (c) with food share programs were likely adhering to waste sorting standards better than those without food share programs.
Methods
Sample
From February through March of 2017, four teams completed one-day waste audits at 18 out of 22 schools in the Auburn School District in King County, Washington: two high schools (50% of all district high schools), two middle schools (50% of all district middle schools), and 14 elementary schools (100% of all district elementary schools). Representatives from the City of Auburn, Auburn School District, and the King County Green Schools Program collaborated with University of Washington researchers to inform and obtain approval from Auburn school faculty and staff for this project.
Data Collection
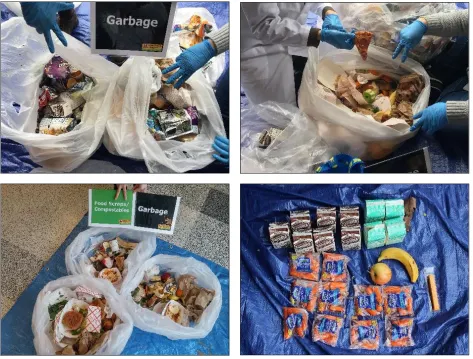
Data from waste audits were collected using a “trash-on-a-tarp” method, whereby waste audit teams sorted through aggregated lunchroom waste at each school to determine the school’s sorting rates. To ensure consistency in auditing, King County representatives provided an orientation and
on-site waste audit training to four University of Washington audit teams, consisting of two or three undergraduate students per team. The orientation provided information and hands-on training about which waste items belonged in the trash, recycling, and compost bins, according to King County Solid Waste processing guidelines. The on-site waste audit training allowed each team to perform a complete waste audit with expert supervision and oversight from King County and Auburn represen-tatives. After the on-site training, the auditing teams independently performed all remaining audits, and King County representatives were available for consultation via mobile phone text applications to help ensure accuracy and consis-tency. Auburn School District representatives provided in-person check-ins at the outset of every audit to ensure all audit teams had access to and knowledge of available waste locations and on-site personnel with whom they could talk and ask questions if needed.
Rescuable food found in waste bags during sorting was set aside, recorded, and photographed separately. These items included certain whole fruits, such as apples, bananas, oranges and fruits with intact peels; single serving sealed baby carrot packages; fully sealed milk and other beverage containers; sealed applesauce or yogurt containers; and other single serving factory-sealed food items such as granola bars. Counts of rescuable food items were recorded after all waste bags were properly sorted. Full, unwrapped, and uneaten entrees found in lunchroom waste bins were not considered rescuable due to food safety liability.
Audit teams collected the following data, often using field photographs to illustrate observational
usage of food share programs or areas. Lunchroom observations included finding the food share area, noting its surroundings, noting any signage defin-ing the area, and identifydefin-ing if it was used durdefin-ing any or all lunch periods. Field observations also included conversations with school Green Team members and/or faculty and staff about current school efforts to foster environmentally sustainable practices.
Information regarding each school’s popula-tion size, percentage of students utilizing free and reduced-price school lunches, and Green Schools Program level was identified through the Office of Superintendent of Public Instruction Washington State Report Card and through the King County Green Schools Program website. This information was then used to better contextualize each school’s current practices, sustainability initiatives, waste practices, and food sharing programs.
Statistical Analyses
Pre- and post-sort waste weights by type and by school were entered in Microsoft Excel (version 16.0) to calculate and describe the school’s current and potential waste, recycling, and compost rates. Pre-sort and post-sort weights by type were divided by total lunchroom waste weight to calculate current and potential compost, recycling, and trash rates. Observational data on current food waste and sustainability practices were compiled and reported in summary.
Statistical analyses were performed using R statistical software (version 3.4.1). Pre-sort and post-sort means for compost, recycling, and trash rates were calculated, and paired t-tests were used to examine differences between pre-sort and post-sort means. Welch two sample t-tests were used to determine statistical significance of the mean dif-ferences between pre-sort and post-sort compost, recycling, and trash rates. Mean differences were compared for schools with and without the fol-lowing: composting systems, participation in King County Green Schools Program, presence of a student Green Team, presence of a staff and/or faculty lunchroom waste monitor, and presence of a food share system. Lastly, Welch two sample t-tests were used to compare the mean differences of pre-sort to post-sort rates between elementary
versus middle and high schools to determine if there were significant differences in sorting rates by different grade levels. T-tests were used due to their simplicity and ease to test multiple hypothe-ses. More complicated statistical testing would not address each individual hypothesis and adequately compare the variables we hoped to explore in this investigation. Statistical significance was set at a p -value of 0.05. No correction was used to establish statistical significance due to the nature of this study. Exploratory studies such as this do not typically require a correction, as the results are preliminary and statistical significance suggests the need for further investigation of each variable (Armstrong, 2014). Thus, all results and p-values are presented in these results to address hypotheses formed prior to and during this investigation.
Results
Descriptive Results
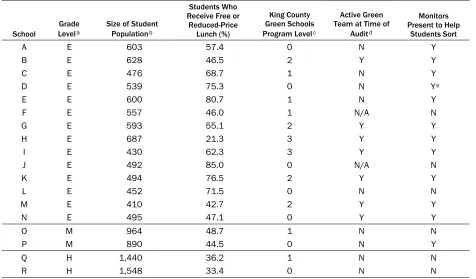
Descriptive information for the audited schools is displayed in Table 1, including each school’s popu-lation size, percentage of students eligible for free or reduced-price school lunch, and participation in waste-reduction and sustainability-focused pro-gramming. Between 21% and 85% of students received free or reduced-price lunch.
Table 1 also describes each school’s level of participation in the King County Green Schools Program. Seven schools were not participating at any level and 11 schools were participating in at least Level 1, which focused on waste reduction (n=5 at Level 1; n=4 at Level 2; and n=2 at Level 3). This variation allowed for both observational and statistical comparison based on the expectation that the schools participating in Level 1 or greater
would have better overall sorting rates and less contamination in all waste bins. Half the observed elementary schools (n=7) and no middle or high schools had active student-led Green Teams pre-sent at the waste audit. Two-thirds of the schools audited (12 of 18) utilized adult lunchroom moni-tors to instruct students on proper sorting prac-tices. Observations during waste audits found Green Teams, monitors, and sustainability advo-cates to be involved in lunchroom waste sorting.
Lunchroom Characteristics
Lunchroom specific observations related to organ-ization and feasibility of waste bins and associated lunch waste areas are summarized in Table 2. All 18 schools had color-coded waste bins lined with clear plastic bags placed next to each other to promote easier sorting. Thirteen of the 18 schools utilized some form of signs or labels on waste bins
Table 1. Characteristic Data for All Schools Audited
School
Grade
Levela Size of Student Populationb
Students Who Receive Free or
Reduced-Price Lunch (%)
King County Green Schools Program Levelc
Active Green Team at Time of
Auditd
Monitors Present to Help
Students Sort
A E 603 57.4 0 N Y
B E 628 46.5 2 Y Y
C E 476 68.7 1 N Y
D E 539 75.3 0 N Ye
E E 600 80.7 1 N Y
F E 557 46.0 1 N/A N
G E 593 55.1 2 Y Y
H E 687 21.3 3 Y Y
I E 430 62.3 3 Y Y
J E 492 85.0 0 N/A N
K E 494 76.5 2 Y Y
L E 452 71.5 0 N N
M E 410 42.7 2 Y Y
N E 495 47.1 0 Y Y
O M 964 48.7 1 N N
P M 890 44.5 0 N Y
Q H 1,440 36.2 1 N N
R H 1,548 33.4 0 N N
a E = elementary school; M = middle school; H = high school b Size of student population is based on data collected in May 2016
c 0 = not currently participating in King County Green Schools Program; 1,2,3 = current King County Green Schools Program level d Y = yes; N = no; N/A = information not acquired at this school
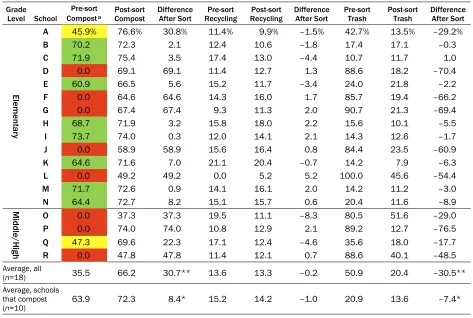
Table 3. School Lunchroom Data on Current Versus Potential Compost, Recycling, and Trash Rates
Grade
Level School
Pre-sort
Composta Post-sort Compost Difference After Sort RecyclingPre-sort RecyclingPost-sort Difference After Sort Pre-sort Trash Post-sort Trash Difference After Sort
Ele
m
ent
ary
A 45.9% 76.6% 30.8% 11.4% 9.9% –1.5% 42.7% 13.5% –29.2%
B 70.2 72.3 2.1 12.4 10.6 –1.8 17.4 17.1 –0.3
C 71.9 75.4 3.5 17.4 13.0 –4.4 10.7 11.7 1.0
D 0.0 69.1 69.1 11.4 12.7 1.3 88.6 18.2 –70.4
E 60.9 66.5 5.6 15.2 11.7 –3.4 24.0 21.8 –2.2
F 0.0 64.6 64.6 14.3 16.0 1.7 85.7 19.4 –66.2
G 0.0 67.4 67.4 9.3 11.3 2.0 90.7 21.3 –69.4
H 68.7 71.9 3.2 15.8 18.0 2.2 15.6 10.1 –5.5
I 73.7 74.0 0.3 12.0 14.1 2.1 14.3 12.6 –1.7
J 0.0 58.9 58.9 15.6 16.4 0.8 84.4 23.5 –60.9
K 64.6 71.6 7.0 21.1 20.4 –0.7 14.2 7.9 –6.3
L 0.0 49.2 49.2 0.0 5.2 5.2 100.0 45.6 –54.4
M 71.7 72.6 0.9 14.1 16.1 2.0 14.2 11.2 –3.0
N 64.4 72.7 8.2 15.1 15.7 0.6 20.4 11.6 –8.9
Middle/H
igh
O 0.0 37.3 37.3 19.5 11.1 –8.3 80.5 51.6 –29.0
P 0.0 74.0 74.0 10.8 12.9 2.1 89.2 12.7 –76.5
Q 47.3 69.6 22.3 17.1 12.4 –4.6 35.6 18.0 –17.7
R 0.0 47.8 47.8 11.4 12.1 0.7 88.6 40.1 –48.5
Average, all
(n=18) 35.5 66.2 30.7** 13.6 13.3 –0.2 50.9 20.4 –30.5**
Average, schools that compost
(n=10) 63.9 72.3 8.4
* 15.2 14.2 –1.0 20.9 13.6 –7.4*
Current percentages are based on pre-sort rates, which represent how students are currently sorting waste. Potential numbers are based on post-sort rates, which represent the true rates if all waste had been properly sorted by students. Schools that do not compost are excluded from the averages in the last row.
aRed = no compost system in place; Yellow = composting <50% of overall waste; Green = composting >50% of overall waste.
*p<0.05; **p<0.001
Table 2. Lunchroom-specific Observational Data Recorded During Waste Audits
School A B C D E F G H I J K L M N O P Q R
Grade Level E E E E E E E E E E E E E E M M H H
Lunchroom Characteristic Observation at Each School
Waste bins are placed next
to each other Y Y Y Y Y Y Y Y Y Y Y Y Y Y Y Y Y Y
Waste bins are color coded Y Y Y Y Y Y Y Y Y Y Y Y Y Y Y Y Y Y
Bins use clear plastic bags Y Y Y Y Y Y Y Y Y Y Y Y Y Y Y Y Y Y
Signs/labels indicate
contents of each bin Ya Ya Ya Ya Ya Y N Y Y N Y N Y Y N N Ya Ya
Lunchroom has a liquid
dump container Y Y Y Y Y Y Y Y Y Y Nb N Y Y Y Y N N
Food share area present Y Y Yc Yc Yc Y Y Y Y N Y N Y N Yc Yc Yc N
Y = yes; N = no
aNot all bins had visible labels and/or not all labels were 3-dimensional
to indicate what items belonged in each bin. Most schools that did have signage at every bin and at every station did not include signs with physical examples of which items belong in each bin. A few elementary schools utilized three-dimensional signs as a teaching aid. In addition, one school utilized signs in both English and Spanish.
Most elementary schools (12 of 14) and both middle schools, but neither high school, used liquid dump containers as a part of their waste sorting routine. Two elementary schools were observed to have a sorting protocol implemented into the school’s lunch routine.
Specifically, these schools had tables and waste bins arranged for students to first remove silverware, then to dump leftover liquids, then to sort recycling, garbage, and compost, and finally to stack lunch trays on the last table. Some schools lacked basic sorting instructions, such as signage indicating which items belong in which waste bins. Lastly, 14 of the 18 schools had a food share area present.
Analytical Results
Current vs. potential compost, recycling, and trash rates
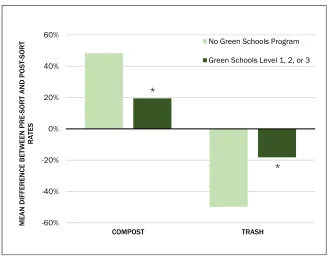
Table 3 shows pre-sort and post-sort compost, recycling, and trash rates as well as the difference between these rates for the schools’ lunchrooms. Eight of the 18 schools (five elementary and three middle and high schools) did not have lunchroom compost systems in place. These eight schools were excluded from comparative analysis of pre-sort and post-pre-sort compost, recycling, and trash rates. Paired t-tests were used to compare the differences in the means of the pre-sort and post-sort rates of these eight schools. Figure 2 shows that of schools that did currently compost (n=10),
the mean post-sort lunchroom composting rate was significantly greater than the mean pre-sort rate. Conversely, the mean post-sort trash rate was significantly less than the mean pre-sort trash rate. No statistically significant difference was detected between pre- and post-sort recycling rates (p=0.36).
Use of lunchroom compost system
Figure 3 displays the difference in trash rates sepa-rated by schools that did or did not compost in the lunchroom. The schools that did compost (n=10) decreased from a pre-sort mean of 20.9% of the overall waste as trash to a post-sort mean of 13.6% as trash. The schools that did not compost (n=8) decreased from a pre-sort mean of 50.9% to a post-sort mean of 20.4% of overall waste as trash. While post-sort rates were significantly lower fol-lowing the waste sort, regardless of the school’s use of compost bins, the difference from pre- to post-sort was greater in schools that did not compost.
Participation in sustainability programming
Welch two sample t-tests were performed to evaluate the difference between mean pre-sort and post-sort rates, which represented the rate of Of the lunchrooms that did provide compost bins (n=10), the mean current and potential compost, recycling, and trash rates are depicted. Statistical significance was detected between current and potential compost and trash rates.
*p<0.05
63.9%
15.2%
20.9% 72.3%*
14.2% 13.6%*
0% 10% 20% 30% 40% 50% 60% 70% 80% 90% 100%
COMPOST RECYCLING TRASH
PE
R
C
EN
T OF
OVE
R
AL
L W
A
ST
E
improperly sorted compost, recycling, and trash, for schools with different char-acteristics. Two elementary schools that were not partici-pating in the King County Green Schools Program were achieving composting rates similar to current Green Schools Program participants. The remaining five schools not participating in the pro-gram were not currently com-posting in lunchrooms. Three of the 11 schools at Level 1 or above in the Green Schools Program were not compost-ing in lunchrooms. The mean difference from pre-sort to post-sort compost rates was significantly greater in schools not participating in the Green Schools Program than those at any level of the program (Figure 4). The mean differ-ence between pre-sort and post-sort trash rates was also significantly greater in schools not participating in the Green Schools Program. Further analysis (not shown) showed that progression in levels within the Green Schools Program did not significantly improve the mean difference of composting and trash rates.
Similarly, the presence of lunchroom monitors resulted in statistically significant dif-ferences from mean pre-sort to post-sort rates for compost and trash compared to schools without lunchroom monitors (Figure 5). Schools with student-led Green Teams also had statistically significant differences from mean pre-sort to post-sort Figure 3. Difference in Pre- and Post-sort Trash Rates Based on Presence
of Compost Bins
Comparison of schools that do and do not have compost bins in the lunchrooms. All schools had significantly lower potential trash rates compared to current trash rates, whether they currently compost or not.
*p<0.05; **p<0.001
20.9%
50.9%
13.6%*
20.4%**
0% 5% 10% 15% 20% 25% 30% 35% 40% 45% 50% 55%
SCHOOLS THAT DO COMPOST SCHOOLS THAT DO NOT COMPOST
PERCENT O
F
TRASH IN
TO
TAL
WASTE
Current Trash Rate Potential Trash Rate
Figure 4. The Effect of King County Green Schools Program Participation on Compost and Trash Sorting
Comparison of schools participating (n=11) or not participating (n=7) in King County Green Schools Program according to the difference in pre-sort and post-sort compost and trash rates. * p<0.05
-60% -40% -20% 0% 20% 40% 60%
COMPOST TRASH
MEAN DIFFERENCE
BETWEEN PRE-SORT
AND
POST-SORT
RATES
No Green Schools Program
Green Schools Level 1, 2, or 3
*
compost and trash rates compared to schools without Green Teams (p<0.05, analysis not shown). How-ever, there was no significant difference in sorting rates between elementary schools and combined middle and high schools (p=0.20).
Food share and food rescue
results
All but four schools had a food share program in place that was easily observed. The difference between pre-sort to post-sort rates of compost, recycling, and trash were not statistically different in schools that had food shares versus those that did not. Recorded observations of
food share areas showed they differed greatly in their implementation. Six of the 14 schools located their food share areas in inconvenient or deterring locations such as immediately next to waste bins,
or in an inconspicuous area of the cafeteria such as in a corner or on unused counter space. These six schools also did not have clear signage indicating the food share area’s purpose.
Figure 5. Effect of Lunchroom Monitors on Compost and Trash Rates
-50 -40 -30 -20 -10 0 10 20 30 40 50
COMPOST TRASH
M
EAN
DIF
FE
RENCE BETWEEN P
R
E-SO
RT
AND
PO
ST-SO
R
T RATES
No Lunchroom Monitor Present Lunchroom Monitor Present
*
*
Comparison of schools that had a lunchroom monitor present (n=12) or not (n=6) during the waste audit according to the difference in pre-sort and post-sort compost and trash rates. * p<0.05
207
151 147
141
100
80
52
33 25 26 28
23
1
N
U
MBE
R
OF
FUL
L FOODS
FOUN
D
IN
W
A
ST
E
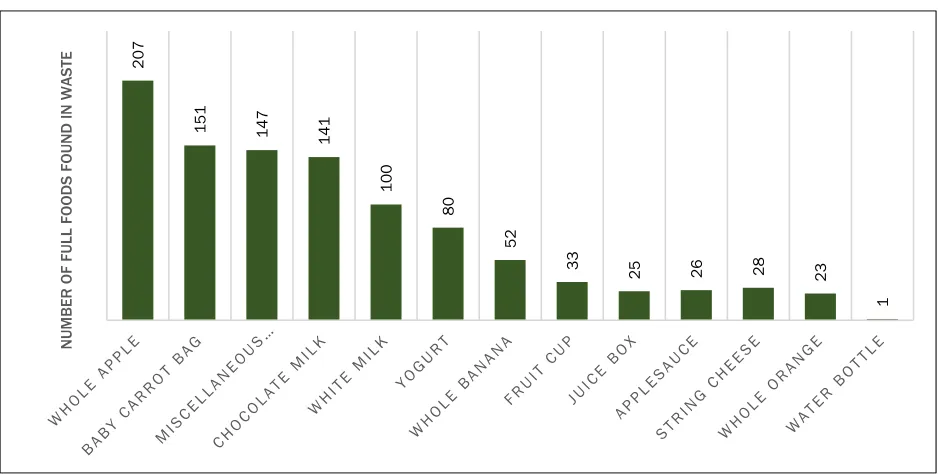
Figure 6. Rescuable Foods Found in Waste Bins at All Schools
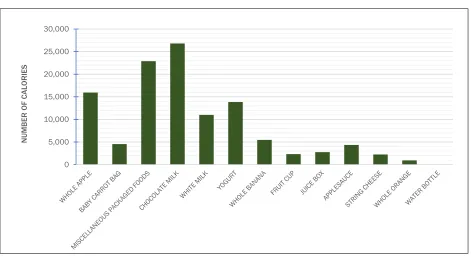
Despite the presence of food share areas, rescuable food items were found in waste bins during audits at every school. Over the 18 days of audits, teams found a total of 1,161 rescuable food items (Figure 6). The 147 “miscellaneous packaged foods” were primarily packaged snacks such as granola bars, fruit snacks, and raisins (Figure 7). Calorie amounts for each individual item recorded were retrieved from the USDA National Nutrient Database (USDA, 2016b). The 1,161 food items represented 135,867 calories (Figure 8). The rescu-able vegetrescu-ables, fruits, and dairy products alone accounted for over 165,000 milligrams of calcium, 13,000 mg of vitamin C, 80,000 mg of vitamin A, 288 mg of iron, 1,100 g of fiber, and 5,200 g of protein (Table 4). Table 4 illustrates the nutrient loss equivalent to the approximate number of students’ Recommended Daily Allowance (RDA) that could have been met by the loss. For example, 165,000 mg of calcium loss is equivalent to 166 students’ RDA of calcium. Overall, whole apples were the most frequently wasted rescuable item, followed by baby carrot packages, miscellaneous packaged foods, and chocolate milk. These four
food types alone accounted for more than half of all wasted rescuable foods and over 70,000 wasted calories. There was no correlation between an individual school’s percentage of students receiving free or reduced-price lunch and the number of rescuable food items (R2=0.002) or the total number of calories wasted (R2=0.004).
Discussion
Table 5 summarizes the results of the hypotheses posed at the beginning of this study, though additional significant results should be discussed. Trash-on-a-tarp waste audit data found that all schools, regardless of the presence of lunchroom compost bins, had significantly greater post-sort compost rates and significantly lower post-sort trash rates but no significant differences in pre- to post-sort recycling rates. Perhaps the program-ming, practices, and investments that helped achieve these near-perfect recycling rates, such as participation in sustainability programming like the King County Green Schools Program, could be applied to the development of better food waste programming and practices.
26
20
17
15
13
9 8
6 5 5
4
3
2 1 1 1 1 1 1
N
U
MBE
R
OF
FUL
L FOODS
FOUN
D
IN
W
A
ST
E
Figure 7. Counts of Miscellaneous Packaged Foods
Despite these findings, the presence of post bins did appear to matter. Schools with com-post bins had pre-sort trash rates that were lower on average (i.e., 21% of waste) and there was less evidence of missorting than in schools without compost bins (i.e., after the sorting, trash com-posed 14% of total waste, for a 7% decrease). Schools without compost bins had pre-sort trash
rates that were higher on average (i.e., 51% of waste) and there was more evidence of missorting (i.e., after the sorting, trash composed 21% of waste, for a 30% decrease). Two schools that were not participating in the King County Green Schools Program achieved compost rates similar to schools currently participating in the program, perhaps due to the independent implementation of Table 4. Nutrient Loss of Nutrients of Concern for Students from Rescuable Vegetables, Fruit, and Dairy Calculations performed using the Nutrient Loss and Recovery Calculator (Spiker, 2017). Dietary reference intakes are based on 14-18-year-old male and female recommendations on a 1800-2200 kcal diet. The final column illustrates how many 14-to-18-year-old individuals’ RDA are met with the rescuable vegetables, fruits, and dairy alone.
Nutrient Units Requirement
for average high school female student
Requirement for average high school
male student from vegetablesNutrient loss Nutrient loss from fruit Nutrient loss from dairy
Total nutrient loss from rescuable vegetables, fruits, and dairy
Number of students who
could have reached recommended intakes based on amount of nutrient loss
Calcium mg 1,300 1,300 3,549.1 6,820.1 155,290.6 165,659.8 166
Vitamin C mg 65 75 2,111.8 11,438.9 282.7 13,833.4 169
Vitamin A mg 700 900 15,668.1 9,004.3 55,987.9 80,660.3 102
Iron mg 15 11 77.9 131 79.5 288.4 26
Fiber g 25 30 247.3 825.1 66.4 1,138.8 37
Protein g 46 52 212.8 349.5 4,718.9 5,281.2 104
0 5,000 10,000 15,000 20,000 25,000 30,000
NUM
B
ER O
F
CALO
RIES
Figure 8. Estimated Total Calories Wasted from Rescuable Food Items
lunchroom compost bins in those schools. This evaluation also illustrates the types of food waste reduction, sustainability, and food rescue programs and practices in which schools were actively participating. Most schools in this study (12 of 18) utilized lunchroom monitors to ensure students were sorting their lunch waste properly and 14 of 18 had food share tables. Additionally, most elementary schools utilized student-led Green Teams and more elementary schools participated in the King County Green Schools Program compared to middle and high schools. These characteristics were expected to be indicative of better sorting rates. Observational and analytical results indicated that there was less missorting of trash and compost at schools with Green Teams or with lunchroom monitors, sug-gesting that any form of monitoring may be bene-ficial for correct sorting. Observational data sug-gested that elementary schools appeared to sort waste better than both middle and high schools, and high schools seemed to have the worst overall sorting practices. However, no statistically signifi-cant differences in compost, recycling, or trash rates were found between elementary, middle, and high schools. Participation in the King County Green Schools Program improved both the base-line compost and trash rates of participating schools, indicating that participation in sustaina-bility-focused programs may help schools achieve better waste sorting rates and decreased food waste.
Regarding lunchroom layout, most schools had some waste sorting system. While some systems appeared better than others, statistical analyses were not possible due to the variability in appearance and implementation. Practices that appeared to improve sorting and should be empirically explored include placing trash, recy-cling, and compost bins together throughout the lunchroom and at lunchroom exits; having liquid dump containers that allow for easier separation of liquids from trash and compost; and having effec-tive and appealing signage on waste bins. Variation in signage made it difficult to examine in any systematic way; however, signage appeared to be most effective when it was at eye level for easy readability, when it was water-resistant to prevent damage from trash splash, when it was placed on both walls and on the bins themselves, and when it was visually appealing by providing visualizations of which items belong in which bin.
Food Share and Food Rescue
There was high variability in how the 14 different food share areas were implemented. More than half of food share areas observed in this study were in easy-to-access and far-from-waste locations. The food share areas that were located immediately next to waste bins may have deterred students from placing or picking up food, though this observation should be further examined. Notably, the presence of food share areas did not affect students’ waste sorting practices.
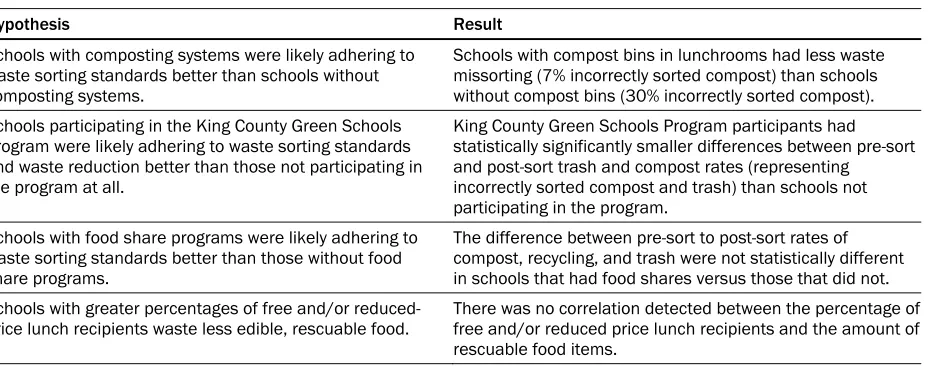
Table 5. Summary of Results According to Four Posed Hypotheses We Introduced During This Study
Hypothesis Result Schools with composting systems were likely adhering to
waste sorting standards better than schools without composting systems.
Schools with compost bins in lunchrooms had less waste missorting (7% incorrectly sorted compost) than schools without compost bins (30% incorrectly sorted compost). Schools participating in the King County Green Schools
Program were likely adhering to waste sorting standards and waste reduction better than those not participating in the program at all.
King County Green Schools Program participants had statistically significantly smaller differences between pre-sort and post-sort trash and compost rates (representing incorrectly sorted compost and trash) than schools not participating in the program.
Schools with food share programs were likely adhering to waste sorting standards better than those without food share programs.
The difference between pre-sort to post-sort rates of compost, recycling, and trash were not statistically different in schools that had food shares versus those that did not. Schools with greater percentages of free and/or
reduced-price lunch recipients waste less edible, rescuable food.
While the food share areas aimed to reduce the amount of full, uneaten foods in waste bins, 1,161 items consisting of 135,867 calories could have been diverted from waste to feeding hungry stu-dents. These were food items in schools without food share areas, items remaining in food share areas at the end of the lunch period, or items students chose to throw away rather than place in the food share area. Apples, carrots, packaged foods, and milk were wasted most frequently. If the food rescue numbers are representative of the daily rescuable food waste for these schools, over 1,000 apples, 750 bags of baby carrots, and 1,200 cartons of milk could be rescued weekly from the 18 audited schools. Further analysis of fruits, vege-tables, and dairy revealed that rescuable healthful foods have the potential to fulfill the RDA of over 100 students for several nutrients of concern: protein, vitamin A, vitamin C, and calcium. Addi-tionally, the tool used to capture these results may be beneficial to schools and school districts hoping to understand the potential of wasted food and communicate the potential for food share pro-grams at their schools. These results illustrate a portion of the nutrient loss from the schools’ wasted food, and further analysis could supplement these results and provide schools with further methods to reduce food waste.
Additionally, while the food share system may provide extra food for students during lunch peri-ods, audit teams observed that most food share foods were thrown into waste bins at the end of each lunch period. These items were often dis-carded due to lack of temperature control and monitoring, particularly for items such as milk. One school specifically addressed this by using frozen liquid packs within the food share bins to hold food and beverages at an appropriate temperature throughout all lunch periods. In the future, this may be an easy, affordable way to maintain safe temperatures without investing in additional kitchen equipment, such as a refrigerator or freezer. Temperature-controlled items could be diverted from waste at the end of lunch periods for donation to local food banks, rescue organizations, or for use in a “backpack program” for food insecure students to take home at the end of the school day.
Limitations
The use of an established food waste audit methodology supported by observational data provided reliable data on which to base this anal-ysis. However, this project had some limitations. First, this project may not be generalizable to the day-to-day waste practices of schools due to its small sample size (n=18 schools), short observa-tional time frame, and specificity to a single school district. Second, four separate audit teams com-pleted individual audits. While all teams were trained by the same person using a consistent method, potential discrepancies may have occurred due to unexpected items in waste bins or miscom-munication across and within groups. This was reduced as much as possible by encouraging com-munication with project representatives and by using photographs as visual confirmation of cor-rect sorting. Third, social desirability bias is a potential limitation, as schools were given prior notice that the audit teams were completing the waste audits on the given dates. Therefore, school staff may have been performing beyond their typi-cal daily standards. Fourth, waste audits may be incomplete because students may have thrown away food waste in bins outside the lunchroom areas and custodians only provided lunchroom bins to the audit teams. Finally, the accuracy of the food rescue nutrient data is limited by the calculator used to estimate nutrient losses. Not all rescuable food items were available in the calculator. Thus, results from the calculator were based on estimates of several commodities and were not fully repre-sentative of the rescuable foods found during this project. While this tool lacks full representation, it is publicly available and a powerful illustration of the loss and potential gains in rescuing food in these school lunchrooms. Furthermore, it provides schools the opportunity to routinely evaluate food waste.
Future Directions
should address this question so that schools can implement appropriate, sustainable programming to reduce lunchroom food waste, improve appro-priate food donations, and divert food waste from landfill to compost.
This project examined current efforts to reduce lunchroom food waste in 18 schools, but future research should confirm these data and explore potential findings beyond the scope of this project’s focus. Increased sample size and obser-vational time frame would allow better insight into food waste patterns by allowing for greater statis-tical power and a more complete view of a school district’s day-to-day sorting habits. Future studies should weigh the rescuable food items in addition to counting and photographing. Weighing these items would allow more accurate nutrient loss anal-ysis and allow for comparisons with other similar data (e.g., food banks, food recovery organiza-tions). Additionally, experimental trials comparing schools before and after implementation of a food share system would be useful in determining the effectiveness of food rescue programs in elimi-nating unnecessary food waste. While most of the schools in this study used food share tables, the one school with the highest free and/or reduced-price lunch participation did not have a food share program at the time of this study. While no correla-tion was found between free and/or reduced-price lunch participation and the rates of lunchroom waste, the impact of food share tables on child-hood hunger and food insecurity should be evalu-ated in the future. Longitudinal studies would be useful for understanding the problem and potential solutions. For example, studies could examine the transition of students from elementary to middle and finally to high school to understand if sustaina-bility practices taught in elementary schools follow students through graduation of high school. Final-ly, a project focused primarily on kitchen food waste would supplement the lunchroom waste findings from this study as well as provide valuable insight into kitchen food waste. This project did not have the capacity to measure the overall food waste from the school kitchens, which may include full, rescuable foods as well as prepared foods that were served on the lunch line or kept as back-up for lunch service. Additionally, interviews with
kitchen staff would be beneficial. Staff are respon-sible for ordering and purchasing lunch items; understanding their patterns and requirements for ordering can provide insight into potential cost-saving interventions. If schools can adjust their purchasing habits of frequently wasted food items, such as apples, baby carrot packages, and chocolate milk, or develop recipes that make them more enticing, they can reduce wasted food and wasted money. Combined quantitative and qualitative kitchen-focused studies can reveal kitchen-related sustainability and preparation practices that may further aid in reducing school-wide food waste.
Conclusion
The elementary, middle, and high schools partici-pating in this study can all benefit from improved food waste reduction programming. While schools in this sample were generally accurate in their recy-cling practices, trash and compost sorting need improvement. Much of the trash currently gen-erated in their school lunchrooms can be diverted to compost if all schools implement and adhere to a school-wide compost system. Promising practices appear to be the presence of compost bins, partici-pation in a district-wide sustainability initiative, and the presence of lunchroom monitors. Schools in this study were participating in a variety of food waste reduction programs, including food sharing, waste bin labeling, waste sorting education, and lunchroom monitoring. District-wide participation in programs might offer consistency in or potential streamlining of waste bin sign design, bin style, and sustained monitoring of waste sorting so that future studies could design and evaluate their effec-tiveness. Additionally, implementation and adher-ence to a food rescue program has the potential to save vast quantities of food. Rescued food could be used to feed either hungry students through a school food share program or food-insecure com-munity members through a school-to-food bank donation program rather than negatively impact the environment as waste in landfills.
Acknowledgments
University of Washington students who collected primary data for the study, including Athena Anderle, Anna Beebe, Suet Ellen Chau, Joseph Gunnar Colleen, Joan Kim, Jenny Luong, Ryan Poll, Katie Schroeder, and Daniela Vega. The authors also thank the City of Auburn and Auburn School District representatives for their contributions, including Dale
Alekel, Kathleen Edman, Erin Hislop, Joan Nelson, and Scott Weide, as well as all faculty and staff at the 18 schools evaluated in this project. Finally, the authors thank the Center for Statistics and the Social Sciences, University of Washington, for providing statistical consultation.
References
Adams, M. A., Bruening, M., Ohri-Vachaspati, P., & Hurley, J. C. (2016). Location of school lunch salad bars and fruit and vegetable consumption in middle schools: A cross-sectional plate waste study. Journal of the Academy of Nutrition and Dietetics, 116(3), 407–416. https://doi.org/10.1016/j.jand.2015.10.011
Amin, S. A., Yon, B. A., Taylor, J. C., & Johnson, R. K. (2015). Impact of the National School Lunch Program on fruit and vegetable selection in northeastern elementary schoolchildren, 2012–2013. Public Health Reports,130(5), 453–457. https://doi.org/10.1177/003335491513000508
Armstrong, R. A. (2014). When to use the Bonferroni correction. Ophthalmic and Physiological Optics, 34(5), 502–508.
https://doi.org/10.1111/opo.12131
Bergman, E. A., Englund, T., Taylor, K. W., Watkins, T., Schepman, S., & Rushing, K. (2014). School lunch before and after implementation of the Healthy Hunger-Free Kids Act. Journal of Child Nutrition and Management, 38(2), 1–12.
https://schoolnutrition.org/NewsPublications/JCNM/2014/Fall/ Bill Emerson Good Samaritan Food Donation Act of 1996, 42 U.S.C. § 1791.
Blondin, S. A., Cash, S. B., Goldberg, J. P., Griffin, T. S., & Economos, C. D. (2017). Nutritional, economic, and environmental costs of milk waste in a classroom school breakfast program. American Journal Public Health,107,
590–592. https://doi.org/10.2105/AJPH.2016.303647
Buzby, J.C., Wells, H.F., & Hyman, J. (2014). The estimated amount, value, and calories of postharvest food losses at the retail and consumer levels in the United States. (Publication No. EIB-121). Washington, D.C.: U.S. Department of Agriculture Economic Research Service. https://www.ers.usda.gov/publications/pub-details/?pubid=43836
Byker, C. J., Farris, A. R., Marcenelle, M., Davis, G. C., & Serrano, E. L. (2014). Food waste in a school nutrition program after implementation of new lunch program guidelines. Journal of Nutrition Education and Behavior, 46(5), 406–411. https://doi.org/10.1016/j.jneb.2014.03.009
Byker Shanks, C., Banna, J., & Serrano, E. L. (2017). Food waste in the National School Lunch Program 1978-2015: A systematic review. Journal of the Academy of Nutrition and Dietetics, 117(11), 1792–1807.
https://doi.org/10.1016/j.jand.2017.06.008 CalRecycle. (2016). School waste composition. Retrieved from
http://www.calrecycle.ca.gov/reducewaste/schools/Composition.htm
Cohen, J. F., Jahn, J. L., Richardson, S., Cluggish, S. A., Parker, E., & Rimm, E. B. (2016). Amount of time to eat lunch is associated with children's selection and consumption of school meal entrée, fruits, vegetables, and milk. Journal of the Academy of Nutrition and Dietetics,116(1), 123–128. https://doi.org/10.1016/j.jand.2015.07.019
Cohen, J. F., Richardson, S., Austin, S. B., Economos, C. D., & Rimm, E. B. (2013). School lunch waste among middle school students: Nutrients consumed and costs. American Journal of Preventative Medicine, 44(2), 114–121.
https://doi.org/10.1016/j.amepre.2012.09.060
Environmental Protection Agency. (n.d.-a) Food recovery hierarchy. Retrieved from https://www.epa.gov/sustainable-management-food/food-recovery-hierarchy
Environmental Protection Agency. (n.d.-b). Food Recovery Challenge (FRC). Retrieved from
https://www.epa.gov/sustainable-management-food/food-recovery-challenge-frc
Environmental Protection Agency. (2017). Sustainable Materials Management (SMM) web academy webinar: Reducing and recovering wasted food in schools—Lessons from the cafeteria line [Webinar]. Retrieved from
Food Rescue. (2017). History of school food rescue & share table guidelines in the U.S. Retrieved from
http://www.foodrescue.net/school-food-waste-policy-history.html
Food Research and Action Center. (2015). National school lunch program: Trends and factors affecting student participation. Retrieved from http://frac.org/wp-content/uploads/national_school_lunch_report_2015.pdf
Greene, K. N., Gabrielyan, G., Just, D. R., & Wansink, B. (2017). Fruit-promoting smarter lunchrooms interventions: Results from a cluster RCT. American Journal of Preventative Medicine, 52(4), 451–458.
https://doi.org/10.1016/j.amepre.2016.12.015
Gunders, D. (2017). Wasted: How America is losing up to 40 percent of its food from farm to fork to landfill (2nd Ed.). Retrieved from the NRDC Website: https://www.nrdc.org/sites/default/files/wasted-2017-report.pdf
Hickey, M. E. & Ozbay, G. (2014). Food waste in the United States: A contributing factor toward environmental instability. Frontiers in Environmental Science,2, Article 51. https://doi.org/10.3389/fenvs.2014.00051
Johnson, D. B., Podrabsky, M., Rocha, A., & Otten, J. J. (2016). Effect of the Healthy Hunger-Free Kids Act on the Nutritional Quality of Meals Selected by Students and School Lunch Participation Rates. Journal of the American Medical Association Pediatrics, 170(1), e153918. https://doi.org/10.1001/jamapediatrics.2015.3918
King County. (n.d.). Green Schools Program. Retrieved from
http://your.kingcounty.gov/solidwaste/greenschools/index.asp
Marlette, M. A., Templeton, S. B., & Panemangalore, M. (2005). Food type, food peparation, and competitive food purchases impact school lunch plate waste by sixth-grade students. Journal of the American Dietetic Association,105(11), 1779–1782. https://doi.org/10.1016/j.jada.2005.08.033
Melia, M. (2017, March 1). Steamed in the School Caf Over Restrictions on Lunch Sharing. U.S. News. Retrieved from
https://www.usnews.com/news/best-states/connecticut/articles/2017-03-01/hangry-in-the-school-caf-sharing-some-food-is-off-the-table
Niaki, S. F., Moore, C. E., Chen, T. A., & Weber, C. K. (2017). Younger elementary school students waste more school lunch foods than older elementary school students. Journal of the Academy of Nutrition and Dietetics, 117(1), 95–101.
https://doi.org/10.1016/j.jand.2016.08.005
Office of Superintendent of Public Instruction. (n.d.). Washington State Report Card: Auburn School District. Retrieved from
http://reportcard.ospi.k12.wa.us/summary.aspx?groupLevel=District&schoolId=111&reportLevel=District&orgLi nkId=111&yrs=2015-16&year=2015-16
ReFED. (2016). A roadmap to reduce U.S. food waste by 20 percent. Retrieved from
https://www.refed.com/downloads/ReFED_Report_2016.pdf Seattle & King County Public Health. (2013). Food insecurity. Retrieved from
http://www.kingcounty.gov/depts/health/data/~/media/depts/health/data/documents/preventable/food-insecurity.ashx
Smith, L., Conroy, K., Wen, H., Rui, L., & Humphries, D. (2013). Portion size variably affects food intake of 6-year-old and 4-year-old children in Kinming, China. Appetite,69, 31–38. https://doi.org/10.1016/j.appet.2013.05.010 Spiker, M. L., Hiza, H. A. B., Siddiqi, S. M., & Neff, R. A. (2017). Wasted food, wasted nutrients: Nutrient loss from
wasted food in the United States and comparison to gaps in dietary intake. Journal of the Academy of Nutrition and Dietetics, 117(7), 1031–1040. https://doi.org/10.1016/j.jand.2017.03.015
State of Connecticut Department of Education. (2017). The use of share tables in Connecticut Child Nutrition Programs (CNPs)
(Operational Memorandum No. 6-16). Hartford, Connecticut: Author. Retrieved from
http://portal.ct.gov/SDE/Lists/Operational-Memoranda-for-School-Nutrition-Programs/School-Nutrition-Memos-2016/2016-CSDE-School-Nutrition-Memos
Terry, M. (2017, March 27). School lunch share tables fight food waste and hunger [Blog post]. Civil Eats. Retrieved from
http://civileats.com/2017/03/27/school-lunch-share-tables-fight-food-waste-and-hunger/
U.S. Department of Agriculture. (2016a). The use of share tables in Child Nutrition Programs. (SP 41-2016, CACFP 13-2016, SFSP 15-2016). Washington, D.C.: U.S. Government Printing Office. Retrieved from
https://www.fns.usda.gov/sites/default/files/cn/SP41_CACFP13_SFSP15_2016os.pdf
U.S. Department of Agriculture. (2016b). USDA food composition databases. Agricultural Research Service. Retrieved from
U.S. Department of Agriculture Economic Research Service. (2017, October 4). Food security status of U.S. households in 2015. Retrieved from https://www.ers.usda.gov/topics/food-nutrition-assistance/food-security-in-the-us/key-statistics-graphics.aspx
U.S. Department of Agriculture Food and Nutrition Service. (2012a). Guidance on the Food Donation Program in Child Nutrition Programs. (SP 11-2012, CACFP 05-2012, SFSP 07-2012). Washington, D.C.: U.S. Government Printing Office. Retrieved from https://www.usda.gov/oce/foodwaste/FNS_Guidance.pdf
U.S. Department of Agriculture Food and Nutrition Service. (2012b). Nutrition standards in the national school lunch and school breakfast programs. (7 CFR Parts 210 and 220). Washington, D.C.: U.S. Government Printing Office. Retrieved from
https://www.gpo.gov/fdsys/pkg/FR-2012-01-26/pdf/2012-1010.pdf
U.S. Department of Education, National Center for Education Statistics. (2012). Common Core of Data (CCD), “Public Elementary/Secondary School Universe Survey,” 2000-01, 2005-06, 2009-10, and 2010-11 [Data table]. Retrieved from
https://nces.ed.gov/programs/digest/d12/tables/dt12_046.asp
U.S. Department of Education, National Center for Education Statistics. (2016a). Digest of Education Statistics, 2015
(NCES 2016-014), Table 105.50. Retrieved from https://nces.ed.gov/fastfacts/display.asp?id=84
U.S. Department of Education, National Center for Education Statistics. (2016b). Digest of Education Statistics, 2015