Modeling And Analysis Of The Surface
Roughness And Geometrical Error
Using Taguchi And Response Surface
Methodology
DR.S.C.JAYSWAL* and MOHAMMAD TAUFIK
Department of Mechanical Engineering, M.M.M. Engineering College , Gorakhpur, 273010, India
Abstract :
This experimental work presents a technique to determine the better surface quality by controlling the surface roughness and geometrical error. In machining operations, achieving desired surface quality features of the machined product is really a challenging job. Because, these quality features are highly correlated and are expected to be influenced directly or indirectly by the direct effect of process parameters or their interactive effects. Thus The four input process parameters such as spindle speed, depth of cut, feed rate, and stepover have been selected to minimize the surface roughness and geometrical error simultaneously by using the robust design concept of Taguchi L9(34) method coupled with Response surface concept. Mathematical models for
surface roughness and geometrical error were obtained from response surface analysis to predict values of surface roughness and geometrical error. S/N ratio and ANOVA analyses were also performed to obtain for significant parameters influencing surface roughness and geometrical error.
Keywords: Surface Roughness; Geometrical Error; Milling; CMM.
1. Introduction
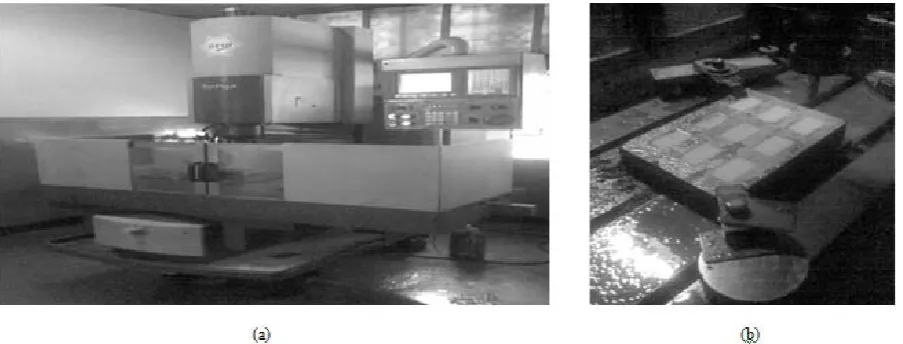
Fig. 2. photographic view of (a)CNC milling centre and(b) experimental set-up
A simple four flute 10 mm end mill tool was used in this work; the tool is made of HSS. The material used in this experimental is the commercial mild steel in the form of flat bar with 180mm x 135mm x 25mm dimension. Nine pocket of dimension 25mm x 40mm x 6mm were machine accordingly Taguchi’s L9 orthogonal array.
Cutting fluid flow kept constant throughout the experimentation. The chemical composition of flat bar material is given in Table 1.
Table. 1. Chemical composition of mild steel
Material C Mn Cu Si
Mild Steel 0.16-0.29% 1.65% 0.6% 0.6%
In this experimental study, spindle speed ( x1 ), depth of cut ( x2 ), feed ( x3 ), and stepover ( x4 ) were
considered as machining parameters. based on the pilot experimentation, parameters range has been decided [3]. The considered process parameters and their levels are listed in Table 2.
Table. 2. Machining parameters and their levels level Spindle speed
(rpm)
Depth of cut (mm) Feed(mm/min) Stepover (mm)
1 600 0.1 100 7
2 700 0.2 200 8
3 800 0.3 300 9
2.1. Surface Roughness measurement
It was measured on Subtronic-10 surface tester giving Ra value in microns. Ra is measured along four different
lines on the surface and the average value is considered for further analysis. 2.2. Error Measurement Setup
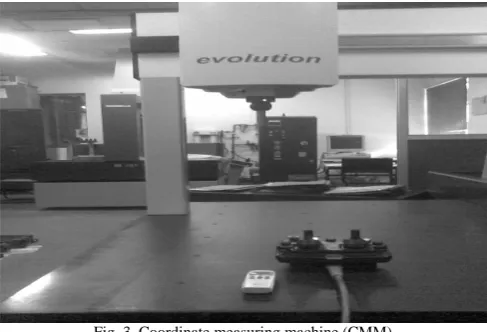
Fig. 3. Coordinate measuring machine (CMM)
reference coordinate which is used throughout the machining operations is recreated by forming reference planes on the flat surfaces of the product. By intersecting these two planes, reference coordinate of the machined part is defined and fixed. After converting the CMM coordinate system to the part coordinate system, measuring probe becomes aware of the reference coordinate and angular position of the each axis. Comparison of the real geometrical value with the value predicted by CMM indicates deviation in the quality of CNC pocket mill product. In this experimental study the geometrical deviation between these two values are calculated by percentage error formula and use as a geometrical error. The experimental results for surface roughness and geometrical error were given in Table 3.
Table. 3. Experimental results Experi-ment Spindle speed (rpm) Depth of cut (rpm) Feed (mm/min) Step-over (mm) Surface Roughness (µm)
Geometrical Error (%) Ex Ey Ez
1 600 0.1 100 7 4.5 0.185 0.524 0.408
2 600 0.2 200 8 5.5 0.105 0.328 0.591
3 600 0.3 300 9 6.7 0.097 0.363 1.708
4 700 0.1 200 9 4.8 0.221 0.151 0.291
5 700 0.2 300 7 4.6 0.102 0.146 0.941
6 700 0.3 100 8 5.0 0.076 0.126 1.725
7 800 0.1 300 8 4.2 0.211 0.087 0.466
8 800 0.2 100 9 4.5 0.084 0.080 1.141
9 800 0.3 200 7 5.1 0.072 0.063 1.750
3. Results obtained by response surface methodology ( RSM )
The response surface methodology ( RSM ) is employed to quantify the relationship between individual responses and input cutting parameters. Response Surface Methodology ( RSM ) can be defined as a collection of statistical and mathematical techniques useful for developing, improving and optimizing processes [4]. The most extensive applications of RSM are in the particular situations where several input variables potentially influence some performance measure or quality characteristic ( i.e. response ) of the process. The input variables are sometimes called independent variables, and are to be controlled by the engineer. In order to investigate the influence of cutting parameters on surface roughness and geometrical error, four independent modeling parameters viz. Spindle speed , depth of cut, feed and stepover are selected as input parameters, while the output responses are the surface roughness and geometrical error. The range of input parameters is decided on the basis of literature available. The necessary data required for developing the response models have been collected by designing the experiments based on Taguchi L9 orthogonal array design by varying each numeric factor up to 3
levels. Response surface model have linear model, quadratic model, interaction model and full quadratic model and are as follows ( for four input parameters ):
Linear equation:
Y=b0+b1X1+b2X2+b3X3+b4X4
Quadratic equation:
model are evaluated by using F-test and it indicates that R results obtained from Linear with Interaction model is desired because R2 values obtained from Linear with Interaction model is higher than any other model ( 99.99 % for surface roughness and 97.45 %, 99.01 %, 98.30 % for geometrical error in X,Y and Z-direction respectively ) and the model is as follows.
Surface Roughness = 11.7222-0.0193333X1-19.0000X2-0.0370000X3+0.700000X4+0.0300000X1X2
+5.00000E-05X1X3+0.0300000X2X3
X-Dir. geometrical Error = 1.16659-0.00210190X1-2.48143X2 -0.00555667X3+0.0606667X4+
+0.00281429X1X2+7.88571E-06X1X3+0.00142857X2X3
Y-Dir.Geometrical Error = 1.62451-6.43810E-04X1+4.41214X2-0.0102683X3-0.0291667X4
-0.0104714X1X2+9.27143E-06X1X3+0.0151571X2X3
Z-Dir.Geometrical Error = -1.32186+0.00334476X1+19.9152X2-0.0223500X3-0.0136667X4
-0.0255857X1X2+2.14857E-05X1X3+0.0288286X2X3
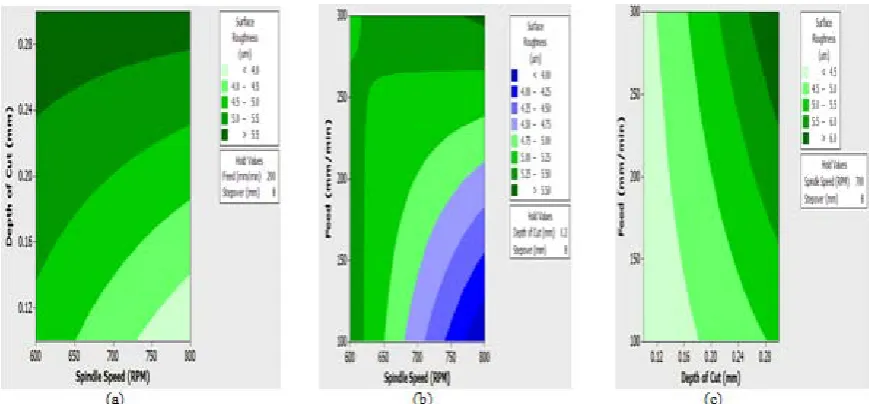
3.2. Contour plots
The contour plot of spindle speed-depth of cut, spindle speed-feed and feed-depth of cut for surface roughness are shown in Figure 4.The minimum surface roughness can produced when spindle speed, feed at level 3 are combined with lower level of depth of cut. The contour plot of spindle speed-depth of cut, spindle speed-feed and feed-depth of cut on X-Dir.geometrical error is shown in Figure 5. The workpiece with lower X-Dir. geometrical error can be produced when the higher spindle speed, depth of cut combined with lower feed.
Fig. 5. Contour plot of (a)spindle speed and depth of cut(b)spindle speed and feed(c)Depth of cut and feed on Geometrical Error in x-Dir.
Fig. 6. Contour plot of (a)spindle speed and depth of cut(b)spindle speed and feed(c)Depth of cut and feed on Geometrical Error in y-Dir.
the orthogonal arrays from experimental design theory to study a large number of variables with a small number of experiments. This technique helps to study effect of many factors (variables) on the desired quality characteristic most economically. By studying the effect of individual factors on the results, the best factor combination can be determined. The standardized Taguchi-based experimental design used in this study is an L9
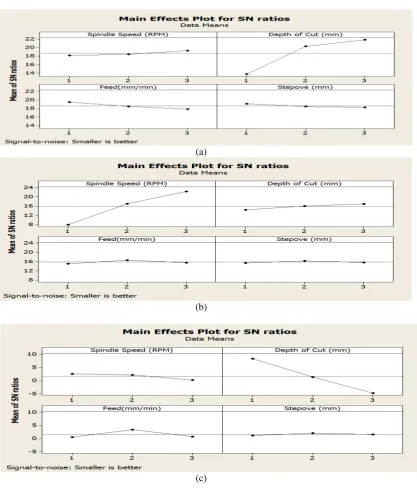
(34) orthogonal array 4.1. Analysis of S/N ratio
In the Taguchi method, the term ‘signal’ represents the desirable value (mean) for the output characteristic and the term ‘noise’ represents the undesirable value (S.D) for the output characteristic. Therefore, the S/N ratio is the ratio of the mean to the S.D. S/N ratio is used to measure the quality characteristic deviating from the desired value. The S/N ratio η is defined as
where M.S.D is the mean square deviation for the output characteristic. To obtain optimal cutting performance, the–lower–the–better quality characteristic for Surface Roughness and Geometrical Error must be taken[6]. The M.S.D. for the–lower– the– better quality characteristic can be expressed as:
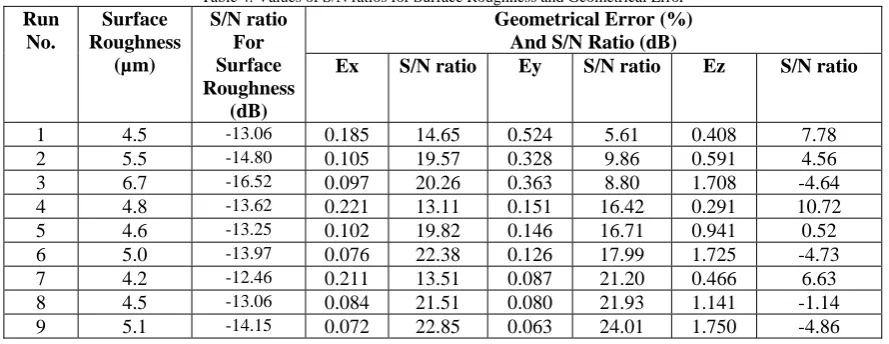
where,yi is the value of the observed data for the i-th test and M=1. Table 4 shows the experimental results for
surface roughness and geometrical error and the corresponding S/N ratio.
Table 4. Values of S/N ratios for Surface Roughness and Geometrical Error Run
No.
Surface Roughness
(µm)
S/N ratio For Surface Roughness
(dB)
Geometrical Error (%) And S/N Ratio (dB)
Ex S/N ratio Ey S/N ratio Ez S/N ratio
1 4.5 -13.06 0.185 14.65 0.524 5.61 0.408 7.78
2 5.5 -14.80 0.105 19.57 0.328 9.86 0.591 4.56
3 6.7 -16.52 0.097 20.26 0.363 8.80 1.708 -4.64
4 4.8 -13.62 0.221 13.11 0.151 16.42 0.291 10.72
5 4.6 -13.25 0.102 19.82 0.146 16.71 0.941 0.52
6 5.0 -13.97 0.076 22.38 0.126 17.99 1.725 -4.73
7 4.2 -12.46 0.211 13.51 0.087 21.20 0.466 6.63
8 4.5 -13.06 0.084 21.51 0.080 21.93 1.141 -1.14
9 5.1 -14.15 0.072 22.85 0.063 24.01 1.750 -4.86
Fig. 8. S/N ratio values for surface roughness
(a)
(b)
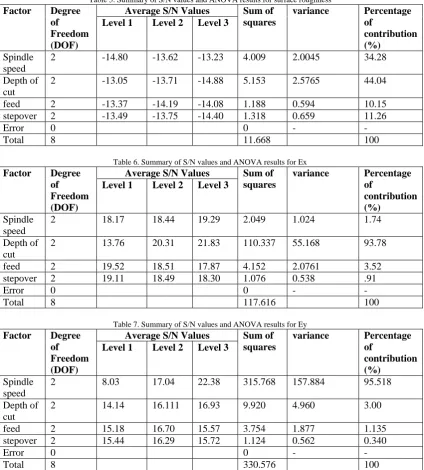
and the errors. in this experimental study ANOVA was used to determine the significant parameters influencing the Surface Roughness and Geometrical Error in the pocket milling of mild steel. Tables 5-8 showed the summary of S/N values and ANOVA results for Surface Roughness and Geometrical Error in Ex, Ey and Ez directions. In this study, analysis was a level of significance as 5% and level of confidence as 95%.
Table 5. Summary of S/N values and ANOVA results for surface roughness Factor Degree
of Freedom (DOF)
Average S/N Values Sum of squares
variance Percentage of
contribution (%)
Level 1 Level 2 Level 3
Spindle speed
2 -14.80 -13.62 -13.23 4.009 2.0045 34.28
Depth of cut
2 -13.05 -13.71 -14.88 5.153 2.5765 44.04
feed 2 -13.37 -14.19 -14.08 1.188 0.594 10.15
stepover 2 -13.49 -13.75 -14.40 1.318 0.659 11.26
Error 0 0 - -
Total 8 11.668 100
Table 6. Summary of S/N values and ANOVA results for Ex Factor Degree
of Freedom (DOF)
Average S/N Values Sum of squares
variance Percentage of
contribution (%)
Level 1 Level 2 Level 3
Spindle speed
2 18.17 18.44 19.29 2.049 1.024 1.74
Depth of cut
2 13.76 20.31 21.83 110.337 55.168 93.78
feed 2 19.52 18.51 17.87 4.152 2.0761 3.52
stepover 2 19.11 18.49 18.30 1.076 0.538 .91
Error 0 0 - -
Total 8 117.616 100
Table 7. Summary of S/N values and ANOVA results for Ey Factor Degree
of Freedom (DOF)
Average S/N Values Sum of squares
variance Percentage of
contribution (%)
Level 1 Level 2 Level 3
Spindle speed
2 8.03 17.04 22.38 315.768 157.884 95.518
Depth of cut
2 14.14 16.111 16.93 9.920 4.960 3.00
feed 2 15.18 16.70 15.57 3.754 1.877 1.135
stepover 2 15.44 16.29 15.72 1.124 0.562 0.340
Error 0 0 - -
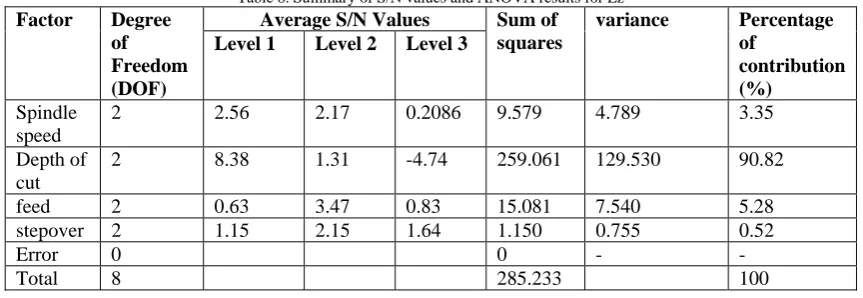
Table 8. Summary of S/N values and ANOVA results for Ez Factor Degree
of Freedom (DOF)
Average S/N Values Sum of squares
variance Percentage of
contribution (%)
Level 1 Level 2 Level 3
Spindle speed
2 2.56 2.17 0.2086 9.579 4.789 3.35
Depth of cut
2 8.38 1.31 -4.74 259.061 129.530 90.82
feed 2 0.63 3.47 0.83 15.081 7.540 5.28
stepover 2 1.15 2.15 1.64 1.150 0.755 0.52
Error 0 0 - -
Total 8 285.233 100
5. Conclusions
In the present investigation, modeling and analysis of cutting parameters influence on surface roughness and Geometrical Error in CNC pocket milling of Mild Steel have been successfully studied by Taguchi and Response Surface method. By the experimental and the analytical results, the following conclusions were drawn.
1) The level of importance of machining parameters on the responses is determined by using ANOVA. It is concluded that the depth of cut had a greater influence on the surface roughness and Geometrical Error components.
2) The optimum conditions for smaller surface roughness are spindle speed at 800 rpm, depth of cut at 0.1mm,feed at 100 and stepover at 7mm.
3) The optimal machining condition for Ex was 800 rpm spindle speed ( level 3 ), 0.3mm depth of cut (level 3), 100 mm/min feed ( level 1 ) and ( 70 % ) stepover ( level 1 )
4) The optimal machining condition for Ey was 800 rpm spindle speed ( level 3 ), 0.3 mm depth of cut (level 3), 200 mm/min feed ( level 2 ) and ( 80 % ) stepover ( level 2 )
5) The optimal machining condition for Ez was 600 rpm spindle speed ( level 1 ), 0.1 mm depth of cut (level 1), 200 mm/min feed ( leve2 ) and ( 80 % ) stepover ( level 1 )
6) Response Surface equation was modelled to predict the deformation at various intermediate conditions within the level range.it shows that most significant interaction effect was found between depth of cut - feed rate , depth of cut -stepover and feed-stepover .
7) It has been proved that the improvement of response function is significant, when the process parameters set at their optimal values.
In the case of Coordinate Measuring Machines ( CMM ), there is controversy related to the most suitable method to determine the measurement uncertainty which has not been considered in the present work and it is suggested to be an area for further study. ANOVA and RSM methods can provide optimal parameters, however, these parameters have to be validated by conducting experiments. This has not been considered here but suggested for further research.
Acknowledgment
This work is supported by the Indo-Danish Tool Room of Jamshedpur,India.The author would like to extend his gratitude for the support and technical assistance rendered by Mr.Jyoti Razak and Mr.R.D. Gupta in machining.
References
[1] Dr. Mike S. Lou et. al.," Surface Roughness Prediction Technique For CNC End-Milling"Journal of Industrial Technology Vol. 15, Number 1 - November 1998 to January 1999.
[2] K. Sanjeev et. al.,” Process control in CNC manufacturing for discrete components: A STEP-NC compliant framework”, Robotics and Computer-Integrated Manufacturing 23 (2007) 667–676.
[3] T. Ey ¨up Sabri," The role of stepover ratio in prediction of surface roughness in flat end milling " International Journal of Mechanical Sciences 51 (2009) 782–789.
[4] Kavanloui1 M., Hashemi B., Nourafkan E.," Optimization of Li-Zn ferrite synthesis parameters using the experimental design method" Journal of Chemical Engineering and Materials Science Vol. 2(4), pp. 53-60, April 2011.
[5] Montgogomery,D.C (2001).Design and Analysis of Experiments:John Willey & Sons,Inc.Delhi.
[6] Selvaraj D.P.,Chandramohan P.," optimization of surface roughness of aisi 304 austenitic stainless steel in dry turning operation using taguchi design method" Journal of Engineering Science and Technology Vol. 5, No. 3 (2010) 293 - 301.
![Fig. 1. Process control elements in CNC manufacturing [2]](https://thumb-us.123doks.com/thumbv2/123dok_us/9660251.1493891/1.595.171.437.616.741/fig-process-control-elements-cnc-manufacturing.webp)