http://www.sciencepublishinggroup.com/j/ajpc doi: 10.11648/j.ajpc.20190804.11
ISSN: 2327-2430 (Print); ISSN: 2327-2449 (Online)
Adsorption of Cu
2+
and Cr
6+
in Aqueous Solution by a
Thermally Modified Biosorbent Based on Cotton Cakes
Abia Daouda
1, *, Yowe Kidwe
1, Domga Richard
2, Domga
2, Harouna Massai
11
Department of Chemistry, Faculty of Science, University of Ngaoundere, Cameroon 2Department of Applied Chemistry, ENSAI, University of Ngaoundere, Cameroon
Email address:
*
Corresponding author
To cite this article:
Abia Daouda, Yowe Kidwe, Domga Richard, Domga, Harouna Massai. Adsorption of Cu2+ and Cr6+ in Aqueous Solution by a Thermally Modified Biosorbent Based on Cotton Cakes. American Journal of Physical Chemistry. Vol. 8, No. 4, 2019, pp. 66-74.
doi: 10.11648/j.ajpc.20190804.11
Received: September 27, 2019; Accepted: October 28, 2019; Published: November 5, 2019
Abstract:
This work focuses on the retention capacity of Cu2+ and Cr6+ ions in water by adsorption on a thermally modified biosorbent based on cotton cakes. The solutions treated are synthetic copper nitrate solutions rich in Cu2+ ions and potassium dichromate rich in Cr6+ ions in distilled water. The adsorption tests were carried out by mixing, with stirring (250 rpm), 0.02 g of the adsorbent for the solution containing the Cu2+ ions and 0.04 g for that containing the Cr6+ ions with a volume of 50 mL of these solutions. Kinetic studies have shown that the maximum adsorption is obtained after 20 minutes. In addition, the pH of the medium influences the adsorption process and the yield is improved with increasing pH. Amounts of copper and chromium adsorbed increase with increasing initial concentrations of these ions up to 40 mg/L. Similarly, adsorbed amounts increase with increasing mass of the adsorbent. On the other hand, these adsorbed quantities decrease with increasing temperature. The best adopted kinetic models are pseudo-second-order, Intraparticular and Evlovich. The adsorption isotherms conform to the Langmuir and Dubinin-Redushkovic models. The values of thermodynamic parameters such as free enthalpy (∆H° KJ/K.mol), entropy (∆S° KJ/K.mol) and isosteric adsorption heat (∆G° KJ/K. mol) at temperatures of 293; 303; 313 and 323K, all negative, show that we have to do with an exothermic adsorption, physical, ordered and spontaneous. The electrostatic attraction between the Cu2+ and Cr6+ ions and the adsorbent for the pH values above the pH of the point of zero charges shows that we have to do with a chemical adsorption.Keywords:
Adsorption Isotherms, Cotton Cakes, Copper (II), Chromium (VI), Thermodynamic Parameters1. Introduction
Water is the central element of all socio-economic processes regardless of the degree of development of society. The increase in agro-industrial activities is putting increasing pressure on the world's freshwater reserves. Indeed, these activities generate a great diversity of chemicals (heavy metals) that flow into the water cycle [1]. Thus, these chemical substances discharged into water are hardly biodegradable and the lack or insufficiency of treatment systems leads to their accumulations in the water cycle [2]. Heavy metals occur naturally in rocks, water, air and soil; they are also produced by human activities, particularly industrial and mining activities [3]. Some metals, such as
the flora [7]. It is therefore essential to completely eliminate the heavy metal ions present in the various industrial effluents or reduce their quantity below the allowable thresholds defined by the discharge standards. Several methods have been used, physical and chemical processes have been widely studied to remove heavy metals. Some of these processes are: coagulation [4], flotation [2], chemical precipitation [8], ultrafiltration [9], and electrochemical methods [1]. During the last decades much research has focused on adsorption techniques [10, 4]. This technology has already shown its potential in the treatment inorganic pollutants (heavy metals), toxic organic compounds, natural organic materials and volatile organic compounds. The use of activated carbon has remained for a long time and to this day the most effective adsorbent due to its high adsorption capacity due mainly to its large surface area, but the cost of treatment to obtain it is high, which makes the latter non-competitive from an economic point of view. This has therefore encouraged research by orienting them towards treatment processes using natural materials [11] which are less expensive and widely available such as natural zeolites, volcanic ash, clays and especially the biosorbent such as cotton cakes [12].
2. Material and Methods
2.1. Adsorbent Materials Used
The adsorbent materials used in this work are produced from cotton cakes produced by SODECOTON from Maroua (far north of Cameroon). The choice to use cotton cakes as raw material for the production of the adsorbent is motivated by the valorization of this agricultural waste. It is also obtained at a very favorable cost.
2.2. Adsorbent Production
The manufacture of the adsorbent comprises several steps according to the method of Ibrahim et al. (2012) [12]. The raw material once washed, dried and crushed is sieved. The retained particles (≤ 200 µm) are impregnated in a phosphoric acid solution with concentrations ranging from 85% (1N) and a mass ratio of 2 g of acid per g of cake. The impregnated particles are oven-dried for 12 hours and are carbonized in a preheated oven at a suitable temperature for a minimum of 2 hours before the start of the experiment to obtain a steady state temperature. The carbonization is carried out at a temperature of 550°C and at a time of 2 hours in order to improve its adsorbent capacity. The adsorbent obtained is cooled in a desiccator. In order to remove any carbonization residues, the adsorbent is washed several times with distilled water to a constant pH. The adsorbent thus washed is dried at 105°C for at least 8 hours in an oven, then cooled in a desiccator and kept airtight in sealed vials until the characterization tests.
2.3. Stock Solution of Cu2+ Ions
The stock solution of Cu2+ ions with a mass concentration
of 1g/L is obtained by dissolving 0.975 g of copper nitrate (Cu (NO3) 2) with a molar mass M = 241.6 g/mol at 98% by mass of purity in a liter of 'distilled water.
2.4. Stock Solution of Cr6+ Ions
The stock solution of Cr6+ ions is prepared using 2.829g of potassium dichromate (K2Cr2O7) were dissolved in one liter of distilled water. The standard daughter solutions of chromium in mg/L are obtained by dilution of the stock solution.
2.5. Acid Solution of Diphenylcarbazide
The acid solution of diphenylcarbazide is obtained using the method of Ikhlass et al. (2012) [13]. In fact, 0.025g of diphenylcarbazide is dissolved in 30 mL of ethyl alcohol. The resulting solution is transferred to 170 mL of 10% sulfuric acid.
2.6. Characterization of the Adsorbent
The characterization of the adsorbent requires the use of several spectroscopic and volumetric methods. The parameters targeted by this study are: residual moisture, ash content, Iodine index and specific surface.
2.6.1. Residual Moisture
The moisture content or residual moisture is the mass loss after complete desiccation (AFNOR, 1982). It consists of drying a known mass of the sample at 105°C in an isothermal oven to a constant mass (about 24 hours). After cooling in a desiccator, the samples are weighed again. The water content represents the difference in mass before and after the oven.
The water content (TE) as a percentage of wet matter is determined by:
% = × 100 (1)
With : mass of the empty capsule, : mass of the capsule containing the wet sample and : mass of the capsule containing the sample after steaming at 105°C.
2.6.2. Content of Raw Ash
The ash contents are calcination residues at 550°C of the organic materials. They are obtained according to the method of AFNOR (1982). The principle consists in incinerating a test portion after steaming at 105°C, in a muffle furnace at 550°C and weighing the residue obtained. For this, in a muffle furnace, the porcelain capsule containing the sample from the steaming at 105°C was placed at 550°C and was incinerated to white ash free carbon.
The ash content is calculated by the following formula:
% = (2)
2.6.3. Iodine Index
The iodine number of the adsorbent was determined according to the protocol applied by Ibrahim et al. (2012) [12] or a known mass (g) of the dry adsorbent was mixed with a determined volume of the iodine solution in a vial. After stirring, the mixture was filtered. The filtrate was titrated with sodium thiosulfate in the presence of a few drops of starch.
The calculation of the iodine index, expressed in mg/g, is done using the following equation:
!" ! . $%" .&
' (3)
With (: the volume of thiosulfate titrated to a blank (mL),
(: the volume of thiosulphate used to determine the iodine solution after adsorption (mL), MI2: the molar mass of iodine (253.81 g/mol) and ): the mass of the adsorbent (g).
2.6.4. Specific Surface
The estimation of the specific surface area of an adsorbent is conventionally based on measurements of the adsorption capacity of this adsorbent for a given solute, the molecule of this solute having to have an acceptable surface. It is sufficient for this purpose to determine the value of the adsorption capacity of the monolayer.
For the determination of *+$ specific surfaces (m2/g), we start with the relation:
SBM
, -. / 0)
$12 (4)
With 3 4 : ultimate adsorption capacity (mg/g), SBM: the area occupied by a BM molecule (175 Å), 56: Avogadro number and *+$: molar mass of methylene blue (319.853 g/mol).
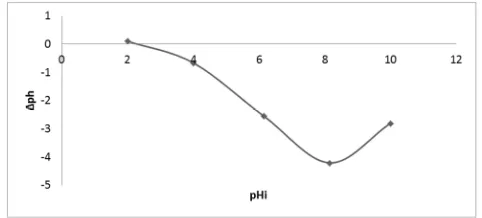
2.7. pH of the Point of Zero Charges (pHPZC)
The pH of the point of zero charges (pHPCN) is defined as the pH of the aqueous solution in which the solid exists under a neutral electric potential. It is determined for all adsorbents using the method of Ibrahim et al. (2015) [12]. Solutions at 0.1mol/L NaCl and pH between 2 and 10. The pH meter voltCraft was used for pH measurement. However, 0.1g of the adsorbent is brought into contact with 20 mL of each of the solutions contained in capped vials. The suspensions are stirred for 24 hours at room temperature. Each solution is then filtered using a filter paper (whatman) and a new pH measurement is performed. By plotting the curve representing the variation of pH (pHf - pHi) = f (pHi). The pHPCN then corresponds to the pH of the solution for which the curve crosses the first bisector.
3. Results and Discussion
3.1. Residual Moisture Values, Raw Ash Content, Iodine Index and Specific Surface Characterizing the Adsorbent
The knowledge of the characteristics of the adsorbent is
very important because it allows to better appreciate its ability to adsorb.
The water content or residual moisture is associated with the amount of water adsorbed by the material. Its value depends on the texture of the material. In this work, a value of 4.248% is obtained (Table 1). This low value of the moisture content of the biosorbent allows us to deduce that the latter has a microporous structure because micropores adsorb very little water and cause low humidity [3].
The raw ash content makes it possible to determine the mineral part. Table 1 shows a percentage ash content of 48.705%. The latter is due to the calcination of cotton cakes which leads to the decrease in percentages of proteins [12].
Table 1 shows the iodine value of 380.71 mg/g. This high value of iodine index makes it possible to conclude that the adsorbent material has on its surface micropores available for the reception of polluting micromolecules [10].
The result of the specific surface area (Table 1) obtained for the adsorbent shows that the latter has significant exchange surfaces reaching 197.77 m2/g. This high value of the specific surface makes it possible to conclude that this adsorbent complies with the standards of the specific surface area of the adsorbents and this justifies its good adsorbent capacity [14].
Table 1. Characteristics of the adsorbent.
Parameters Values
Residual moisture (4.248 ± 0.517) %
Ash content (48.705 ± 0.191)%
Iodine Index (mg/g) 380.71
SBM (m2/g) 197.77
3.2. Determination of the pH of the Point of Zero Charges (pHPZC)
The value of the pHPZC gives the ideas on the surface charges that the adsorbent materials develop on their surface. Indeed, if the equilibrium pH of the adsorption of the adsorbates on the surface of the materials is greater than the pHPZC, it is deduced that the adsorbent.
Materials develop on their surfaces negative surface charges and on the other hand if the equilibrium pH of adsorption is less than that of the pH of the point of zero charges, the materials rather develop positive surface charges on their surfaces [12]. For the present adsorbent materials, we obtained a value of 2.5 as the pHPZC value (Figure 1).
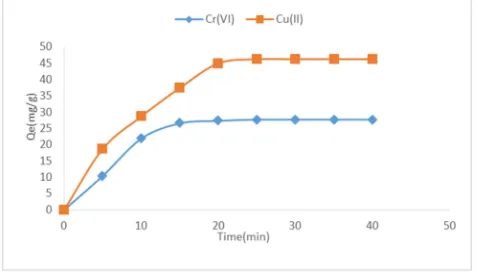
3.3. Kinetics of Adsorption: Contact Time
To measure the stirring kinetics, several identical mixtures at a concentration of 40 mg/L are stirred for different times. We work in a field of agitation duration between 5 to 40 minutes.
The results obtained (Figure 2) show that the retention of the cu2+ and Cr6+ ions on the adsorbent is done in two distinct stages: for the first minutes, it is rapid and transient (increasing), then it becomes stable after 20 minutes.
The observed growth is due to the diffusion of the Cu2+ and Cr6+ ions towards the adsorption sites until reaching an adsorption equilibrium where all the sites become occupied and reveal a similar behavior the Cu2+ and Cr6+ ions [5].
The observed stabilization is due to the saturation of the adsorption sites [5].
Figure 2. Effect of contact time on adsorption of Cu2+ and Cr6+.
3.4. Kinetic Models
The kinetic models studied in this work are those of pseudo first order, pseudo second order, Intraparticular diffusion and Elovich.
3.4.1. Kinetic Model of Pseudo-first Order
The velocity equation of the pseudo-first-order kinetic model is given by the relation:
789
7: ; <=> <: (5)
Where <= and <: are respectively the relative amounts of adsorbed metals at the adsorption equilibrium and at time t,
; (min-1) is the pseudo-first order rate constant. The integration of this equation with the initial condition (t = 0,
<= = 0) leads to the expression:
? @ <=> <: = ? @<=- A
. B (6)
Representing the function log (<= - <:) = f (t), we obtain a straight line of slope - A
. and of ordinate at the origin
? @<=. Also, this equation would be suitable for the adsorption of Cu2+ and Cr6+ ions if the respective correlation coefficient is greater than 0.90 [15]. For this purpose, the values of log <=-<:) will be calculated and represented as a function of time.
The parameters of the pseudo first-order kinetic model are shown in Table 2.
3.4.2. Kinetic Model of Pseudo-second Order
The pseudo-second-order kinetic model can be represented in the following form:
789
7: ; <=> <:
2
(7)
Where <=and <: are respectively the relative quantities of adsorbed metals at equilibrium and at time t, ; is the pseudo-second order rate constant. The integration of this equation with the condition that t = 0, < = 0 followed by a rearrangement makes it possible to have the following linearized expression:
:
89 A"8F"G8FB (8)
By representing the function t/<: = f(t), the quantity of equilibrium adsorbed metals <= and the pseudo-second order rate constant ; can be determined from the slope and from the ordinate to the origin. The adsorption of Cu2+ and Cr6+ by the cottonseed cake will follow the pseudo-second order kinetic model if the correlation coefficient of the linear regression of t/<:= f (t) is greater than 0.90.
Parameters of the pseudo-second-order kinetic model are shown in Table 2.
3.4.3. Kinetic Model of Intraparticular Diffusion
The Intraparticular diffusion rate is determined using the following equation:
<: = ;HI:t1/2 + (9)
By representing the function <:as a function of t1/2, we obtain a line of slope ;HI: and an ordinate at the origin . The equation of the Intraparticular diffusion would be appropriate for the adsorption of the Cu2+ and Cr6+ ions if the coefficient respective correlation is greater than 0.90.
With ;HI:: constant diffusion rate (mg/g.h-1/2).
The parameters of the kinetic model of Intraparticular scattering are shown in Table 2.
3.4.4. Kinetic Model of Elovich
This model is described by the following differential equation:
J89
JK α exp(β<:) (10)
The integration of this equation yields the following linear equation:
<: L ? αβ GL? (t) (11)
α (mg.g-1.min-1) is the initial adsorption rate and β (g.mg-1) is the desorption constant related to the extent of surface coverage and energy of activation for chemisorption.
According to Table 2, all the correlation coefficients R2 of the pseudo-first-order model are small (less than 0.90) compared to those of the pseudo-second-order models, Intraparticular and Elovich, all of which are very close to the unit for our two metal ions studied.
These results make it possible to conclude that the
pseudo-first-order model is not applicable for the explanation of the elimination of these ions by the adsorbent. However, the values of the R2 coefficients of the pseudo-second-order model, Intraparticular and Elovich are all greater than 0.90. These results show that only the latter models are applicable to our experimental data.
Table 2. kinetic constants of the four models.
Ions Pseudo First order Pseudo 2
nd
order Intraparticular Elovich
O PQ(mg/g) K1 R2 O PQ(mg/g) K2 R2 RSTU (mg. g-1.min-1/2) C (m2. S-1) R2 V ß R2
Cu2+ 14.381 0.136 0.616 52.910 0.003 0.961 7.863 3.142 0.932 30.719 0.0317 0.972
Cr6+ 3.431 0.031 0.299 28.818 0.027 0.997 4.525 3.640 0.934 21.322 0.0585 0.902
3.5. Effect of Some Parameters on the Elimination of Cu2+ and Cr6+ Ions
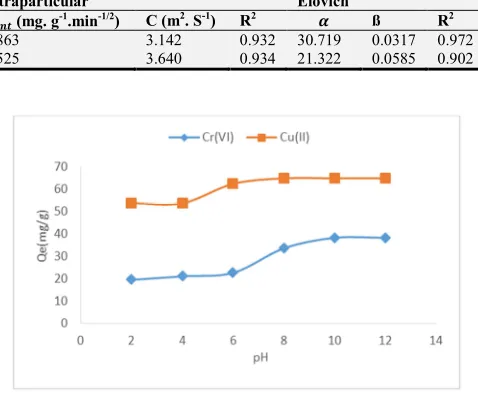
3.5.1. Effect of pH on the Elimination of Cu2+ and Cr6+ Ions
The pH of the aqueous solution is a very important variable that controls the adsorption of an ion at the solid-liquid interface. Its value must be compatible with the ion to be adsorbed. The pH values are measured using a voltcraft-type pH meter equipped with a combined glass-calomel electrode. The pH is set by adding small predetermined amounts of 0.1M sodium hydroxide or 0.1M hydrochloric acid. We will work in a pH range between 2 to 12.
For the pH values of 2 and 4 (Figure 3), the amount of adsorbed Cu2+ and Cr6+ ions are almost constant and varies little with respect to the amount adsorbed for pH 6, 8, 10 and 12 for Cu2+ and Cr6+ ions.
The small variation of the adsorbed quantities of Cu2+ and Cr6+ ions observed is justified by the fact that in strongly acid medium, our adsorbent has developed positive charges on its surface. The surface charges thus developed are therefore not sufficiently suitable for cation adsorption such as Cu2+ and Cr6+ ions. In addition, for pH values in strongly acidic medium there is competition between these ions and H+ on the adsorption sites. The presence of the (H+) cations is unfavorable for the adsorption of these metal ions because their movements in solution are slowed down by all the hydronium groups which compete with it (electrostatic repulsion of cation and H+ ions).
The jump observed for pH values of 6, 8, 10 and 12 for Cu2+ ions and pH 8, 10 and 12 for Cr6+ ions is attributed to an increase in the number of negative surface charges on the surface of the adsorbent following an interaction between Cu2+ ions, Cr6+ and the variable charges that are hydroxyl groups. For these metal ions, the attraction force is increased, therefore the adsorption increases rapidly and this is favorable for the adsorption of all the metal cations because their movement in solution is facilitated by the hydroxyl ions (HO-) and all the hydroxyl groups that compete with it [14]. In this case, the interactions of the electrostatic type take on a particular importance (electrostatic attraction of the cations and OH-).
At the pH more than 8, the surface is saturated and the metallic ion hydrolyses or form anionic species [8, 13] as shown in figure 3 and table 3.
Figure 3. Effect of pH on the removal of Cu2+ and Cr6+ ions.
Table 3. Type of species.
pH Metallic species Adsorption
< 4 Cu2+, Cr6+ Weak
[4.5-8] [CuOH]+, Cu(OH)
2, H2CrO4, [HCrO4]- High
> 8 [Cu(OH)4]2-, [Cu(OH)3]-, CrO42- Maximum
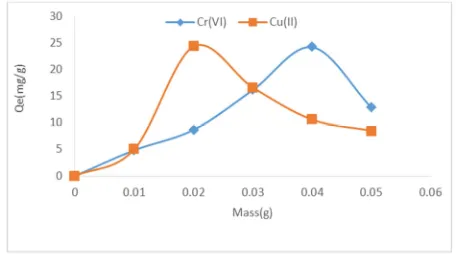
3.5.2. Effect of Adsorbent Mass
The effect of the mass of the adsorbent will be studied by contacting different masses ranging from 0.01 to 0.05 g of particle size less than 200 microns. The purpose of this manipulation is to determine the mass of the adsorbent to use for our various manipulations.
Figure 4 shows an increase in the amount adsorbed with the increase in adsorbent mass up to the masses of 0.02 g for Cu2+ ions and 0.04 g for Cr6+ ions.
The increase in the adsorbed quantities of the metal ions with the increase of the mass of the adsorbent is explained by the fact that the more the mass of the adsorbent increases in the medium, the more there is agglomeration of the particles and acceleration diffusion of pollutant molecules into the pores of the adsorbent [16].
This would also be explained by the fact that the smaller the adsorbent mass in the solution (50 mL), the more the medium is not saturated, whereas the diffusion of the metal molecules is not easy [17].
Figure 4. Effect of adsorbent masses on the removal of Cu2+ and Cr6+ ions in function.
3.5.3. Effect of Initial Concentration of Solutions
To measure the effect of the concentration, several mixtures of different concentrations are stirred at 250 rpm. We will work in a concentration range of 20 to 100 mg/L.
Figure 5 shows an increase in adsorbed quantities of Cu2+ and Cr6+ ions with increasing concentrations and stabilization at concentrations of 40 mg/L or higher for both ions.
The increase in the amount adsorbed for the first concentrations of the solution observed is justified by the fact that the higher the concentration of the solution, the more molecules of these metal ions are numerous in the solution, the more they are in contact with the solution. Then the adsorbed amount is high [10, 14, 18].
The stabilization of the adsorbed quantities is due to the fact that the adsorption sites or pores are completely saturated, this indicates a gradual saturation of the adsorption sites and the molecules of these ions are free in solution [10, 14, 18].
Figure 5. Effect of the initial concentrations of the solutions on the removal of Cu2+ and Cr6+ ions.
3.5.4. Effect of the Temperature of the Reaction Medium
To measure the effect of temperature, several identical mixtures are stirred at different temperatures. The temperature values are measured in a water bath with a temperature range of 20 to 50°C.
From Figure 6 it is found that the adsorbed amounts of Cu2+ and Cr6+ ions on the adsorbent decreases as the temperature of the medium increases.
The decrease in the amount adsorbed with the increase in temperature is due to the influence of the pore size. A large fraction of micropores is the same size as the molecule that can enter these pores only under certain temperature conditions [4].
The decrease in the amount adsorbed with the increase in temperature would also be due to a very slow diffusion of the adsorbate and a decrease in active centers available for adsorption. Decreasing the radius of the hydrated ion at high temperature may allow low occupancy of the narrower adsorption sites.
Figure 6. Curve represents the effect of temperature on the removal of Cu2+ and Cr6+ ions.
3.6. Adsorption Isotherms
The adsorption isotherms of Langmuir, Freundlich, Temkin and Dubinin-Redushkevic are studied in this work [15]. The Langmuir model is widely used to describe adsorption in solution. Freundlich is the second most commonly used model; it applies to many cases, especially in the case of an adsorbent with a heterogeneous adsorption surface. Temkin's assumes that the decrease in heat of adsorption with recovery rates is linear rather than logarithmic.
3.6.1. Insulation Type 1: Langmuir Model
The Langmuir adsorption isotherm is widely used to describe adsorption in solution. The Langmuir isotherm can be represented by the equation:
<=
-AWXF
YAWXF (12)
The equation above can be rearranged in the following linear form:
XF
8F -AWG- = (13)
the adsorption of metals in solution. Thus, adsorption of metals by cotton cake will follow the Langmuir model if the correlation coefficient of the regression of =/<= versus = is greater than 0.90.
The parameters of the Langmuir isotherm model are shown in Table 4.
3.6.2. Isotherm Type II: Freundlich Model
The simple and empirical Freundlich model is the second most commonly used model. It is considered that it applies to many cases, in particular in the case of an adsorbent with a heterogeneous adsorption surface:
<== [\ =1/n
(14)
The linear expression of the Freundlich equation is obtained by taking the logarithm of the equation:
? <== ? [\ +
I? = (15)
With [\ and n: the constants respectively reflecting the
measurement of the adsorption capacity and the adsorbent-adsorbate affinity. The constant n gives an indication of the intensity of the adsorption. It is generally accepted that low values of n (0.1 < n <0.5) are characteristic of good adsorption, while higher values indicate moderate (0.5 < n <1) or low adsorption. (n > 1). The constant "n" is very often replaced by "1/n" or heterogeneity factor.
The parameters of Freundlich's isothermal model are shown in Table 4.
3.6.3. Temkin Isotherm
This model considers a non-uniformity of surface and a preferential occupation of the most adsorbent sites.
The Temkin isothermal model is generally applied in the following form:
<== ]^
_ ? 6 o` <== B? A + B? (16)
With B = RT/b, <= (mg.g-1) and Ce (mg.L-1) are
respectively the equilibrium adsorbed amount and the
equilibrium concentration. In addition, T is the temperature (K), R is the gas constant (8.314 J.mol-1.K-1). The constant B is related to the heat of adsorption.
The parameters of the Temkin isothermal model are shown in Table 4.
3.6.4. Dubinin-redushkevich Model
Dubinin-Redushkevich's model was inspired by the Dubinin-Polanyi model. The latter is based on the approach of volume filling with the application of Polanyi's potential theory. With this approach, it is considered that the interactions between the adsorbate molecules and the adsorbent surface are determined by a potential field and that the adsorbate volume is only a function of the potential of this field ε.
The Dubinin-Redushkevich isotherm is given by the following equation:
<= = < a(-kε2) (17)
By linearizing this equation, we obtain the following expression:
? <= = ? < – ;ε (18)
With <=: quantity of the ion of the adsorbed metal, ;:
relative constant of the adsorption energy, < : theoretical capacity of the micropores, ε is the potential of Polanyi (ε:b ? (1+1/Ce)).
The parameters of the Dubinin-Redushkevich isothermal model are shown in Table 4.
Table 4 presents the values of the R2 correlation coefficients of the Langmuir, Temkin and Dubinin-Radushkevic isotherms which are all close to unity. Whereas Freundlich's is less than 0.90. In addition, the value of the Freundlich n-value is greater than 1 shows that there is a low affinity between the Cu2+ and Cr6+ ions and the adsorbent.
These results (Table 4) show that only the Langmuir, Temkin and Dubinin-Radushkevic isothermal models better explain the adsorption phenomenon of Cu2+ and Cr6+ ions on our adsorbent from cotton cakes.
Table 4. Constants of different adsorption isotherms.
Ions Langmuir Isotherm Freundlich Isotherm Temkin Isotherm Dubinin-Radushkevic Isotherm
P (mg/g) cd R2 T ce R2 A (L/g) B R2 K O (mg/g) R2
Cu2+ 89.285 0.823 0.998 1.17 4.734 0.624 0.171 -107.34 0.996 0.007 7.871 0.994
Cr6+ 44.843 1.570 0.999 1.53 4.794 0.546 0.151 - 42.059 0.981 0.004 6.26 0.956
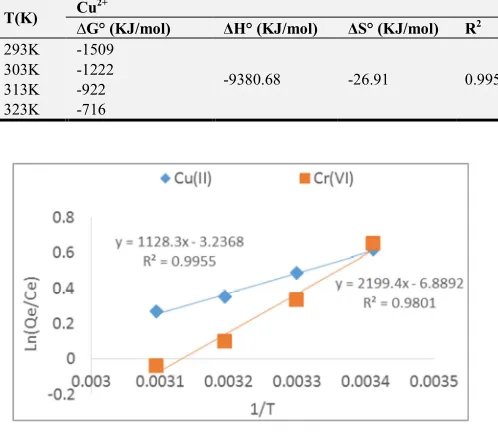
4. Thermodynamic Parameters
The adsorbed relative amounts obtained at different temperatures were used to calculate important thermodynamic properties such as Gibbs free standard energy ∆G° (Kj.mol-1), standard enthalpy (∆H°) (Kj.mol-1)) and standard entropy (∆S°) (Kj.mol-1.K-1).
The Gibbs free standard energy was evaluated by the following equation:
∆G° = -b ? ;7 (19)
The equilibrium constant ;7 was calculated using the ratio
∆S°:
;7 =
8F
Xf (20)
With <= and , the adsorbed amount (mg/g) and the
equilibrium concentration of the metals in the solution (mg/L), respectively. The standard enthalpy (∆H°) and entropy (∆S°) values were determined from the Van't Hoff equation:
g ;7=
h/°
] = −
hj°
∆G° = ∆H° -T∆S° (22)
The representation of ? ;7 as a function of 1/T of the Van't Hoff equation is a line of slope ∆H°/R and intercepts ∆S°/R.
The values of (∆H°) and (∆S°) were deduced from the slope and the ordinate at the origin of the equation of the line obtained by the function ? ;7= f (1/T).
Table 5 shows all the values of the enthalpies of the reaction ∆H° (KJ/K.mol) negative, suggests that the
elimination reaction of Cu2+ and Cr6+ ions on the adsorbent based on cotton cake is exothermic. The entropies ∆S° (KJ/K.mol) are also all negative, suggests that this chemical reaction leads to the organization of the system (ordered reaction). The free enthalpies ∆G° (KJ/K.mol) of the reaction are also all negative, suggests that this chemical reaction is spontaneous [14, 18].
Table 5. Values of thermodynamic quantities.
T(K) Cu
2+ Cr6+
∆G° (KJ/mol) ∆H° (KJ/mol) ∆S° (KJ/mol) R2 ∆G° (KJ/mol) ∆H° (KJ/mol) ∆S° (KJ/mol) R2 293K -1509
-9380.68 -26.91 0.995
-1587
-18285.8 -57.27 0.980
303K -1222 -843
313K -922 -255
323K -716 -99
Figure 7. Thermodynamic Parameters.
5. Conclusion
The elimination of Cu2+ and Cr6+ ions by a thermally modified biosorbent based on cotton cakes is a contribution to water treatment. The adsorption tests were carried out on the synthesized solutions of distilled water by examining the effect of the few reaction parameters such as the contact time, the initial concentration of the solutions, the mass of the adsorbent, the pH of the medium and the temperature of the medium. The results obtained showed that the elimination of these Cu2+ and Cr6+ ions by the adsorbent produced based on cotton cakes is rapid and the equilibrium is reached at 20 minutes. It is also noted that the adsorbed quantities of these ions increase with the mass of the adsorbent, the initial concentration of the solutions as well as with the pH of the medium. On the other hand, they decrease with increasing temperature. The kinetic models that better express the phenomenon of elimination of Cu2+ and Cr6+ ions in this work, for which we obtained the correlation coefficients close to unity, are those of pseudo-second order, Intraparticular and Elovich. The adsorption isotherms of Langmuir, Temkin and Dubinin-Redushkevic better express the adsorption mechanism of these two ions on the adsorbent. The low values found for the heat of adsorption (<40 kJ/K.mol) and the electrostatic attraction between Cu2+ and Cr6+ ions for pH higher than that of the pH of the point of zero charges imply that the adsorption of the ions Cu2+ and Cr6+ on the adsorbent based on cotton cake is of the physical type (physisorption).
References
[1] Ruiti Manel and Ben Thayer Bechir. (2015). Elimination of iron by oxidation and adsorption processes on charcoal pine. International Journal of Innovation and Applied Studies. Vol. 10. No. 2. pp. 694-700.
[2] Oualid Hamdaoui. Emmanuel Naffrechoux. (2005). Study of equilibria and kinetics of adsorption of copper (II) on reactive particles in a closed reactor, perfectly agitated and thermostatically controlled. Lebanese Science Journal. Vol. 6. No. 1. pp. 59-68. pp. 1-730.
[3] Mimanne G., K. Benhabib. A. Benghalem, S. Taleb. (2014). Study of the adsorption of heavy metals (pb and cd) in aqueous solution on activated carbon and sod montmorillonite of western Algeria. J. Mater. About. Sci. 5 (4). pp. 1298-1307. [4] Harouna. M, C Tcheka, D Abia, D N Kobbe, B B Loura3 and J
B Tchatchueng. (2015). Kinetic, thermodynamic and equilibrium studies on adsorption of alumina and zinc ions to activated carbon from hull seeds of moringa oleifera. Int. J. Engg. Res. & Sci. & Tech. Vol. 4. No. 4. pp. 2319-5991. [5] Bendaho Djelloul, Ainadtabet Driss, Bassou Djillali. (2014).
Adsorption of Cu (II) copper in solution by raw and activated clay from the Tiut-Naama region of southwestern Algeria.
Journal of Materials Science. No. 02. pp. 23-34.
[6] Himanshu Patel and R. T. Vashi. (2010). Decomposition of Dyeing Mill Wastewater by Adsorption and Coagulation. E-Journal of Chemistry. 7 (4). pp. 1468-1476.
[7] Arris Sihem Wife Cheriba. (2008). Experimental study of the elimination of organic and inorganic pollutants by adsorption by-products of cereals. Doctoral thesis.
[8] Youcef L., S. Achour. (2006). Elimination of copper by chemical precipitation and adsorption processes. Mail of knowledge. No. 7. pp. 59-65.
[10] Domga Richard, Constant Tcheka, Ghislain Arnaud Anchogo Mouthe, nathalie Kobbe, Jean Bosco Tchatchueng, Alifa Tchigo, And Arbam Tsafam. (2016). equilibrium adsorption of methyl orange from aqueous solution using activated carbon from gudali bones. International journal of innovation sciences and research. 7 (5). pp. 798-805.
[11] Safa Messeaouda. (2016). Study of the capacity of retention and elimination of metallic cations by natural adsorbents. Doctoral thesis. University of Mustapha Stambouli, Mascara. pp. 1-184.
[12] Ibrahim Tchakala, L. Moctar Bawa, G. Djaneye-Boundjou. K. S. Doni, Pnambo. (2012). Optimization of the process for the preparation of chemically active carbons (H3PO4) from shea cakes and cottonseed cakes. J. Biol. Chem. Sci. 6 (1). pp. 461-478.
[13] Ikhlass Marzouk Trifi. (2002). Study of the elimination of chromium (VI) by adsorption on activated alumina and cross-ionic dialysis. PhD thesis, University Paris-Est Créteil ICMPE. pp. 1-175.
[14] Domga Richard, Domga, Jean BoscoTchatchueng, Felix Nyounai, Symphorien Fadeune Gaineunbo, Fabane, Mathieu Béné, Thomas Assokeng, Arbam Tsafam, Benjamin Espoir
NÔN. (2018). Bones and its Adsorption for chromium (VI) in aqueous solution. Int. J. Engg. Res. & Sci. & Tech. 1 (7). pp. 2319-5991.
[15] Ho, Y. S. & Mckay, G. (1998). A comparison ofchemisorption kinetic models applied to pollutant removal on various sorbents. Proc. Saf. Environ. P rotec., 76, 332–340.
[16] Aarfane, A., Salhi, A., ElKrati, M., Tahiri, S., Monkade, M., Lhadi, E. K., Bensitel, M. (2014). Kinetic and thermodynamic study of the adsorption of Red 195 and Methylene blue dyes on fly ash and bottom ash in aqueous medium. J. Mater. Environ. Sci., 5 (6), 1927-1939.
[17] Baliti, J., Asnaoui, A., Abouarnadasse, S. (2014). L’élimination du bleu de methylene par une argile naturelle de Taza en milieu aqueux. International Journal of Innovative Researchin Advanced Engineering, 321, 2349-2163.
[18] Domga Richard., Massai Harouna., Constant Tcheka., Jean Bosco Tchatchueng., Arbam Tsafam., Domga., Nathalie Kobbe Dama., Dangwang Dikdim. (2015). Batch Equilibrium, Kinetic and Thermodynamic Studies on the Adsorption of Methylene Blue in Aqueous Solution onto Activated Carbon Prepared from Bos Indicus Gudali Bones. chemistry journal.