University of New Hampshire
University of New Hampshire Scholars' Repository
Center for Coastal and Ocean Mapping
Center for Coastal and Ocean Mapping
4-28-2018
How to recognize crescentic bedforms formed by
supercritical turbidity currents in the geologic
record: insights from active submarine channels
Sophie Hage
University of Southampton
Matthieu J.B. Cartigny
University of Durham
Michael A. Clare
University of Southampton
Esther J. Sumner
University of Southampton
Daniela Vendettuoli
University of Southampton
See next page for additional authors
Follow this and additional works at:
https://scholars.unh.edu/ccom
This Article is brought to you for free and open access by the Center for Coastal and Ocean Mapping at University of New Hampshire Scholars' Repository. It has been accepted for inclusion in Center for Coastal and Ocean Mapping by an authorized administrator of University of New Hampshire Scholars' Repository. For more information, please [email protected].
Recommended Citation
Authors
Sophie Hage, Matthieu J.B. Cartigny, Michael A. Clare, Esther J. Sumner, Daniela Vendettuoli, John E. Hughes
Clarke, Stephen M. Hubbard, Peter J. Talling, D. Gwyn Lintern, Cooper D. Stacey, Rebecca G. Englert, Mark
E. Vardy, James E. Hunt, Miwa Yokokawa, Daniel R. Parsons, Jamie L. Hizzett, Maria Azpiroz-Zabala, and Age
J. Vellinga
GEOLOGY| Volume 46 | Number 6 | www.gsapubs.org 563
How to recognize crescentic bedforms formed by supercritical
turbidity currents in the geologic record: Insights from active
submarine channels
Sophie Hage
1,2, Matthieu J.B. Cartigny
3, Michael A. Clare
1, Esther J. Sumner
2, Daniela Vendettuoli
1,2,
John E. Hughes Clarke
4, Stephen M. Hubbard
5, Peter J. Talling
2, D. Gwyn Lintern
6, Cooper D. Stacey
6,
Rebecca G. Englert
5, Mark E. Vardy
1, James E. Hunt
1, Miwa Yokokawa
7, Daniel R. Parsons
8, Jamie L. Hizzett
1,2,
Maria Azpiroz-Zabala
1,2, and Age J. Vellinga
1,21National Oceanography Centre, University of Southampton Waterfront Campus, Southampton SO14 3ZH, UK 2Ocean and Earth Sciences, University of Southampton, Southampton SO14 3ZH, UK
3Departments of Earth Science and Geography, University of Durham, Durham DH1 3LY, UK
4Center for Coastal and Ocean Mapping, University of New Hampshire, Durham, New Hampshire 03824, USA 5Department of Geoscience, University of Calgary, Calgary, Alberta T2N 1N4, Canada
6Natural Resources Canada, Geological Survey of Canada, Sidney, BC V8L 4B2, Canada 7Osaka Institute of Technology, Hirakata, Osaka 573-0196, Japan
8Department of Geography, Environment and Earth Sciences, Faculty of Science, University of Hull, Hull HU6 7RX, UK
ABSTRACT
Submarine channels have been important throughout geologic time for feeding globally significant volumes of sediment from land to the deep sea. Modern observations show that submarine channels can be sculpted by supercritical turbidity currents (seafloor sediment flows) that can generate upstream-migrating bedforms with a cres-centic planform. In order to accurately interpret supercritical flows and depositional environments in the geologic record, it is important to be able to recognize the depositional signature of crescentic bed-forms. Field geologists commonly link scour fills containing massive sands to crescentic bedforms, whereas models of turbidity currents produce deposits dominated by back-stepping beds. Here we reconcile this apparent contradiction by presenting the most detailed study yet that combines direct flow observations, time-lapse seabed mapping, and sediment cores, thus providing the link from flow process to depositional product. These data were collected within the proximal part of a submarine channel on the Squamish Delta, Canada. We demonstrate that bedform migration initially produces back-stepping beds of sand. However, these back-stepping beds are partially eroded by further bedform migration during subsequent flows, resulting in scour fills containing massive sand. As a result, our observations bet-ter match the depositional architecture of upstream-migrating bed-forms produced by fluvial models, despite the fact that they formed beneath turbidity currents.
INTRODUCTION
Turbidity currents transfer vast amounts of sediment from land to the deep sea via submarine channels. Deposits of turbidity currents that filled ancient submarine channels are important because they record past fluxes of sediment, organic carbon, and nutrients. There are few direct observa-tions from turbidity currents in action. Even fewer studies have linked direct observations to detailed time-lapse mapping of seafloor change (e.g., Hughes Clarke, 2016) or sedimentary deposits (e.g., Symons et al., 2017). This means that links between flow processes and deposits are much debated (e.g., Ventra et al., 2015; Kane and Hodgson, 2015), with direct implications for reconstructing flows, past environments, and larger-scale sedimentary systems. Here we enable accurate interpretation of these deposits by providing the most detailed study yet of turbidity
currents that combines direct flow monitoring, time-lapse seafloor map-ping, and sediment coring.
Seafloor mapping has revealed that proximal, sandy submarine chan-nels are often characterized by crescentic bedforms that migrate upstream (Symons et al., 2016). Flow observations in submarine channels (Hughes Clarke, 2016) have connected these upstream-migrating bedforms to flow instabilities, termed cyclic steps (Kostic and Parker, 2006; Spinewine et al., 2009), which can occur at the base of supercritical stratified turbidity currents (Postma and Cartigny, 2014). Such upstream-migrating bedforms are important, as they can enhance sediment transport efficiency (Sun and Parker, 2005), and may initiate and maintain submarine channels (Fildani et al., 2013; Covault et al., 2014). Prevalence of these upstream-migrating bedforms on the modern seafloor (Symons et al., 2016) suggests their deposits should be abundant in the geologic record. However, their depositional signature is poorly constrained due to discrepancies between modeling results and outcrop observations.
Numerical and physical experiments with supercritical turbidity cur-rents suggest they deposit regular back-stepping (dipping up-slope) beds (Spinewine et al., 2009; Postma and Cartigny, 2014; Covault et al., 2017). In contrast, outcrops interpreted as cyclic step deposits are predominantly characterized by scour fills containing massive sand, occasionally in com-bination with back-stepping beds (Dietrich et al., 2016; Lang et al., 2017; Ono and Björklund, 2017). Modern analogues for these massive sands are reported in sediment cores collected from crescentic bedforms in Monterey Canyon (offshore California, USA) (Paull et al., 2011); and similar bedforms have been associated with cyclic steps on Squamish Delta, Canada (Hughes Clarke, 2016). Integration of synoptic measure-ments from supercritical turbidity currents, associated bedforms, and deposits from a single system are needed to resolve these discrepancies between model predictions and outcrop observations.
Aims
Here we present the first combination of detailed (sub-minute reso-lution) flow monitoring, high-frequency (near daily) time-lapse seabed mapping, and sediment core data from an active proximal turbidity cur-rent system. Our aims are to (1) understand how proximal crescentic bed-forms that formed beneath sandy supercritical flows are recorded in the sedimentary record; (2) use these observations to reconcile discrepancies
564 www.gsapubs.org | Volume 46 | Number 6 | GEOLOGY between existing experimental depositional models and outcrop
observa-tions; and (3) provide diagnostic criteria to identify crescentic bedforms in the geologic record.
STUDY SITE AND METHODS
Three turbidity current channels lie on the Squamish River Delta front, which flows into Howe Sound, British Columbia (Fig. 1). Here we focus on the proximal section of the central channel, which stretches for ~600 m, from 40 to 100 m water depth, and contains crescentic bedforms with a wavelength of 20–30 m and height of 2–3 m. In this location, flow observa-tions show that crescentic bedforms result from supercritical flow condiobserva-tions at the base of turbidity currents (Hughes Clarke, 2016). We studied these bedforms in the central channel over three field seasons (2011, 2015, and 2016) and now integrate these data to link flow processes with their sedi-mentary deposits. Ideally, all data would be recorded in the same field sea-son; however, such a data set does not yet exist in any location. Instead, we integrate data collected during three field seasons in which river discharges, turbidity current characteristics, and changes in seafloor morphology were similar (Table DR2 and Figure DR2 in the GSA Data Repository1) (Hughes Clarke et al., 2014; Clare et al., 2016; Hughes Clarke, 2016).
Flow and Seafloor Observations
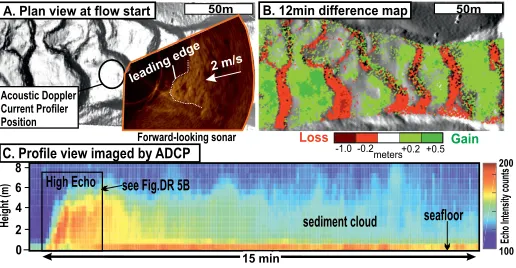
Flow dynamics were measured in June 2015 using two vessels. The first vessel was moored using four anchors in a water depth of 60 m (Fig. 1; Fig. DR1a). Three acoustic instruments were suspended 30 m above the seafloor from this fixed vessel, to measure turbidity currents in three dimensions (c.f. Hughes Clarke, 2016; Table DR1). Two acoustic sonars imaged flows in both cross section and plan view (Fig. 2A; Fig. DR1, Movies DR1 and DR2). A 600 kHz acoustic doppler current profiler (ADCP) recorded flow velocity and echo (acoustic backscatter) intensity counts, imaging the cur-rent every 3.5 s (Fig. 2C). The second vessel enabled mapping of the 250 × 100 m study area every 12 min (Fig. 2B) using an EM710 multibeam system operating at 70–100 kHz. This repeat survey enabled seafloor changes (e.g., bedform migration) to be directly related to turbidity current measurements.
Sedimentary Deposit Observations
Depositional architecture resulting from successive flows was com-puted using time-lapse seafloor surveys collected in 2011. This data set comprises 93 weekday repeat bathymetric maps of the bedform-covered channel floor (Hughes Clarke et al., 2014). By subtracting each bathy-metric survey from the previous day, we detected temporal changes in seafloor elevation during a 4 month period. Sediment gains and losses were then stacked to reconstruct the stratigraphic evolution associated with the upstream-migrating bedforms (Fig. 3A).
Finally, a series of closely spaced cores were collected in June 2016 across two crescentic bedforms (Fig. 3B). These cores were logged visu-ally and photographed to document the sedimentary facies that character-ize upstream-migrating bedforms.
RESULTS
Flow Monitoring and Seafloor Morphological Change
Here we focus on an individual flow monitored on 15 June 2015 in the central channel (Figs. 1 and 2). This 15 min flow was characterized by a maximum frontal velocity of 2 m/s, a maximum thickness of 7 m, and a maximum width of 100 m (Figs. 2A and 2C; Movies DR1 and DR2). Echo-sounder images show that the leading edge of the flow accelerated over the steep lee side of the bedforms (Fig. 2A; Movies DR1 and DR2). This flow
1 GSA Data Repository item 2018187, supplemental information on field
cam-paigns and additional outcrop study examples (Tables DR1–DR3, Movies DR1 and DR2, and Figures DR1–DR4), is available online at http://www.geosociety .org /datarepository /2018/ or on request from [email protected].
has similar properties to flows previously observed in the northern channel (velocity, dimensions, and duration; Table DR2). It caused similar move-ment of bedforms to those shown to result from cyclic steps at the base of supercritical turbidity currents in the 2013 surveys (Hughes Clarke, 2016). Detailed seafloor mapping was conducted simultaneously with the flow observations on 15 June 2015. The observed flow is linked with up to 1.5 m of upstream bedform migration (Fig. 2B). Deceleration of the flow promoted deposition of 0.25–0.5-m-thick upstream-dipping beds of sediment on the stoss side of bedforms, as shown in the 12 min difference maps (Fig. 2B).
Deposit Geometry (Seafloor Difference Maps) and Facies (Cores)
Four months of near-daily bathymetric surveys in 2011 allow us to study the stratigraphic architecture that results from upstream migration of crescentic bedforms (Fig. 3A). The uppermost part of the stratigraphy (Fig. 3A) contains up to 3-m-thick successions of back-stepping beds. Individual back-stepping beds are 0.1–0.5 m thick. These back-stepping beds result from the most recent turbidity current depositing sediment on the stoss side of bedforms, causing bedforms to migrate upstream. Occa-sionally, large flows cause more significant upstream bedform migration, and erode the seafloor more deeply, producing thicker (1 to 2.5 m) stepping beds (see Fig. DR3). The lower portion of these thicker back-stepping beds is preserved typically as 1–2-m-thick scour fills, as seen in the lower part of the final stratigraphy (Fig. 3A; Fig. DR3).
Lastly, we used a set of piston and box cores to sample the sedimentary facies that are associated with both back-stepping beds and scour fills (Fig. 3B). The sediment cores all contain multiple units of massive sands, which are ungraded to poorly graded, and lack visible sedimentary structures (e.g.,
-10m
-200m water depth
Squamish
river June 2016
Bathymetry June 2011 100m
Figs 2A,C anchored vesselJune 2015
northern channe l southern channe l Central channel Central channel
0 500 1000m
B C D Fig. 3A Squamish U.S. Canada River Fig. 3B A Delta lip 123˚W. 124˚W. 49˚N 100m
0 100Echo Intensity counts
200 seafloor +0.5 +0.2 meters -0.2 -1.0 Loss Gain
see Fig.DR 5B
sediment cloud High Echo 50m 50m 2 4 6 Height (m )8 2 m/s Forward-looking sonar leading edge
C. Profile view imaged by ADCP
Acoustic Doppler Current Profiler Position
A. Plan view at flow start B. 12min difference map
15 min
Figure 2. Observations of a turbidity current linked to crescentic bedforms. A: Snapshot showing a plan view of flow traveling over bedforms. B: Seafloor change during 12 min period after the flow snap-shot in A and C. C: Time series of echo intensity recorded by acoustic doppler current profiler (ADCP) backscatter showing turbidity current (location in A).
GEOLOGY| Volume 46 | Number 6 | www.gsapubs.org 565 laminations). The uppermost sands in two box cores were faintly laminated
(cores 8 and 9; Fig. 3B). The uppermost parts of piston cores can be lost or disturbed during coring, potentially explaining the lack of laminations. Contacts between beds are typically sharp and erosive. Individual beds are therefore inferred to result from individual turbidity currents. Core bases are commonly characterized by 1–2-m-thick sand beds, which likely record infilling of deep scour fills during large flow events. The tops of cores display amalgamated sand beds with thicknesses that correspond to those of back-stepping beds recorded by repeat bathymetric surveys (0.1–0.5 m; Fig. 3A).
DISCUSSION
Comparison with Existing Models
Cyclic steps and their deposits have been modeled both in turbidity current settings (e.g., Fildani et al., 2006; Spinewine et al., 2009; Kostic, 2011; Cartigny et al., 2011; Covault et al. 2017) and in fluvial settings (e.g., Yokokawa et al., 2009; Cartigny et al., 2014; Vellinga et al., 2017). Surprisingly, and as described below, our observations better match the depositional architecture of cyclic steps produced by fluvial models rather than those produced by turbidity current models.
Studies of turbidity current bedforms have focused either on the deposi-tional architecture (e.g., Spinewine et al. 2009; Kostic, 2011; Covault et al., 2017), or on the facies characteristics (e.g., Migeon et al., 2001; Postma and Cartigny, 2014) resulting from cyclic steps. Existing architectural models predict regular back-stepping beds that form via deposition by the thick and slow part of the flow on the stoss side of bedforms. Our observa-tions (Fig. 4) are consistent with this model, as they show back-stepping beds in the uppermost part of the stratigraphy. However, we also show that these back-stepping beds are subsequently eroded, as bedforms continue to migrate upstream. Thus, ultimately, only the lowest parts of the thickest back-stepping beds are preserved as scour fills. An existing model of cyclic step facies (Postma and Cartigny, 2014) relates the thick and slow part of turbidity currents, located downstream from hydraulic jump, to laminated sands (Bouma’s Tb; Bouma, 1962). This model suggests that massive sands (Bouma’s Ta) can be formed near the hydraulic jump. In agreement with this model, our cores contain units composed of visually massive sands (Fig. 3B). However, in contrast to the model, these cores do not contain continuous units of laminated sands visible to the naked eye (Bouma’s Tb). The lack of such laminated sand units suggests that near-bed sediment concentrations of individual turbidity currents were sufficiently high to suppress turbulence, thereby depositing massive sands (e.g., Sumner et al., 2008).
Previous models in fluvial settings demonstrate that aggradation rate affects deposit characteristics in supercritical flows (Yokokawa et al., 2009; Cartigny et al. 2014; Vellinga et al., 2017) At one end of the spec-trum, high net aggradation rates produce regular back-stepping beds; at the other end of the spectrum, low net aggradation rates produce scour fills. The only geometries preserved in our final stratigraphy are scour fills that result from large flows. Based on analogies with fluvial models, we infer that large flows produce higher aggradation rates, thus producing thicker sands that have better preservation potential.
Recognition of Supercritical Flow Deposits in the Geologic Record
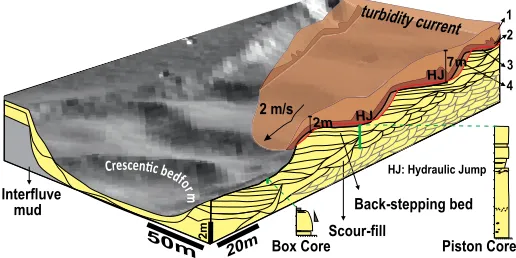
We synthesize the three data sets into a single block diagram to illus-trate the relationships among flow, seafloor morphology, and subsurface deposit architecture (Fig. 4). This diagram provides diagnostic criteria to recognize crescentic bedform deposits produced by cyclic steps beneath sandy turbidity currents. Deposit architectures can range between two end-members: (1) regular back-stepping beds that correspond to a more-complete preservation, and (2) scour fills containing massive sands that correspond to less-complete preservation. The preservation potential of these bedforms depends on both the magnitude of the turbidity currents and net aggradation rates.
granules
A
μm 250
2000
Mud Sand
normal grading Day 1 + 4 months
20m
2m
20
cm
See Table DR3 for other examples of ancient crescentic bedforms
5 4 3 2 1
9 8
see Fig. 1 for profile location
organics Piston cores
Box cores Core Positions
Crescentic bedform stratigraphy: each line represents 1 day
6
2
m
7
1m
(see Fig. 1D)
back-stepping bed back-stepping bed
1m
1 scour fill
1m
e.g. for scale: photos from Cretaceous Nanaimo Group
outcrop (see Fig. DR4)
B
Day 1
1
5 4
9 7
2 3
8
50 m
Back-stepping bed
HJ: Hydraulic Jump
mud
2m
Box Core 50m
1
Scour-fill 2 m/s
turbidity curren
t 2
3 4 HJ
HJ7m
2m
Interfluve
Figure 4. Summary schematic of crescentic bedforms formed by supercritical turbidity currents and their depositional architecture. 1— low-density upper part of the flow; 2—high-density lower part of the flow, with hydraulic jumps due to changing gradient over bedforms; 3—deposition; 4—erosion by active event. Red line corresponds to the resulting bathymetry after a single flow. Black lines are observa-tions from Figure 3A. Gray lines are predicobserva-tions.
566 www.gsapubs.org | Volume 46 | Number 6 | GEOLOGY Comparable architectures have been described in many
paleo-environ-ments, such as deltas, submarine channels, and glaciolacustrine settings (e.g., Ponce and Carmona, 2011; Lang and Winsemann, 2013; Postma et al., 2014; Ventra et al., 2015; Bain and Hubbard, 2016; Dietrich et al., 2016; Lang et al., 2017; Ono and Björklund, 2017). For example, individual 1–2-m-thick and 5–15-m-long scour fills containing massive sandstone have been observed in multiple outcrops worldwide (Fig. 3A; Table DR3; Lang and Winsemann, 2013; Postma et al., 2014; Bain and Hubbard, 2016; Dietrich et al., 2016; Lang et al., 2017). These examples also feature back-stepping beds that are 0.5–3.0 m thick and 10–40 m long (Fig. 3A; Table DR3). We infer that these examples formed from supercritical flows with variable net aggradation rates and magnitude, since they show both back-stepping beds and scour fills composed of massive deposits. Outcrops characterized exclusively by back-stepping beds that are suggestive of purely aggradational conditions are rare (e.g., Ponce and Carmona, 2011; Ventra et al., 2015; Table DR3).
In conclusion, this unique combination of flow monitoring, repeat map-ping, and deposit sampling enables accurate identification of crescentic bed-forms and supercritical flow deposits within proximal submarine channels.
ACKNOWLEDGMENTS
Hage is funded by the National Oceanography Centre (UK) and ExxonMobil. We thank the captains and crews of CCGS Vector, RV John Strickland, and CSL
Heron. We thank D. Piper, Z. Sylvester, A. Normandeau, and Editor J. Schmitt for
insightful reviews. We acknowledge Natural Environment Research Council fund-ing (grants NE/M007138/1, NE/M017540/1, NE/P009190/1, and NE/P005780/1).
REFERENCES CITED
Bain, H.A., and Hubbard, S.M.H., 2016, Stratigraphic evolution of a long-lived submarine channel system in the late Cretaceous Nanaimo Group, British Columbia, Canada: Sedimentary Geology, v. 337, p. 113–132, https:// doi .org /10 .1016 /j .sedgeo .2016 .03 .010.
Bouma, A.H., 1962, Sedimentology of Some Flysch Deposits: Amsterdam, Elsevier. Cartigny, M.J.B., Postma, G., Van Den Berg, J.H., and Mastbergen, D.R., 2011, A comparative Study of sediment waves and cyclic steps based on geometries, internal structures and numerical modelling: Marine Geology, v. 280, p. 40–56, https:// doi .org /10 .1016 /j .margeo .2010 .11 .006.
Cartigny, M.J.B., Ventra, D., Postma, G., Van Den Berg, J.H., and Venditti, J., 2014, Morphodynamics and sedimentary structures of bedforms under supercritical-flow conditions: New insights from flume experiments: Sedimentology, v. 61, p. 712–748, https:// doi .org /10 .1111 /sed .12076.
Clare, M.A., Hughes Clarke, J.E., Talling, P.J., Cartigny, M.J.B., and Pratomo, D.G., 2016, Preconditioning and triggering of offshore slope failures and turbidity currents revealed by most detailed monitoring yet at a fjord-head delta: Earth and Planetary Science Letters, v. 450, p. 208–220, https:// doi .org /10 .1016 /j .epsl .2016 .06 .021.
Covault, J.A., Kostic, S., Paull, C.K., Ryan, H.F., and Fildani, A., 2014, Subma-rine channel initiation, filling and maintenance from sea-floor geomorphol-ogy and morphodynamic modelling of cyclic steps: Sedimentolgeomorphol-ogy, v. 61, p. 1031–1054, https:// doi .org /10 .1111 /sed .12084.
Covault, J.A., Kostic, S., Paull, C.K., Sylvester, Z., and Fildani, A., 2017, Cyclic Steps and related supercritical bedforms: Building blocks of deep-water depo-sitional systems, Western North America: Marine Geology, v. 393, p. 4–20, https:// doi .org /10 .1016 /j .margeo .2016 .12 .009.
Dietrich, P., Ghienne, J.-F., Normandeau, A., and Lajeunesse, P., 2016, Upslope-migrating bedforms in a proglacial sandur delta: Cyclic steps from river-derived underflows?: Journal of Sedimentary Research, v. 86, p. 113–123, https:// doi .org /10 .2110 /jsr .2016 .4.
Fildani, A., Normark, W.R., Kostic, S., and Parker, G., 2006, Channel formation by flow stripping: Large-scale scour features along the Monterey East Chan-nel and their relation to sediment waves: Sedimentology, v. 53, p. 1265–1287, https:// doi .org /10 .1111 /j .1365 -3091 .2006 .00812 .x.
Fildani, A., Hubbard, S.M., Covault, J.A., Maier, K.L., Romans, B.W., Traer, M.T., and Rowland, K.C., 2013, Erosion at inception of deep-sea channels: Marine and Pe-troleum Geology, v. 41, p. 48–61, https:// doi .org /10 .1016 /j .marpetgeo .2012 .03 .006. Hughes Clarke, J.E., Marques, C.R.V., and Pratomo, D., 2014, Imaging active mass-wasting and sediment flows on a fjord delta, Squamish, British Colum-bia, in Krastel, S., ed., Submarine Mass Movements and Their Consequences: Advances in Natural and Technological Hazards Research, v. 37, p. 249–260,
https:// doi .org /10 .1007 /978 -3 -319 -00972 -8_22.
Hughes Clarke, J.E., 2016, First wide-angle view of channelized turbidity currents links migrating cyclic steps to flow characteristics: Nature Communications, v. 7, p. 11896, https:// doi .org /10 .1038 /ncomms11896.
Kane, I., and Hodgson, M.D., 2015, Supercritical-flow structures on a Late Carbon-iferous delta front: Sedimentologic and paleoclimatic significance: Comment: Geology, v. 43, p. e374, https:// doi .org /10 .1130 /G37231C .1.
Kostic, S., and Parker, G., 2006, The response of turbidity currents to a canyon–fan tran-sition: Internal hydraulic jumps and depositional signatures: Journal of Hydraulic Research, v. 44, p. 631–653, https:// doi .org /10 .1080 /00221686 .2006 .9521713. Kostic, S., 2011, Modelling of submarine cyclic steps: Controls on their
forma-tion, migraforma-tion, and architecture: Geosphere, v. 7, p. 294–304, https:// doi .org /10 .1130 /GES00601 .1.
Lang, J., and Winsemann, J., 2013, Lateral and vertical facies relationships of bedforms deposited by aggrading supercritical flows: From cyclic steps to humpback dunes: Sedimentary Geology, v. 296, p. 36–54, https:// doi .org /10.1016 /j .sedgeo .2013 .08 .005.
Lang, J., Brandes, C., and Winsemann, J., 2017, Erosion and deposition by super-critical density flows during channel avulsion and backfilling: Field examples from coarse-grained deepwater channel-levée complexes (Sandino Forearc Basin Southern Central America): Sedimentary Geology, v. 349, p. 79–102, https:// doi .org /10 .1016 /j .sedgeo .2017 .01 .002.
Migeon, S., Savoye, B., Zanella, E., Mulder, T., Faugeres, J.-C., and Weber, O., 2001, Detailed seismic-reflection and sedimentary study of turbidite sediment waves on the Var Sedimentary Ridge (SE France): Significance for sediment transport and deposition and for the mechanisms of sediment-wave construc-tion: Marine and Petroleum Geology, v. 18, p. 179–208, https:// doi .org /10.1016 /S0264 -8172 (00)00060 -X.
Ono, K., and Björklund, P.P., 2017, Froude supercritical flow bedforms in deepwater slope channels? Field examples in conglomerates, sandstones and fine-grained deposits: Sedimentology, v. 65, p. 639–669, https:// doi .org /10 .1111 /sed .12396. Paull, C.K., Caress, D.W., Ussler, W., Lundsten, E., and Meiner-Johnson, M., 2011, High-resolution bathymetry of the axial channels within Monterey and Soquel submarine canyons, offshore central California: Geosphere, v. 7, p. 1077–1101, https:// doi .org /10 .1130 /GES00636 .1.
Ponce, J.J., and Carmona, A.N., 2011, Coarse-grained sediment waves in hyper-pycnal clinoform systems, Miocene of the Austral foreland basin, Argentina: Geology, v. 39, p. 763–766, https:// doi .org /10 .1130 /G31939 .1.
Postma, G., and Cartigny, M.J.B., 2014, Supercritical and subcritical turbidity currents and their deposits-a synthesis: Geology, v. 42, p. 987–990, https:// doi .org /10 .1130 /G35957 .1.
Postma, G., Kleverlaan, K., Cartigny, M.J.B., and Mohrig, D., 2014, Recognition of cyclic steps in sandy and gravelly turbidite sequences, and consequences for the Bouma facies model: Sedimentology, v. 61, p. 2268–2290, https:// doi .org /10 .1111 /sed .12135.
Spinewine, B., Sequeiros, O., Garcia, M., Beaubouef, R., Sun, T., Savoye, B., and Parker, G., 2009, Experiments on wedge-shaped deep sea sedimentary deposits in minibasins and/or on channel levees emplaced by turbidity cur-rents, Part II, Morphodynamic evolution of the wedge and of the associated bedforms: Journal of Sedimentary Research, v. 79, p. 608–628, https:// doi .org /10 .2110 /jsr .2009 .065.
Sun, T., and Parker, G., 2005, Transportational cyclic steps created by flow over an erodible bed. Part 2: Theory and numerical simulation: Journal of Hydraulic Research, v. 43, p. 502–514, https:// doi .org /10 .1080 /00221680509500148. Sumner, E.J., Amy, L.A., and Talling, P.J., 2008, Deposit structure and processes
of sand deposition from decelerating sediment suspensions: Journal of Sedi-mentary Research, v. 78, p. 529–547, https:// doi .org /10 .2110 /jsr .2008 .062. Symons, W.O., Sumner, E.J., Cartigny, M.J.B., and Clare, M.A., 2016, Large-scale
sediment waves and scours on the modern seafloor and their implications for the prevalence of supercritical flow: Marine Geology, v. 371, p. 130–148, https:// doi .org /10 .1016 /j .margeo .2015 .11 .009.
Symons, W.O., Sumner, E.J., Paull, C.K., Cartigny, M.J.B., Xu, J.P., Maier, K.L., Lorenson, T.D., and Talling, P.J., 2017, A new model for turbidity current behavior based on integration of flow monitoring and precision coring in a sub-marine canyon: Geology, v. 45, p. 367–370, https:// doi .org /10 .1130 /G38764 .1. Vellinga, A.J., Cartigny, M.J.B., Eggenhuisen, J.T., and Hansen, E.W.M., 2017,
Morphodynamics and depositional signature of low-aggradation cyclic steps: New insights from a depth-resolved numerical model: Sedimentology, v. 65, p. 540–560, https:// doi .org /10 .1111 /sed .12391.
Ventra, D., Cartigny, M.J.B., Bijkerk, J.F., and Acikalin, S., 2015, Supercritical-flow structures on a late carboniferous delta front: Sedimentologic and paleoclimatic significance: Geology, v. 43, p. 731–734, https:// doi .org /10 .1130 /G36708 .1. Yokokawa, M., Okuno, K., Nakamura, A., Muto, T., Miyata, Y., and Naruse, H.,
2009, Aggradational cyclic steps: Sedimentary structures found in flume exper-iments: Vancouver, Canada, Proceedings of the 33rd International Association
for Hydro-Environment Engineering (IAHR) Congress, v. 81, p. 5547–5554.
Manuscript received 23 January 2018 Revised manuscript received 16 April 2018 Manuscript accepted 17 April 2018