© 2018 IJSRST | Volume 4 | Issue 2 | Print ISSN: 2395-6011 | Online ISSN: 2395-602X Themed Section: Science and Technology
A Statistical Study on Stress Management in Self-Financing
Engineering Colleges
Dr. S. Samraj
Assistant Professor, Department of Management Studies, CSI Institute of Technology, Thovalai, Tamil Nadu, India
ABSTRACT
Stress affects teaching faculty of these engineering institutions, and now-a-days engineering institutions face stress as a big problem. In the work environment stress occurs due to demand that exceeds the individuals’ coping ability, disrupting their psychological equilibrium. A clever understanding of the inter-relationship of the various facets of stress in an engineering institution offers the opportunity for the employers to develop efficient coping strategies to manage the stress level of the employees. There is a lack of extensive research on stress management of higher educational institutions. At the same time, there is an apparent lack of interest towards stress management among self-financing engineering institutions even today. Hence this study seeks to explore the stress management of teaching faculty in self-financing engineering institutions in Kanyakumari District of Tamil Nadu.
Keywords: Engineering College, Higher Education and Stress management.
I.
INTRODUCTION
The higher education sector in India has registered a phenomenal growth in recent years. Establishment of many private higher educational institutions has facilitated the growth. These institutions which offer different professional courses have together facilities to cater to the educational needs of an estimated 234 million people in the age group of 15-24. Indian higher education sector is one of the most promising sectors that offers a huge potential for the future. There are now about 19 million students enrolled in higher educational institutions in India. Stress is a term basically used in physical sciences, which means pressure of one object on another. From physical sciences, the term, stress, came to medical sciences and finally to social sciences. As per medical explanation, the term, stress, is the body’s general responses to environmental situations. In today’s life everyone is striving to manage stress. Stress management has become a hot topic for each and every human being in any given profession. There is a lack of extensive research on stress management of
higher educational institutions. At the same time, there is an apparent lack of interest towards stress management among self-financing engineering institutions even today. Hence this study seeks to explore the stress management of teaching faculty in self-financing engineering institutions in Kanyakumari District of Tamil Nadu.
II.
STATEMENT OF THE PROBLEM
the stress factors and they can succeed in their endeavour by understanding the impact of stress on them. The teaching faculty members face many problems in their institutions, homes and in personal lives, and such problems make them experience stress. Thus stress management of teaching faculty in self-financing engineering institutions assumes importance and so this study of stress management of teaching faculties in select engineering institutions in Kanyakumari District has been taken up.
III.
OBJECTIVES OF THE STUDY
To present a sound analytical framework of attitude, job satisfaction, and job involvement for the study of stress management.
To find out the extent of variation among the teaching faculty on their perception of the job-related factors with respect to stress management in self financing engineering institutions.
To offer suitable suggestions to engineering college teaching staff in the district of Kanayakumari to keep off stress.
IV.
SCOPE OF THE STUDY
There is now overwhelming evidence attesting to what many academics have known for years; academia is a highly stressful occupation. In fact, academics throughout the world deal with a substantial amount of ongoing occupational stress. This study is confined to self-financing engineering colleges in Kanyakumari district. The study is focused on the teaching faculties of self-financing engineering colleges.
V.
LIMITATIONS OF THE STUDY
The study is limited to Kanyakumari District only. Hence, the result may not be generalized for other geographical areas.
The respondents’ personal bias may be an uncontrollable factor.
Constraints on the time and convenience of the researcher in meeting the respondents directly.
VI.
METHODS AND MATERIALS
(i) Research design
Research design is the blueprint for descriptive research work that guides the researchers in a scientific way towards the achievement of the objectives. The research instrument used for this study was a self-administrated questionnaire that was circulated to teaching faculty respondents in the form of a survey, and the data collected in this way were the primary data for the analysis. In this phase, based on the review of literature, different questions have been employed to study the stress management of teaching faculty in self-financing engineering institutions in Kanyakumari district.
(ii) Population of the study
The area of this study has a representation of teaching faculty of self – financing engineering institutions in Kanyakumari district. The following table represents the population of the study. Since 3323 teachers are employed in the above engineering institutions, it was found quite unwieldy to select certain percentage of the population as the sample frame. So six engineering institutions were selected from the 31 institutions on the basis of systematic random sampling. Thus six engineering institutions that is 1 by 5th were selected as sample engineering institutions for analyzing stress management.
(iii) Construction of the research instruments
instruments which the researcher used to collect data for the descriptive study was questionnaire. The teaching faculty survey questionnaires comprise only close–ended questions for the purpose of generating statistical data and they use mainly the five-point likert scale which indicated the stress management in self-financing engineering institutions in Kanyakumari District.
(iv) Pilot study and pre-testing of questionnaire To determine the construct validity of the instrument, a pilot testing was conducted initially by administering the questionnaire on around 50 members of respondents. One hundred items were pre-tested for their clarity and relevance. The information on their stress was collected from the teaching faculty. The respondents were questioned on their issues relating to their demographic profile, regular working hours and impact of family pressures on their work, expectations from their work roles, to which extent they are satisfied by evaluating the individual initiatives and organization initiatives.
Alpha (Cronbach)
This is a model of internal consistency, based on the average inter-item correlation. The results are presented in suitable hypothesis with relevant interpretations.
Reliability Coefficients
No. of Cases = 50 No. of Items = 70
Alpha = 0.701 (i.e. 70.10%)
(v) Data collection
The primary data were collected by visiting the self-financing engineering institutions. The researcher has adopted systematic random sampling method to select the colleges and convenient non-random sampling method to select the teaching faculty for this study. Self-administrated questionnaires were circulated in the form of a survey to respondents. Overall, 665 teaching faculty samples were chosen from across
Kanyakumari District. The respondents were aware that participation in this survey was voluntary in nature and their responses would remain confidential and used for research purpose only.
(vi) Data analysis
In this study, the researcher has adopted quantitative data analysis. Quantitative data analysis is the process of presenting and interpreting numerical data. Questionnaire method of data analysis can be of great value to the researchers who attempt to draw meaningful results from large body of qualitative data.
a. Chi-square Analysis
The Chi square test was used in this study on social science and management for testing the independence of two attributes. It was used to identify the factors influencing the job stress among the teaching faculty members in self-financing engineering institutions.
b. Cluster Analysis
This procedure attempts to identify relatively homogeneous groups of cases based on select characteristics, using an algorithm that can handle large numbers of cases.
VII.
ANALYSIS AND INTERPRETATIONS
a. Chi-square Analysis
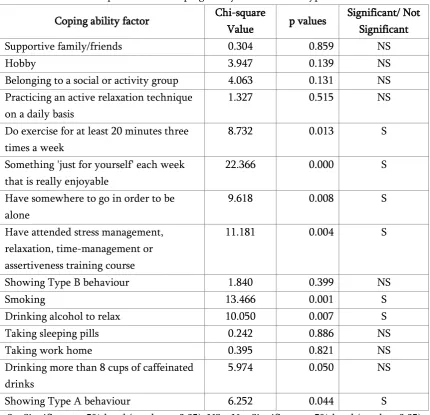
The results are presented with suitable hypothesis and relevant interpretations. The study factor ‘Type A behaviour’ considered here.
Table 1. Chi Square values - Coping ability factors verses ‘type A behaviour’ Coping ability factor Chi-square
Value p values
Significant/ Not Significant
Supportive family/friends 0.304 0.859 NS
Hobby 3.947 0.139 NS
Belonging to a social or activity group 4.063 0.131 NS Practicing an active relaxation technique
on a daily basis
1.327 0.515 NS
Do exercise for at least 20 minutes three times a week
8.732 0.013 S
Something 'just for yourself' each week that is really enjoyable
22.366 0.000 S
Have somewhere to go in order to be alone
9.618 0.008 S
Have attended stress management, relaxation, time-management or assertiveness training course
11.181 0.004 S
Showing Type B behaviour 1.840 0.399 NS
Smoking 13.466 0.001 S
Drinking alcohol to relax 10.050 0.007 S
Taking sleeping pills 0.242 0.886 NS
Taking work home 0.395 0.821 NS
Drinking more than 8 cups of caffeinated drinks
5.974 0.050 NS
Showing Type A behaviour 6.252 0.044 S
S – Significant at 5% level (p value<= 0.05); NS – Not Significant at 5% level (p value>0.05)
It is found from the Table 1.1 that the hypothesis is rejected (Significant) in seven cases and in other cases the hypothesis is accepted (Not Significant). It is concluded that doing exercise for at least 20 minutes three times a week, doing something 'just for yourself' each week that is really enjoyable, having somewhere to go in order to be alone, having attended stress-management, relaxation, time-management or assertiveness training course, smoking, drinking alcohol to relax and showing Type A behaviour have significant influence on the stress management of teaching faculty.
b. Cluster analysis
This procedure attempts to identify relatively homogeneous groups of cases based on selected characteristics, using an algorithm that can handle large numbers of cases. However, the algorithm requires specifying the number of clusters. We can specify initial cluster centres if we know this information. In this study, this technique is carried out based on the socio-economic variables and study factor ‘level of signs and symptoms of stress’.
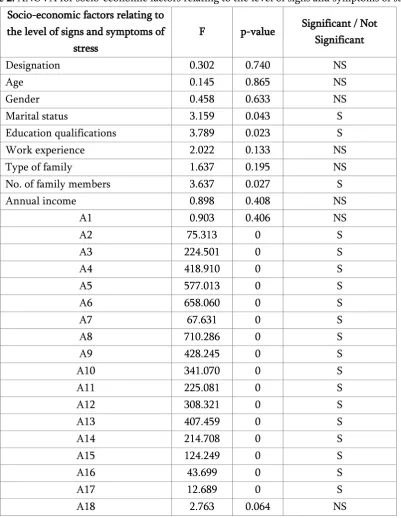
The Table 1.2 describes the results of ANOVA for each socio-economic classification on the level of
signs and symptoms of stress considered.
Table 2. ANOVA for socio-economic factors relating to the level of signs and symptoms of stress Socio-economic factors relating to
the level of signs and symptoms of stress
F p-value Significant / Not Significant
Designation 0.302 0.740 NS
Age 0.145 0.865 NS
Gender 0.458 0.633 NS
Marital status 3.159 0.043 S
Education qualifications 3.789 0.023 S
Work experience 2.022 0.133 NS
Type of family 1.637 0.195 NS
No. of family members 3.637 0.027 S
Annual income 0.898 0.408 NS
A1 0.903 0.406 NS
A2 75.313 0 S
A3 224.501 0 S
A4 418.910 0 S
A5 577.013 0 S
A6 658.060 0 S
A7 67.631 0 S
A8 710.286 0 S
A9 428.245 0 S
A10 341.070 0 S
A11 225.081 0 S
A12 308.321 0 S
A13 407.459 0 S
A14 214.708 0 S
A15 124.249 0 S
A16 43.699 0 S
A17 12.689 0 S
A18 2.763 0.064 NS
Source: Primary Data
From the above Table 1.2, we conclude that maximum of the variables influence the clusters excluding the variables such as designation, age, gender, work experience, type of family, annual income , easily irritated by people or trivial event (A1) and feel tired most of the time (A18) in the stress management of
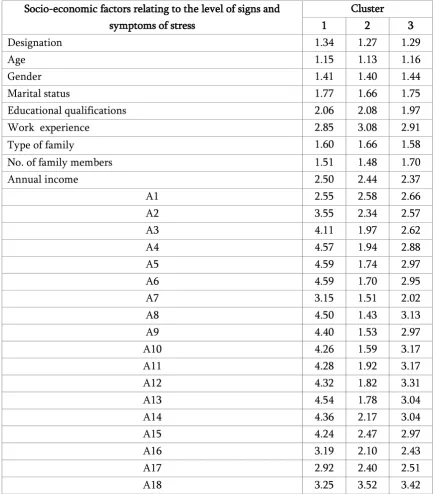
Table 3. Final cluster centres for socio-economic factors relating to the level of signs and symptoms of stress Socio-economic factors relating to the level of signs and
symptoms of stress
Cluster
1 2 3
Designation 1.34 1.27 1.29
Age 1.15 1.13 1.16
Gender 1.41 1.40 1.44
Marital status 1.77 1.66 1.75
Educational qualifications 2.06 2.08 1.97
Work experience 2.85 3.08 2.91
Type of family 1.60 1.66 1.58
No. of family members 1.51 1.48 1.70
Annual income 2.50 2.44 2.37
A1 2.55 2.58 2.66
A2 3.55 2.34 2.57
A3 4.11 1.97 2.62
A4 4.57 1.94 2.88
A5 4.59 1.74 2.97
A6 4.59 1.70 2.95
A7 3.15 1.51 2.02
A8 4.50 1.43 3.13
A9 4.40 1.53 2.97
A10 4.26 1.59 3.17
A11 4.28 1.92 3.17
A12 4.32 1.82 3.31
A13 4.54 1.78 3.04
A14 4.36 2.17 3.04
A15 4.24 2.47 2.97
A16 3.19 2.10 2.43
A17 2.92 2.40 2.51
A18 3.25 3.52 3.42
It reveals that the samples are classified into 3 heterogeneous groups with respect to socio-economic factors relating to the level of signs and symptoms of stress. The first cluster teaching faculty members are grouped based on their opinion relating to high level of signs and symptoms of stress and they fall under the umbrella of designation (Assistant Professor), age (below 30), gender (male), marital status ( unmarried), educational qualifications (PG degree), work experience (1-3 years), type of family (nuclear)
members in the family (4 members), annual family income (2-3 lakh) and this group has signs and symptoms of stress almost all the time.
work experience (3-5 years), type of family (nuclear), members in the family (less than 3), annual family income (1-2 lakh) and this group has signs and symptoms of stress some time.
The final cluster teaching faculty members are grouped based on their opinion relating to low level of signs and symptoms of stress and they fall under the umbrella of designation (Assistant Professor), age (below 30), gender (male), marital status (unmarried), educational qualification (PG degree), work experience (3-5 years), type of family (joint) members in the family (four members), annual family income (1-2 lakh) and this group has signs and symptoms of stress most of the time.
VIII.
CONCLUSION
The present condition of the teaching faculty is conducive and it helps enrich the coping behaviour of teaching faculty and enhance to uplift the engineering institutions and teaching faculty together to conquer the sky. If all the suggestions are properly carried out by the teaching faculty and the engineering institutions then the stress level of the teaching faculty will definitely come down which may result in organizational growth and will create a healthy organizational climate.
IX.
REFERENCES
[1].Dewe P, Cox T and Ferguson E (1993). 'Individual strategies for coping with stress at work: A review', Work & Stress, 7(1), pp.5-15.
[2].Fisher, A. (1994). 'Stress in academic life. Bukingham', UK: Open University press.
[3].Viner, R (1999). 'An international review of research in the social dimensions of science and technology. Social studies of science', 29(3), pp.391-399.
[4].Cooper, c., U. Rout and B. Faragher (1989). 'Mental Health, Job Satisfaction, and Job General Practitioners', B Medical Journal, 298.