IJSRR, 8(2) April. – June., 2019 Page 383
Research article Available online www.ijsrr.org
ISSN: 2279–0543
International Journal of Scientific Research and Reviews
Development and Validation of Stability Indicating Assay Method for
Estimation of Tofacitinib in Tofacitinib Citrate Immediate Release
Tablet Dosage Form
Chirag. J. Patel*
1, Shivani Panchal
2and Digesh Patel
31,2
Department of Pharmaceutical Quality Assurance, Shree Swaminarayan Sanskar Pharmacy College, Zundal, Gandhinagar, Gujarat, India.
3
Zydus Cadila Healthcare Ltd, Moraiya, Gujarat, India.
ABSTRACT:
A simple, precise and accurate stability indicating RP-HPLC method for estimation of
Tofacitinib form Tofacitinib citrate immediate release tablet dosage form was developed &
subsequently validated. Tofacitinib was separated and estimated using Agilent RP-HPLC 1200
series, UV detector. Chromatographic separation was achieved in Isocratic mode with Inertsil ODS-
3V (150mm * 4.6mm I.D, particle size 5 µm) column. The mobile phase used was phosphate buffer
(pH 5.0): Acetonitrile in the ratio of 65:35 % v/v. The elution of analyte was achieved with the flow
rate of 1.0 ml/min and run time of 7 min. Detection was carried out at the wavelength of 287 nm.
The different HPLC parameters were optimized & method was validated according to standard ICH
guideline. Forced degradation study was carried out by exposing Tofacitinib for acid, alkali,
oxidative, thermal & photolytic stress conditions. Retention time of Tofacitinib was found to be
3.292 min. The detector response was linear in the concentration range of 19.85µg/ml –
158.831µg/ml. The results show that Tofacitinib & other degradation products were fully resolved &
thus the proposed method is stability indicating.
KEYWORDS:
Tofacitinib, RP-HPLC, Stability indicating, Validation* Corresponding Author
Dr. Chirag. J. Patel
Professor & PrincipalShree Swaminarayan Sanskar Pharmacy College,
Zundal, Gandhinagar-382421, Gujarat, India
IJSRR, 8(2) April. – June., 2019 Page 384
INTRODUCTION:
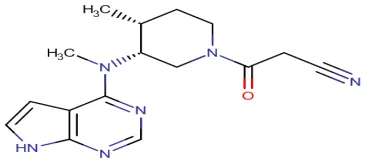
Tofacitinib is chemically 3-[(3R,4R)-4-methyl-3-[methyl({7H
pyrrolo[2,3-d]primidin-4-yl})amino ]piperidin -1-yl]-3-oxoprpanenitrile used in the treatment of Rheumatoid Arthritis patients
who have inadequate response with Methotraxate.
The molecular formula of Tofacitinib is C16H20N6O with the molecular weight of 312.3696
g/mol. Tofacitinib is reversible and partial janus kinase inhibitor that prevents the phosphorylation
and activation of STATs pathway and decrease inflammatory response.1-2
Tofacitinib is not official in Indian United States and European Pharmacopoiea. Literature
survey reveals that only few analytical methods are reported for analysis of drug. There is no
stability indicating analytical method was reported for estimation of Tofacitinib from Tofacitinib
citrate immediate release tablet dosage form.3-6
Therefore, it was thought of interest to develop precise, accurate, sensitive, selective
chromatographic method for estimation of Tofacitinib form Tofacitinib citrate immediate release
tablet dosage form which will provide valuable information that can be used to assess the inherent
stability of the drug under various stressed conditions, eventually to improve formulation and
manufacturing process. The aim of work was to carry out RP-HPLC method development and
validation for estimation of Tofacitinib from Tofacitinib citrate immediate release tablet dosage
form.7-8
Figure 1: Chemical structure of Tofacitinib
MATERIALS AND METHODS:
In the present research work Acetonitrile and Potassium dihydrogen phosphate monohydrate
were used of Merck Life science, Methanol and 1- Octane sulphonic acid sodium salt monohydrate
were used of Spectrochem Pvt. Ltd. Potassium hydroxide was used of Sigma Aldrich. The sample of
Tofacitinib API and Tablets were kindly gifted by ZYDUS CADILA HEALTHCARE, Moraiya,
IJSRR, 8(2) April. – June., 2019 Page 385
Equipment
The analysis was performed on HPLC Agilent technologies 1200 series, Isocratic mode,
Photodiode array detector, injector of 100 µL loop volume. Intertsil ODS-3V (150mm * 4.6mm, 5
µm) columnwhich is maintained at 40 ºC temperature. Chromeleon software was used for data
collecting and processing.
Preparation of 5.0 pH phosphate buffer
Weigh 2.72 gm of Potassium dihydrogen phosphate and 1 gm of 1- Octane sulphonic acid
sodium salt monohydrate and dissolve in 1000 ml Milli Q water, adjust pH 5.0 with diluted
Potassium hydroxide solution.
Preparation of mobile phase
Prepare the mixture of Phosphate Buffer and Acetonitrile in the volume ratio of 65:35 % v/v
and sonicate for degassing. Filter through 0.45 µ Millipore filter.
Diluent
Water and Acetonitrile is used in the ratio of 50:50 % v/v as diluent.
Preparation of standard stock solution (100ppm)
Transfer an accurately weighed quantity of 80.8 mg of Tofacitinib citrate (Eq. to 50 mg of
Tofacitinib) API to a 50ml volumetric flask, add about 35ml of diluent and sonicate to dissolve.
Make up the volume upto the mark with diluent and mix dilute 5.0ml of above solution to 50ml with
diluent and mix.
As such sample solution (100ppm)
[Label claim: 5 mg]
Weigh accurately 20 tablets and calculate the average weight. Weight 10 intact tablets and
transfer into 500 ml of volumetric flask. Add 300 ml of diluent and sonicate with occasional shaking
for 45 mins. Make volume upto mark with diluent.
Filter the solution through 0.22 µm Millipore PVDF filter; collect the filtrate by discarding first 5 ml
of filtrate.
Chromatographic conditions
Inertsil ODS- 3V (150mm * 4.6mm, 5 µm) column was used as stationary phase. Phosphate
buffer (5.0 pH) and Acetonitrile were used in the ratio of 65:35 % v/v as Mobile phase. It was
IJSRR, 8(2) April. – June., 2019 Page 386
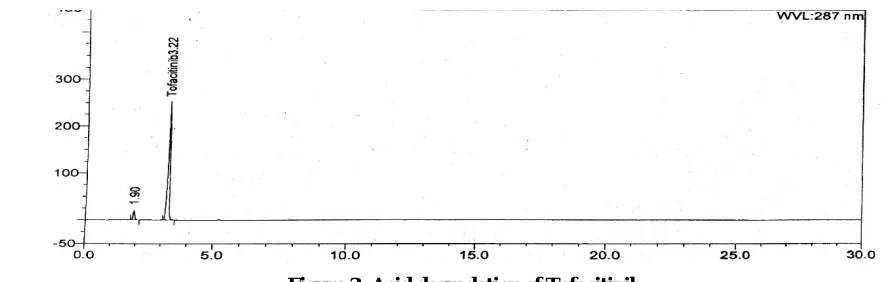
ml/min. The eluent was monitored at 287 nm. The injection volumes of sample and standard were 10
µL (micro liter). Total run time is 7 min.
Figure 2: Chromatogram of Tofacitinib
The developed method was validated for linearity, precision, accuracy, robustness and is
applied for forced degradation studies as per ICH guidelines.
RESULT AND DISCUSSION:
Method Development
ICH prescribed stress conditions such as acid, alkali, oxidative, thermal and photolytic
stresses were carried out.
Acid Degradation
Sample preparation
20 ml reconstituted solution transfer into 100 ml volumetric flask, Add approx. 50 ml of
diluent and sonicate for 10 mins, add 5 ml of 1 N HCl and heat for 2 hours on boiling water bath at
110 C for acid hydrolysis. Then the solution was neutralized with 1N NaOH and made volume upto
mark with diluent. Then pipette out 5 ml of solution in 50 ml volumetric flask and make volume upto
mark with diluent.
IJSRR, 8(2) April. – June., 2019 Page 387
Alkali Degradation
Sample preparation
20 ml reconstituted solution transfer into 100 ml volumetric flask, Add approx. 50 ml of
diluent and sonicate for 10 mins, add 5 ml of 1N NaOH and heat for 5 mins on Room Temperature
for Alkali hydrolysis. Then the solution was neutralized with 1N HCl and made volume upto mark
with diluent. Then pipette out 5 ml of solution in 50 ml volumetric flask and make volume upto mark
with diluent.
Figure 4: Alkali degradation of Tofacitinib
Oxidative Degradation
Sample preparation
20 ml reconstituted solution transfer into 100 ml volumetric flask, Add approx. 50 ml of
diluent and sonicate for 10 mins, add 5 ml of 5% H2O2 and heat for 30 mins on Boiling water bath.
Then pipette out 5 ml of solution in 50 ml volumetric flask and make volume upto mark with diluent.
Figure 5: Oxidative degradation of Tofacitinib
Thermal Degradation
Sample preparation
1 vial kept at 100 C for 5 days, reconstitute vial with 19 ml water and transfer in 100 ml
volumetric flask, make up the volume with diluent. Pipette out 5 ml of solution in 50 ml volumetric
IJSRR, 8(2) April. – June., 2019 Page 388 Figure 6: Thermal degradation of Tofacitinib
Photolytic Degradation
Sample preparation
1 vial kept into UV chamber for 22 hours, reconstitute vial with 19 ml water and transfer in
100 ml volumetric flask, make up the volume with diluent. Pipette out 5 ml of solution in 50 ml
volumetric flask and make volume upto mark with diluent.
Figure 7: Photolytic degradation of Tofacitinib
Table 1: Degradation summary Sr. No. Stress Condition Duration Area after
Degradation
% Degradation
% Mass Balance
1 Acid Hydrolysis
(1N HCl)
110ºC for 2 hour
791930 8.4 97.2
2 Base Hydrolysis
(1N NaOH)
R.T for 5 mins
783285 9.4 94.85
3 Peroxide
Degradation
(5 % H2O2)
110ºC for 30 mins
837751 3.1 98.68
4 Thermal
Degradation
100ºC for 5 days
825649 4.5 96.46
5 Photolytic
degradation
UV chamber for 22 hours
IJSRR, 8(2) April. – June., 2019 Page 389
Method Validation
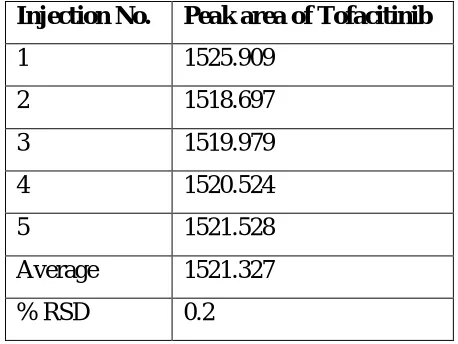
System suitability/ System precision
System suitability and precision was demonstrated by making five replicate injections as per
the test method. The peak area of analyte for replicate injection was recorded. The theoretical plates
and tailing factor were evaluated for the analyte peak.
Standard Sample Preparation (100 ppm)
Transfer an accurately weighed quantity of 80.8 mg of Tofacitinib citrate (Eq. to 50 mg of
Tofacitinib) API to a 50ml volumetric flask, add about 35ml of diluent and sonicate to dissolve.
Make up the volume upto the mark with diluent and mix dilute 5.0ml of above solution to 50ml with
diluent and mix.
Table 2: System suitability/ system precision parameter
Injection No. Peak area of Tofacitinib
1 1525.909
2 1518.697
3 1519.979
4 1520.524
5 1521.528
Average 1521.327
% RSD 0.2
Theoretical plates of Tofacitinib peak : 4026
Tailing factor of the Tofacitinib peak : 1.2
% RSD for five replicates standard injections is not more than 2 %.
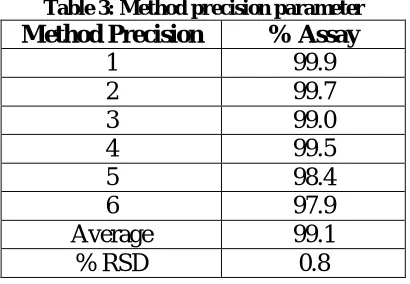
Method Precision
Method precision was demonstrated by preparing six samples as per the test method
representing a single batch. The assay of these samples was determined and the precision and the
precision of method was evaluated by computing the percentage relative standard deviation of assay
IJSRR, 8(2) April. – June., 2019 Page 390 Table 3: Method precision parameter
Method Precision % Assay
1 99.9
2 99.7
3 99.0
4 99.5
5 98.4
6 97.9
Average 99.1
% RSD 0.8
Acceptance criteria
% RSD for assay of six preparations should not more than 2.0.
Sonication Time optimization
Three sample dilution were made as per the proposed test methods, sonicate the above three
preparations for different time period namely 30 minutes and 45 minutes and 60 minutes after adding
a suitable quantity of diluent. After completion of sonication they were suitably diluted and the assay
of these samples were determined.
Table 4: Sonication time optimization parameter
Sonication time % Assay
30 min 98.8
45 min 99.2
60 min 99.0
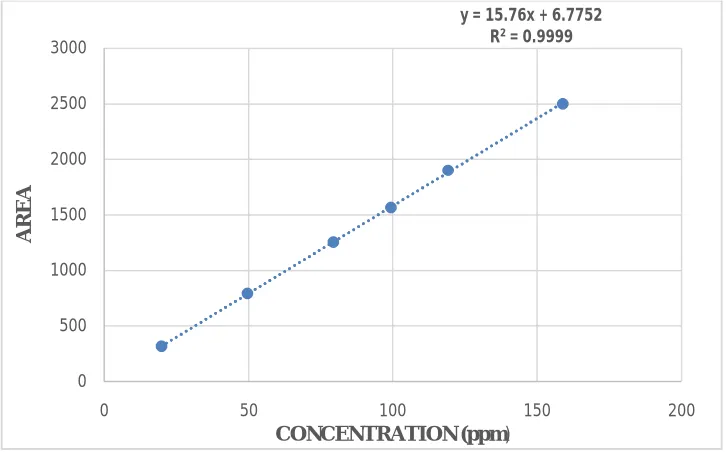
Linearity
The linearity of detector response for Tofacitinib was demonstrated by preparing solutions of
Tofacitinib working standard over the range of 20- 160 % of standard concentrations. These
solutions were injected into the HPLC system and the area of analyte peak was recorded. A graph of
concentration vs. analyte peak response was plotted. The concentration co efficient between
concentration & analyte peak response and Y- intercept of the correlation plot was evaluated.
Table 5: Linearity parameter
Linearity Level (%) Conc. Of Tofacitinib (µg/ml) Peak area of analyte
20 19.854 316.913
50 49.6351 791.376
80 79.416 1253.631
100 99.270 1567.910
120 119.123 1901.669
IJSRR, 8(2) April. – June., 2019 Page 391 Figure 8: A graph of concentration vs. analyte peak response
The plot was found to be linear with a correlation co efficient of for Tofacitinib 0.9999 with
respect to 100% linearity level response.
Accuracy
The accuracy of the test method was demonstrated by preparing recovery samples (i.e.
spiking of placebo with known quantities of API at the level of 50%, 100%,150% of target
concentration. The recovery samples were prepared in duplicate. The above samples were
chromatograph and the percentage recovery for amount added was estimated. The precision of the
recovery was determined by computing the relative standard deviation of duplicate recovery results.
Table 6: Accuracy parameter Recovery at 50 % level
Sample No. Amount added (mg) Amount recovered (mg)
% Recovery
1 25.19 25.37 100.7
2 25.38 25.46 100.3
Average 100.5
% RSD 0.3
Recovery at 100 % level
Sample No. Amount added (mg) Amount recovered (mg)
% Recovery
1 49.88 49.71 99.7
2 49.88 49.69 99.6
Average 99.7
% RSD 0.3
y = 15.76x + 6.7752 R² = 0.9999
0 500 1000 1500 2000 2500 3000
0 50 100 150 200
A
R
EA
IJSRR, 8(2) April. – June., 2019 Page 392 Recovery at 150 % level
Sample No. Amount added (mg) Amount recovered (mg)
% Recovery
1 73.40 73.16 99.7
2 73.50 73.25 99.7
Average 99.7
% RSD 0.0
Acceptance criteria
The recovery is 98- 102 % and the RSD is NMT 2 %.
Filter compatibility & saturation
The filter paper saturation was verified by preparing the assay samples with optimized
samples preparation and analyzed the samples by discarding different volume of analyte. The assay
of these samples was determined. Different filters are used. Here the filters are used are as follows,
Millipore PVDF (0.22 µm), Millipore Nylon (0.22 µm), Whatman GMF PVDF (0.45 µm).
Table 7: Filter compatibility and saturation parameter Millipore PVDF (0.22 µm)
Discarded volume % of Tofacitinib % Difference
Unfiltered 99.4 -
After 1 ml 97.6 1.8
After 2 ml 97.8 1.6
After 3 ml 98.0 1.4
After 5 ml 98.7 0.7
After 7 ml 97.9 1.5
Millipore Nylon (0.22 µm)
Discarded volume % of Tofacitinib % Difference
Unfiltered 99.4 -
After 1 ml 98.9 0.5
After 2 ml 98.3 1.0
After 3 ml 98.9 0.5
After 5 ml 99.1 0.2
After 7 ml 98.9 0.4
Whatman GMF PVDF (0.45 µm)
Discarded volume % of Tofacitinib % Difference
Unfiltered 99.4 -
After 1 ml 98.6 0.7
After 2 ml 98.4 0.9
After 3 ml 98.8 0.6
After 5 ml 98.9 0.4
After 7 ml 98.8 0.5
IJSRR, 8(2) April. – June., 2019 Page 393
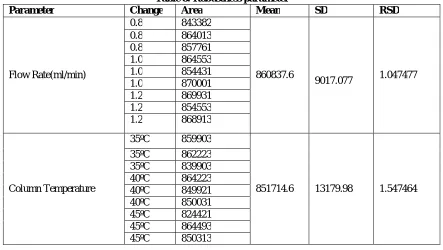
Robustness
According to Robustness, there is minor but deliberate change made in chromatographic
parameter with reference of Floe rate and column temperature. To observe robustness, 100% level
solution is used.
Table 8: Robustness parameter
Parameter Change Area Mean SD RSD
Flow Rate(ml/min)
0.8 843382
860837.6
9017.077 1.047477
0.8 864013
0.8 857761
1.0 864553
1.0 854431
1.0 870001
1.2 869931
1.2 854553
1.2 868913
Column Temperature
35ºC 859903
851714.6 13179.98 1.547464
35ºC 862223
35ºC 839903
40ºC 864223
40ºC 849921
40ºC 850031
45ºC 824421
45ºC 864493
45ºC 850313
CONCLUSION:
Stability Indicating RP-HPLC method has been developed and validated for the estimation of
Tofacitinib from Tofacitinib citrate immediate release tablet dosage form. The methods are found to
be specific as there was no interference of any co-eluting impurities after degradation study. The
degraded products are well resolved, indicating the method can also be useful for determination of
degraded products.
All the parameters and results are found within the acceptance limit as given in the validation
protocol. So, we can conclude that developed RP-HPLC method is found to be specific, linear,
accurate and robust. Therefore, method is to be specific with good resolution. Thus, the proposed
method can be used in pharmaceutical analysis for forced degradation study and routine quality
control samples for Tofacitinib citrate immediate release tablet dosage form.
ACKNOWLEDGEMENT:
The authors are thankful to ZYDUS CADILA HEALTHCARE, Moraiya, Ahmedabad, for
providing all the facilities to complete the research work and for providing Tofacitinib API and
IJSRR, 8(2) April. – June., 2019 Page 394
REFERENCES:
1. Arthritis reviewed by Natalie Bulter, RD, LD on 14 August 2017 written by Brindles Lee
Macon & Lauren Reed Guy. https://www.healthline.com/health/arthritis#outlook
2. HD. Ramachandran. Rheumatoid arthritis. World Journal of Pharmacy & Pharmaceutical
sciences. 2014; 3(9): 1073-1106.
3. P.Naik, KB Chandra Sekhar. “A Novel Stability Indicating Chromatographic Method
Development and Validation For The Quantification of Tofacitinib In Pure And its Dosage
Form”. IOSR Journal of Applied Chemistry 2018; 11(2): 33-37.
4. SK Reddy Govind ab, Nagaraju CHVSA, Eshwaraiah SA, et al. “Stability Indicating HPLC
method for the quantification of Tofacitinib citrate and its related substances”. 2018;
6(2):11-19.
5. ASK. Sankar, P.Shanmugasundaram, B. Datchayani, et al. “Stress Degradation Studies and
Development of Validated Spectroscopic Assay Method for Determination of Tofacitinib in
Pure & Physical Admixtures”. Research J. Pharm & Tech. 2017; 10(1): 117-120.
6. ASK.Sakar, B.Datchayani, N.Balkumaran, et al. “Development of a validated Reverse phase
Liquid chromatographic Assay method for the determination of Tofacitinib in Pure form and in
Physical admixtures”. Research Journal of Pharmacy and Technology. 2017; 10(1): 223-226.
7. CJ. Patel, SS. Patel.”Method Development and Stability study by Chromatographic method for
Perampanel in API and Tablet Dosage From”. International Journal of Pharmaceutics & Drug
Analysis.2017; 5(7):1618-1632.
8. JD. Trivedi, CJ. Patel, “RP-HPLC Method Development and Validation of Macitentan with its
Known and Unknown Degradation Impurities in its Tablet Dosage Form”. International
Journal of Applied Pharmaceutics. 2018; 10(5): 81-89.
9. PR. Shankar, CH. Naga Navya, D Pallaviraj, et al. “A review on step by step Analytical
Method Validation”. IOSR Journal of Pharmacy. 2015; 5(10): 07-19.
10. N. Bhavana, PR. Likhitha, Hanumanth et al. “Design and Development of Stability Indicating
Assay Methods as per ICH Guidelines- A Review”. International Journal of Pharma and
Chemical Research. 2017;3(2):252-259.
11. T Rawat, IP Pandey. “Forced degradation studies for Drug Substances and Drug Products-
Scientific and Regulatory Considerations”. Journal of Pharmaceutical Sciences and Research.
IJSRR, 8(2) April. – June., 2019 Page 395
12. ICH Q1A (R2): “Stability testing of New Drug Substances and Products”. [online].
International Conference on Harmonization. 2005. Available from URL: www.ich.org.
13. ICH Q1B: “Stability testing, Photo stability testing of new drug substances and products”.
[online]. International Conference on Harmonization. 2005. Available from URL:
www.ich.org.
14. ICH Q6A Specifications: “Test procedures and acceptance criteria for new drug substances and
new drug products: chemical substances”. [online]. International Conference on