© 2015 IJSRST | Volume 1 | Issue 5 | Print ISSN: 2395-6011 | Online ISSN: 2395-602X Themed Section: Scienceand Technology
Comparison of L-moments of Probability Distributions for
Extreme Value Analysis of Rainfall for Estimation of
Peak Flood Discharge for Ungauged Catchments
N. Vivekanandan
Central Water and Power Research Station, Pune, Maharashtra, India
ABSTRACT
Estimation of Peak Flood Discharge (PFD) at a desired location on a river is important for planning, design and management of hydraulic structures. For ungauged catchments, rainfall depth becomes an important input in derivation of PFD. So, rainfall depth can be estimated through frequency analysis by fitting of probability distributions to the rainfall data. In this paper, the series of annual 1-day maximum rainfall derived from daily rainfall data recorded at Una district is used to estimate the 1-day maximum rainfall adopting six probability distributions. Method of L-moments is used for determination of parameters of distributions. Goodness-of-Fit tests viz., Chi-square and Kolmogorov-Smirnov are applied for checking the adequacy of fitting of probability distributions to the recorded data. Root Mean Square Error (RMSE) is used for the selection of most suitable probability distribution for estimation of rainfall. Based on GoF test results and RMSE values, the study identifies the Extreme Value Type-1 (EV1) is better suited distribution for rainfall estimation. By applying the procedures, as described in CWC guidelines, the 1-hour value of distributed rainfall is computed from the estimated 1-day maximum rainfall using EV1 distribution and adopted for computation of PFD for ungauged catchments. The study suggests the computed PFD from rational formula could be considered for design of flood protection measures for river Swan and its tributaries joining the Beas river basin, Himachal Pradesh
.
Keywords
:
Chi-square, Extreme Value, Kolmogorov-Smirnov, Mean Square Error, Rainfall, Peak FloodI.
INTRODUCTION
Estimation of Peak Flood Discharge (PFD) at a desired location on a river is important for planning, design and management of hydraulic structures such as dams, bridges, barrages and design of storm water drainage systems. These include different types of flood such as standard project flood, probable maximum flood and design basis flood. In case of large river basins, the hydrological and stream flow series of a significant duration are generally available. However, for ungauged catchments, more data is not available other than rainfall (NIH, 2011). The rainfall data is also of shorter duration and may pertain to a neighbouring basin. Rainfall depth thus becomes an important input in derivation of PFD (Singh et al., 2001). For arriving at such design values, Extreme Value Analysis (EVA) of rainfall is carried out.
Out of number of probability distributions, Exponential (EXP), Extreme Value Type-1 (EV1), Extreme Value
In the recent past, number of studies has been carried out by different researchers on adoption of probability distributions for Rainfall Frequency Analysis (RFA). Topaloglu (2002) reported that the frequency analysis of the largest, or the smallest, of a sequence of hydrologic events has long been an essential part of the design of hydraulic structures. Guevara (2003) carried out hydrologic analysis using probabilistic approach to estimate engineering design parameters of storms in Venezuela. Kumar and Chatterjee (2005) employed the LMO to define homogenous regions within 13 gauging sites of the north Brahmaputra region of India. Di Balldassarre et al. (2006) used the LMO for regionalization of annual precipitation in northern central Italy. Eslamian and Feizi (2007) carried out RFA using monthly maximum rainfall for an arid region in Isfahan Province (Iran) through LMO.
Gonzalez and Valdes (2008) applied LMO for regionalization of monthly rainfall in the Jucar River basin. Yurekli et al. (2009) found GEV and 3-parameter Log-Normal (LN3) distributions (using LMO) as the regional distribution functions for the daily maximum rainfall of Cekerec watershed, Turkey. Gubareva and
Gartsman (2010) analysed the extreme
hydrometeorological characteristics adopting GEV, GPA, LN3 and Pearson distributions through LMO. Badreldin and Feng (2012) carried out the regional RFA for the Luanhe Basin, Hebei-China by using LMO and Cluster Techniques. But there is no general agreement in applying particular distribution for RFA for different region or country. Moreover, when different distributional models are used for modelling of rainfall data series, a common problem that arises is how to determine which model fits best for a given set of data. This can be answered by formal statistical procedures involving Goodness-of-Fit (GoF) tests and diagnostic index; and the results are quantifiable and reliable.
Qualitative assessment is made from the plots of the recorded and estimated rainfall. For quantitative assessment on rainfall within in the recorded range, Chi-square (2
) and Kolmogorov-Smirnov (KS) tests are applied. A diagnostic index, say Root Mean Square
Error (RMSE) is used for the selection of most suitable probability distribution for estimation of rainfall. The objective of the paper is to compute PFD using rational formula for ungauged catchments of Beas River Basin (BRB) upstream of river Swan. The methodology adopted in EVA of rainfall using six probability distributions, estimation of PFD using rational formula, computation of GoF tests statistic and diagnostic index are briefly described in the ensuing sections.
II.
METHODOLOGY
LMO is analogous to the conventional moments but can be estimated linear combination of order statistics, i.e., by L-statistics. LMO is less subject to bias in estimation and approximate their asymptotic normal distribution more closely in finite samples.
Theoretical Description of LMO
Method of LMO is a modification of the probability weighted moments method explored by Hosking and Wallis (1993). Parameters of the distribution are estimated by equating the sample LMO (lr) with the
distribution of LMO (br). In practice, LMO must be
estimated from a finite sample. Let
NN ... N 2 N
1 R R
R be the ordered sample of size N.
The sample LMO is given by:
k r 0 k 2 k r 1 r b )! k r ( ) ! k ( )! k r ( ) 1 ( l … (1)
where, lr1is the r+1th sample moment and b is an k
unbiased estimator of k with
iN N 1 k i 1 k R ) k N )...( 2 N )( 1 N ( ) k i )...( 2 i )( 1 i ( N b … (2)
The first two sample LMOs are expressed by:
0 1 b
l and
l
2
2
b
1
b
0 … (3)
TABLE 1
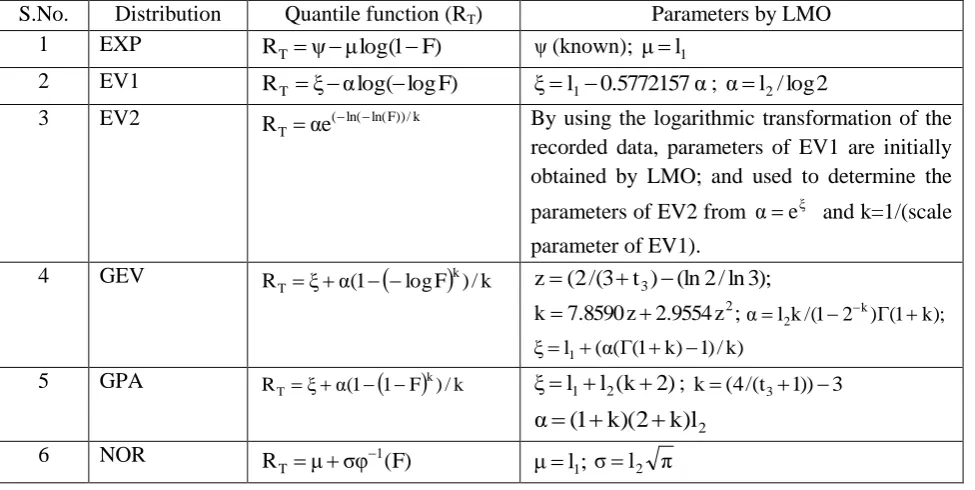
QUANTILE FUNCTION AND PARAMETERS OF SIX PROBABILITY DISTRIBUTIONS
S.No. Distribution Quantile function (RT) Parameters by LMO
1 EXP RTψμlog(1F) ψ (known); μl1
2 EV1 RT ξαlog(logF) ξl10.5772157α; αl2/log2
3 EV2 ( ln( ln(F))/k
T αe
R By using the logarithmic transformation of the
recorded data, parameters of EV1 are initially obtained by LMO; and used to determine the parameters of EV2 from αeξ and k=1/(scale parameter of EV1).
4 GEV RTξα(1
logF
k)/k z(2/(3t3)(ln2/ln3);; z 9554 . 2 z 8590 . 7
k 2 αl2k/(12 k)Γ(1k);
) k / ) 1 ) k 1 ( Γ ( α ( l
ξ 1
5 GPA RTξα(1
1F
k)/k ξl1l2(k2); k(4/(t31))32 l ) k 2 )( k 1 ( α
6 NOR R μ σφ 1(F)
T
μl1; σl2 π
In Table 1, F(R) (or F) is the cumulative distribution function (CDF) of R; P is the probability of exceedance;
1
is the inverse of the standard normal distribution
function and φ1ZP (P0.135(1P)0.135)/0.1975 ;
ξ,α , k are the location, scale and shape parameters
respectively; µ (or
R
), (or SR) and CS (or ) are theaverage, standard deviation and coefficient of skewness of the recorded rainfall data; sign(k) is plus or minus 1 depending on the sign of k ; RT is the estimated rainfall by probability distributions corresponding to return period T (in year).
Goodness-of-Fit Tests
GoF tests are essential for checking the adequacy of probability distributions to the series of recorded rainfall data. Out of a number GoF tests available, the widely accepted GoF tests are 2 and KS, which are used in the study. The theoretical descriptions of GoF tests statistic (Charles Annis, 2009) are as follows: 2 statistic:
NC 1 j j 2 j j 2 ) R ( E ) R ( E ) R ( O χ ... (4)where, Oj(R) is the observed frequency value of jth class, Ej(R) is the expected frequency value of jth class
rejection region of 2
statistic at the desired significance level () is given by 2
1 m NC , η 1 2 C χ
χ . Here, m denotes
the number of parameters of the distribution and χ is 2C the computed value of 2
statistic by PDF.
KS statistic:
e i D i
N
1
i F R F R Max
KS
... (5)
where, Fe
Ri M/(N1) is the empirical CDF of R i andFD
Ri is the computed CDF of R (Zhang, 2002). i Here, M is the rank assigned to each R . If the i computed values of GoF tests statistic given by the distribution are less than that of the theoretical values at the desired significance level () then the distribution is found to be acceptable for modelling the series of rainfall data.Diagnostic Index
The selection of most suitable distribution for estimation of rainfall is performed through diagnostic index, say RMSE, which is defined by:
RMSE =
N 1 i 2 * i i R R N 1 … (6)
Here, R is the recorded rainfall of ii th sample and R is *i
III.
APPLICATION
In this paper, a study on estimation of PFD for different return periods for 12 catchments of BRB upstream of river Swan is carried out. The estimated 1-day maximum rainfall obtained from the selected probability distribution through GoF tests and diagnostic index is considered as an input to estimate the PFD using CWC guidelines. The Annual 1-day Maximum Rainfall (AMR) recorded at Una district for the period of 20 years from 1995 to 2014, as presented in Figure 1, is used. The descriptive statistics such as average rainfall ( R ), standard deviation, coefficient of variation, Coefficient of Skewness (CS) and coefficient
of kurtosis of the recorded AMR are computed as 173.0 mm, 70.3 mm, 40.6 %, 0.885 and 0.378 respectively.
IV.
RESULTS AND DISCUSSIONS
By applying the procedures of LMO of six probability distributions, parameters were determined and used for
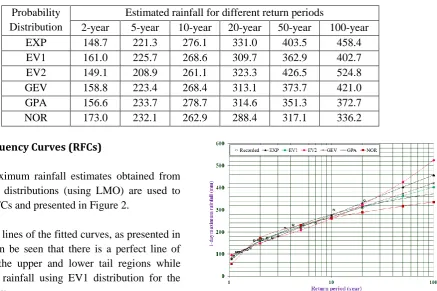
estimation of 1-day maximum rainfall for different return periods. Table 2 gives the 1-day maximum rainfall estimates for different return periods adopting six probability distributions. These estimates were used to develop the rainfall frequency curves and presented in Figure 2.
Figure 1: Times series plot of recorded AMR
TABLE 2
ESTIMATED 1-DAY MAXIMUM RAINFALL USING SIX PROBABILITY DISTRIBUTIONS
Probability Distribution
Estimated rainfall for different return periods
2-year 5-year 10-year 20-year 50-year 100-year
EXP 148.7 221.3 276.1 331.0 403.5 458.4
EV1 161.0 225.7 268.6 309.7 362.9 402.7
EV2 149.1 208.9 261.1 323.3 426.5 524.8
GEV 158.8 223.4 268.4 313.1 373.7 421.0
GPA 156.6 233.7 278.7 314.6 351.3 372.7
NOR 173.0 232.1 262.9 288.4 317.1 336.2
Rainfall Frequency Curves (RFCs)
The 1-day maximum rainfall estimates obtained from six probability distributions (using LMO) are used to develop the RFCs and presented in Figure 2.
From the trend lines of the fitted curves, as presented in Figure 2, it can be seen that there is a perfect line of agreement in the upper and lower tail regions while estimating the rainfall using EV1 distribution for the data under study.
Analysis Based on GoF Tests
For the present study, the degree of freedom (NC-m-1) is considered as one for 3-parameter distributions (GEV and GPA) and two for 2-parameter distributions (EXP,
EV1, EV2 and NOR) while computing the 2 statistic values for the data under study. The GoF tests results were computed from Eqs. (4) and (5), and given in Table 3.
TABLE 3
COMPUTED AND THEORETICAL VALUES OF GOF TESTS
Probability distribution
2 KS
Computed value
Theoretical value at 5% level
Computed value
Theoretical value at 5% level
EXP 2.000 5.990 0.149 0.294
EV1 2.000 5.990 0.090 0.294
EV2 4.000 5.990 0.163 0.294
GEV 2.000 3.841 0.091 0.294
GPA 2.500 3.841 0.099 0.294
NOR 4.000 5.990 0.120 0.294
From Table 3, it may be noted that the computed values of 2
and KS tests results obtained from six probability distributions are not greater than the theoretical values at 5% level of significance, and at this level, all six distributions are found to be acceptable for modelling the series of AMR recorded at Una district.
Analysis Based on Diagnostic Index
For the selection of most suitable probability distribution for estimation of rainfall, the diagnostic index, say RMSE values of six probability distributions are computed from Eq. (6) and given in Table 4.
TABLE 4
COMPUTED VALUES OF RMSE OF SIX PROBABILITY DISTRIBUTIONS
Data series
RMSE (mm) values using
EXP EV1 EV2 GEV GPA NOR Una 13.6 13.0 17.9 12.8 11.4 19.4
From Table 4, it may be noted that the RMSE values computed from GPA, GEV and EV1 distributions are the first, second and third minimum when compared to
the corresponding values of other probability distributions. But, from Figure 2, it can be seen that the rainfall estimates obtained from GPA and GEV distributions are not convincible in upper tail region when compared to the rainfall estimates of EV1 distribution.
By considering the trend lines of the fitted curves by the probability distributions in the tail regions, it is identified that the EV1 is the most appropriate distribution for estimation of rainfall at Una district, which was also confirmed through GoF tests results.
Computation of Peak Flood Discharge
TABLE 5
CATCHMENT AREA OF DIFFERENT STREAMS
S.No. Name of catchment Area (km2) S.No. Name of catchment Area (km2)
1 Babchar Khad 3.750 7 Joh Khad 14.500
2 Raipur Khad 3.125 8 Bangi Khad 5.500
3 Mundwara Khad 4.625 9 Kothi Khad 7.250
4 Bhatoli Khad 4.375 10 Jhakhar Khad 12.250
5 Dangah Khad 7.250 11 Kohwali Khad 5.250
6 Pithripur Khad 12.000 12 Phakruwali Khad 3.750
In the absence of the short duration rainfall, say,1-hour, 2-hour, 3-hour, etc., the same was computed from estimated 1-day maximum rainfall by using conversion factors, as given in Central Water Commission (CWC) report entitled „Flood estimation report for Western Himalayas-Zone 7‟ (CWC, 1994). For the present study, the estimated 1-day maximum rainfall is multiplied with the factor of 0.425 to compute the 1-hour value of distributed rainfall and presented in Table 6.
TABLE 6
1-HOUR DISTRIBUTED RAINFALL FOR DIFFERENT RETURN PERIODS
1-hour distributed rainfall (I: mm) for 2-
year 5- year
10- year
20- year
50- year
100-year 68.4 95.9 114.2 131.6 154.2 171.1
The distributed 1-hour rainfall was used as input for computation of PFD as the catchment areas of different tributaries of BRB are in the range of 3.125 km2 to 14.5 km2.
These streams are ungauged and hence the PFD for ungauged catchments is computed by using rational formula, which is given below:
q = 0.278 * C I A … (7) where, q is peak discharge (m3/s), C is runoff coefficient, I is rainfall intensity (mm/hour) and A is catchment area (km2).
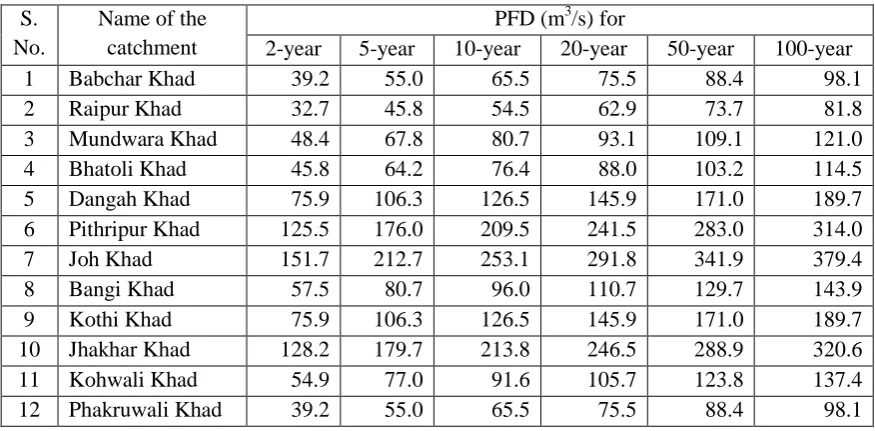
By considering topography of the river basin, the value of the C is considered as 0.55 while computing the PFD. The computed PFD for 12 catchments of BRB are presented in Table 7, which could be taken as design flood for the streams.
TABLE 7
PEAK FLOOD DISCHARGE (m3/s) FOR 12 CATCHMENTS OF BRB
S. No.
Name of the catchment
PFD (m3/s) for
2-year 5-year 10-year 20-year 50-year 100-year
1 Babchar Khad 39.2 55.0 65.5 75.5 88.4 98.1
2 Raipur Khad 32.7 45.8 54.5 62.9 73.7 81.8
3 Mundwara Khad 48.4 67.8 80.7 93.1 109.1 121.0
4 Bhatoli Khad 45.8 64.2 76.4 88.0 103.2 114.5
5 Dangah Khad 75.9 106.3 126.5 145.9 171.0 189.7
6 Pithripur Khad 125.5 176.0 209.5 241.5 283.0 314.0
7 Joh Khad 151.7 212.7 253.1 291.8 341.9 379.4
8 Bangi Khad 57.5 80.7 96.0 110.7 129.7 143.9
9 Kothi Khad 75.9 106.3 126.5 145.9 171.0 189.7
10 Jhakhar Khad 128.2 179.7 213.8 246.5 288.9 320.6
11 Kohwali Khad 54.9 77.0 91.6 105.7 123.8 137.4
V.
CONCLUSIONS
The paper describes briefly the study carried out for EVA of rainfall using a computer aided procedure for determination of parameters of six probability distributions (using LMO). The selection of most suitable distribution was evaluated by GoF tests (using 2
and KS) and diagnostic index (using RMSE). By using the maximum value of 1-hour distributed rainfall, runoff coefficient and catchment area of different streams, the PFD for 12 ungauged catchments of BRB were computed through rational formula. The following conclusions are drawn from the study:
i) The GoF tests results supported the use of all six probability distributions (using LMO) for modelling the series of AMR.
ii) Based on GoF tests results, diagnostic index and rainfall frequency curves, EV1 distribution was found to be most suitable distribution for estimation of 1-day maximum rainfall.
iii) The estimated 1-day maximum rainfall was used to compute 1-hour maximum value of distributed rainfall adopting CWC guidelines described in Flood estimation report for Western Himalayas-Zone 7.
iv) By using the 1-hour distributed rainfall, the PFD for 12 ungauged catchments of BRB upstream of river Swan was computed from rational formula.
v) The study suggested that the PFD, as given in Table 7, could be considered for design of flood protection measures for river Swan and its tributaries joining the BRB, Himachal Pradesh.
VI.
ACKNOWLEDGEMENTS
The author is grateful to Dr. S. K. Srivastava, Director In-charge, Central Water and Power Research Station (CWPRS), Pune, for providing the research facilities to carry out the study. The author is thankful to Dr. R. G. Patil, Scientist-D, CWPRS, for the supply of rainfall data.
VII. REFERENCES
[1] Badreldin, G.H.H. and Feng, P., Regional rainfall frequency analysis for the Luanhe Basin using L-moments and cluster techniques, International Conference on Environmental Science and Development, 5-7 January 2012, Hong Kong,
[2] Charles Annis, P.E., Goodness-of-Fit tests for statistical distributions, http://www.statistical engineering.com/ goodness.html], 2009.
[3] Central Water Commission (CWC), Flood estimation report for Western Himalayas-Zone 7, CWC Design Office Report No.: WH/22/1994, New Delhi, 1994.
[4] Di Balldassarre, G., Castellarin, A. and Brath, A., Relationships between statistics of rainfall extremes and mean annual precipitation: an application for design-storm estimation in northern central Italy, Hydrology and Earth System Sciences, 2006, Vol. 10, No. 2, pp. 589–601.
[5] Eslamian, S.S, and Feizi, H,, Maximum monthly rainfall analysis using L-Moments for an arid region in Isfahan Province, Iran, Applied Meteorology and Climatology, 2007, Vol. 46, No. 4, pp. 494-503.
[6] Gonzalez, J. and Valdes, J.B., A regional monthly precipitation simulation model based on an L-moment smoothed statistical regionalization approach, Journal of Hydrology, 2008, Vol. 348, No. 1, pp. 27-39.
[7] Gubareva, T.S. and Gartsman, B.I., Estimating distribution parameters of extreme hydrometeorological characteristics by L-Moment method, Water Resources, 2010, Vol. 37, No. 4, pp. 437–445.
[8] Guevara, E., “Engineering design parameters of storms in Venezuela”, Hydrology Days, pp. 80-91, 2003.
[9] Hosking, J.R.M, L-moments: Analysis and estimation of distributions using linear combinations of order statistics, Royal Statistical Society, Series-B, 1990, Vol. 52, No. 1, pp. 105-124.
[10] Hosking, J.R.M. and Wallis, J.R., Some statistics useful in regional frequency analysis”, Water Resources Research, 1993, Vol. 29, No. 2, pp. 271-281.
[11] Hosking, J.R.M. and Wallis, J.R., Regional frequency analysis: an approach based on L-moments, Cambridge University Press, 1997.
[12] Kumar, R. and Chatterjee, C., Regional flood frequency analysis using L-Moments for north Barhamputra region of India, Hydrologic Engineering, 2005, Vol. 10, No. 1, pp. 1–7. [13] National Institute of Hydrology (NIH), Technical note on
hydrological process in an ungauged catchment, 2011, pp. 1-163.
[14] Neslihan, S., Recep, Y., Tefaruk, H. and Ahmet, D., Comparison of probability weighted moments and maximum likeli-hood methods used in flood frequency analysis for Ceyhan river basin, Arabian Journal of Science and Engineering, 2010, Vol. 35, No. 1, pp. 49-69.
[15] Singh, R.D., Mishra, S.K. and Chowdhary, H., Regional flow duration models for 1200 ungauged Himalayan watersheds for planning micro-hydro projects, ASCE Journal of. Hydrologic Engineering, 2001, Vol. 6, No. 4, pp. 310-316. [16] Topaloglu, F., Determining suitable probability distribution
models for flow and precipitation series of the Seyhan River basin, Turkish Journal of Agriculture and Forestry, 2002, Vol. 26, No. 1, pp. 189 – 194.
[17] Yurekli, K., Modarres, R. and Ozturk, F., Regional daily maximum rainfall estimation for Cekerek Watershed by L-moments, Meteorological Applications, 2009, Vol. 16, No. 4, pp. 435-444.