Recommendations for using standardised
phenotypes in genetic association studies
Melissa G. Naylor,1*Scott T. Weiss2and Christoph Lange1
1Department of Biostatistics, Harvard University, Boston, MA, USA 2Channing Laboratory, Brigham and Women’s Hospital, Boston, MA, USA
*Correspondence to:Tel:þ1 617 432 4926; Fax:þ1 617 432 5619; E-mail: [email protected]
Date received (in revised form): 16th March 2009
Abstract
Genetic association studies of complex traits often rely on standardised quantitative phenotypes, such as percen-tage of predicted forced expiratory volume and body mass index to measure an underlying trait of interest (eg lung function, obesity). These phenotypes are appealing because they provide an easy mechanism for comparing subjects, although such standardisations may not be the best way to control for confounders and other covari-ates. We recommend adjusting raw or standardised phenotypes within the study population via regression. We illustrate through simulation that optimal power in both population- and family-based association tests is attained by using the residuals from within-study adjustment as the complex trait phenotype. An application of family-based association analysis of forced expiratory volume in one second, and obesity in the Childhood Asthma Management Program data, illustrates that power is maintained or increased when adjusted phenotype residuals are used instead of typical standardised quantitative phenotypes.
Keywords:body mass index, confounding factors, covariate adjustment, forced expiratory volume, heritable quantitative traits
Introduction
Failure to adjust for confounders and other covariates can greatly diminish the efficiency of genetic associ-ation studies. Traditional regression methods that control for confounders often apply directly to genetic association studies, and these techniques have been extended and adapted in settings where this is not the case.1–3 Despite this, researchers con-ducting genetic association studies of quantitative traits do not always take full advantage of their ability to adjust for important covariates.
Covariate adjustment is so crucial for traits like body mass index (BMI) and percentage of pre-dicted forced expiratory volume in one second (PPFEV) that they are standardised by definition. BMI (instead of weight) is used as a measure of obesity because height contributes noise to the
relationship between obesity and weight. Similarly, PPFEV, the amount of air a person can blow out in one second divided by the expected amount, given the person’s sex, height and, sometimes, other covariates, is used as a measure of lung func-tion instead of unadjusted forced expiratory volume (FEV) because sex, height and other cov-ariates add noise to the relationship between lung function and FEV. To determine expected FEV, various equations have been proposed, each a regression equation fit to a specific study popu-lation.4–6 Both BMI and PPFEV were developed to assess phenotypes in individuals when there are no population data available — for example, determining the severity of asthma or obesity during physical examination.
adjustment in association studies. Since genetic association studies have sample sizes large enough to adjust using the study population itself, it is no longer necessary to rely on standardisations based on external populations. It is especially important to adjust within the study population when the study population is clearly dissimilar to the general population. Consider a study popu-lation living at high altitude: using PPFEV with predicted FEV estimated based on a population dwelling at sea level could make even asthmatics seem healthy.
To determine whether researchers conducting genetic association studies of FEV actually adjust for confounders using the study population, we per-formed a literature search using PubMed. Of 26 genetic association studies with FEV as a main outcome published in the past three years, only 14 used within-study adjusted FEV.7 – 19 The 12 studies that did not mention within-study adjustment included one that stated, ‘No covariate adjustment was used since the percent-predicted lung function is already covariate adjusted’.20 – 31 The studies also varied as to what potential confounders were avail-able (for instance, many studies did not record height). Our literature search showed that there is no consensus on whether standardised phenotypes should be further adjusted.
We hypothesised that within-study adjustment of standardised quantitative phenotypes increases power in genetic association studies. To test this, we compared power obtained using PPFEV with and without within-study adjustment under both population- and family-based designs via simu-lation. We also examined the effects of applying within-study adjustment to raw FEV as opposed to PPFEV and of having an ascertainment condition. Finally, we applied the different methods to the Childhood Asthma Management Program (CAMP).
Materials and methods
Simulated genotypesTo simulate a family-based design, either 100, 400 or 800 independent trios (two parents and an
offspring) were generated. We assumed Hardy – Weinberg equilibrium and drew parental alleles from a binomial distribution with the probability of carrying the risk allele equal to allele frequency (0.05, 0.10 or 0.20). Offspring genotypes were then based on Mendelian transmission. We assumed there were no genotyping errors. For the simulated population-based design, only offspring genotypes were used.
Simulated raw phenotypes
Height, weight and age were generated using a multivariate normal distribution with means and covariances equal to those observed in a real dataset (CAMP). We restricted our samples to Caucasian males, to create a more homogeneous population to which a simple set of prediction equations would apply.
The primary unadjusted phenotype of interest, FEV, was generated in two ways: first with the relationship between FEV and its confounders based on that observed in real data, and, secondly, with the aim of determining what happens in the worst-case scenario for within-study adjustment — that is, when the FEV prediction equations really do describe the mean of the distribution of FEV. In the first case, FEV was simulated from a normal distribution with mean:
aXiþ1:522þ0:0271heightþ0:000197height2
þ0:0219ageþ0:00345weight
(where a is the additive genetic effect and Xi is the
number of copies of the allele of interest), and var-iance set equal to the varvar-iance of the residuals cal-culated when this model was fit to CAMP data. This model describes the relationship between height, age, weight and FEV in the CAMP study but with an additive genetic effect (heritability of FEV¼0.01, 0.025 or 0.05).32 The second way we generated FEV was similar, except that the model used to specify the mean and the variance of the
residuals was:
aXiþIðage , 12Þð2:814þ0:0348heightÞ þIðage 12Þð6:118þ0:0519height
þ0:0636 ageÞ
That is, we set the mean equal to the FEV pre-diction equation derived by Knudson et al. for Caucasian males.4 By simulating the data two ways, we can see how much within-study adjustment affects power under a realistic setting and also whether it diminishes power when it is unnecessary (ie when the FEV prediction equation explains the exact relationship between FEV and its confoun-ders). To examine the effect of phenotype trunca-tion, the simulations were repeated with an ascertainment condition, excluding all subjects with PPFEV80 per cent. (Final sample sizes were still 100, 400 and 800 trios.) This mimics the CAMP dataset, which includes only children with mild to moderate asthma.
Methods of adjustment and analysis
Four confounder-adjustment methods were applied to obtain four corresponding phenotypes used in genetic association testing: centred FEV, centred PPFEV, residuals from regressing FEV on relevant covariates and residuals from regressing PPFEV on relevant covariates. PPFEV was calculated using the prediction equations derived by Knudson et al.4
Population-based association testing was done by regressing phenotype on genotype, assuming an additive model and performing a Wald test to check whether the regression coefficient for geno-type is equal to zero. Family-based association testing was done using the family-based association test (FBAT).33 In the population-based simulations, FEV and PPFEV were regressed on the number of copies of the risk allele. Within-study adjustment was accomplished by including relevant covariates in the regression model.
Results
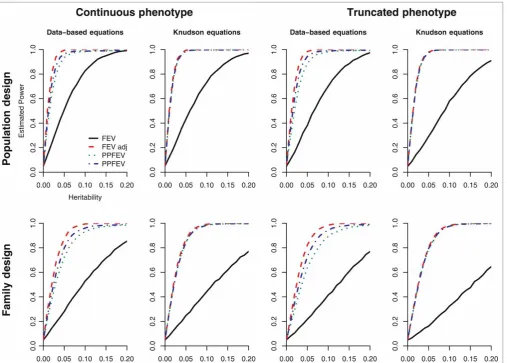
SimulationsBoth population- and family-based association studies were simulated under varying allele frequen-cies, heritabilities and sample sizes. In each case, the power was estimated for four phenotypes: centred FEV, PPFEV, residuals from regressing FEV on relevant covariates and residuals from regressing PPFEV on relevant covariates. Simulated data were based on a real dataset and on the Knudson FEV prediction equation, with both unascertained and ascertained samples (Figure 1 and Supplementary Tables S1 – 4). In all cases, using FEV without adjustment was least powerful and within-study adjusted FEV most powerful. Results were similar for family-based and population-based simulations.
When the data were generated to resemble the CAMP study population as closely as possible, the most powerful approach used the residuals from within-study adjustment of FEV, followed by within-study adjusted PPFEV, PPFEV and finally FEV. Within-study adjustment led to gains in power of up to 20.5 per cent in population-based analyses and up to 17.6 per cent in family-based analyses. To determine how much of the variance in FEV and PPFEV was determined by covariates, we calculated the R2 from regressing FEV and PPFEV on height, weight and age under each of the simulation settings. Because the variance of the distribution of FEV was fixed in the simu-lations, covariates consistently explained 82 – 86 per cent of variance in FEV. Covariates still explained 22 – 26 per cent of the variation in PPFEV, which explains why within-study adjust-ment increased power more so than simply calcu-lating PPFEV.
explained by standard prediction equations, using within-study adjustment did not diminish power.
The results were similar when the samples were truncated to include only subjects with PPFEV 80 per cent. Power decreased overall owing to the decreased amount of variation in FEV, but the trends in power were the same as in the untrun-cated simulations. In fact, the within-study adjust-ment led to even greater gains in power in the truncated analyses: within-study adjustment led to gains in power of up to 23.3 per cent in population-based analyses and up to 20.4 per cent in family-based analyses.
Data analysis: Childhood Asthma Management Program
We demonstrated the four methods of confounder-adjustment using CAMP, a multicentre, randomised clinical trial including 1,041 children between five and 14 years of age with mild to moderate asthma.34 The present analysis included 711 geno-typed Caucasian trios. Each of six single nucleotide polymorphisms (SNPs) in the gene encoding inter-leukin 10 (IL-10), a gene previously associated with asthma,35 – 43 was tested for association with each of four lung-function phenotypes (FEV, PPFEV, within-study adjusted FEV and within-study
Figure 1. Simulated power for sample size of 400 and allele frequency of 0.2. (Pattern is similar for other sample sizes and allele frequencies.) The relationship between FEV and confounders was modelled using the CAMP data and using the equations derived by
Knudsonet al.4Estimated power levels are forntrios simulated 10,000 times, with a type one error rate of 5 per cent. We simulated
both family and population designs, each with and without truncation. Four methods of confounder adjustment were employed: FEV, PPFEV, residuals from regressing FEV on relevant covariates and residuals from regressing PPFEV on relevant covariates.
adjusted PPFEV) (Table 1). Within-study adjust-ment was carried out, regressing FEV on age, sex, weight and height (all recorded at baseline). In a second analysis, all SNPs genotyped in the fat mass and obesity-associated (FTO) gene, which is associ-ated with BMI,44 were tested for association with six obesity phenotypes: weight, BMI and BMI z-scores (BMIZ),45 each with and without within-study adjustment. Weight was adjusted for age, sex and mean-centred height. BMI and BMIZ were adjusted for age and sex. Neither age nor sex was a significant predictor of BMIZ; as a result, using within-study adjusted BMIZ was equivalent to using unadjusted BMIZ in this dataset. For both analyses, the family-based association test (FBAT) statistic was used, assuming an additive genetic model. Regression models were fit using SAS version 9.1. All genetic association tests were per-formed by HelixTree version 5.1.3.
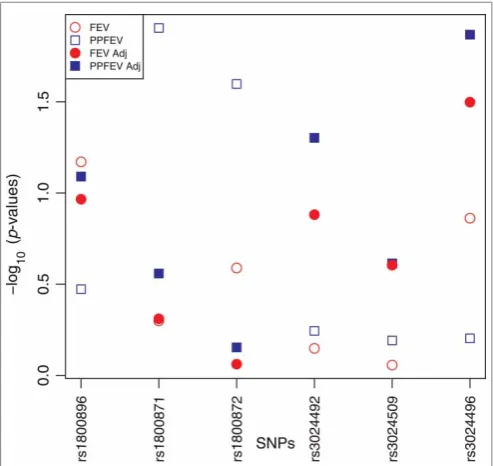
After Bonferroni adjustment for multiple com-parisons, none of the six SNPs in IL-10 were sig-nificantly associated with any of the FEV-derived phenotypes (Figure 2). Height, weight, sex and age explained 83.82 per cent of the variation in FEV and 17.44 per cent of the variation in PPFEV. For the SNP previously associated with FEV, rs3024496,35 PPFEV residuals yielded the lowest
p-value (p¼0.0135) followed by FEV residuals (p¼0.0317). The worst p-value for this SNP was obtained using PPFEV. As in simulations, the within-study adjusted phenotypes did best but, unlike in the simulations, adjusted PPFEV
outperformed adjusted FEV and PPFEV did worse than FEV.
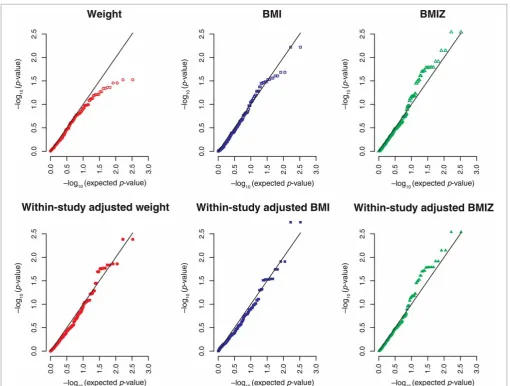
No SNPs in FTO were significant after Bonferroni correction. The SNP previously found to be associated with obesity, rs9939609, was not geno-typed in CAMP. Examining quantile –quantile plots of the – log10 p-values revealed that the association signal was readily apparent in BMIZ (and the equival-ent within-study adjusted BMIZ) and somewhat apparent in within-study adjusted BMI (Figure 3).
Discussion
Our results suggest that genetic association studies using standardised phenotypes can potentially avoid confounding and gain power by using within-study adjusted phenotypes, as opposed to the typical stan-dardised form of the phenotype. Moreover, doing so will not decrease power. Through simulations, we showed that using within-study adjustment of FEV or PPFEV increased power in genetic associ-ation testing by more than using PPFEV. This was true in both population- and family-based designs and with and without an ascertainment condition
Table 1. IL10SNPs genotyped.
SNP Position Location Minor allele freq
rs1800896 21117 A/G Promoter 0.452
rs1800871 2854 C/T Promoter 0.294
rs1800872 2672 C/A Promoter 0.289
rs3024492 1668 T/A Intron 0.225
rs3024509 2483 C/T Intron 0.054
rs3024496 3916 C/T Exon 0.451
IL10, interleukin 10.
Figure 2. Plot of – log10power-based association test (PBAT)
p-values from testing six SNPs inIL10for association with four
on the phenotype. Even in the (unlikely) case where the FEV prediction equation used to calculate PPFEV truly determined the relationship between FEV and its confounders, using within-study adjust-ment did not decrease power. Although the pre-viously associated IL-10 SNP, rs3024496, was only marginally significant in the data analysis, the signal was strongest when within-study adjustment was used. In the FTO analysis, the distribution of
p-values from BMIZ remained unchanged after within-study adjustment, indicating that BMIZ effectively controlled for the available covariates in the CAMP study population. For weight and BMI,
the association signal was enhanced by within-study adjustment. The data analysis results must be inter-preted with caution, since we cannot be certain that any of the SNPs tested confer risk for decreased lung function or obesity.
Since within-study adjustment involves fitting a model to explain how the raw phenotype is related to confounders in the study population, it does not provide a measure of what might be considered normal. For this, it is still necessary to use standard-isations based on a healthy population. For instance, in the CAMP study, a child with ‘average’ adjusted FEV would still be considered to have low
Figure 3. Quantile – quantile plots of the – log10(p-values) for genetic association between weight (adjusted six ways) and 166 SNPs
in theFTOgene from the CAMP study.
BMI, body mass index; BMIZ, BMI Z scores; CAMP, Childhood Asthma Management Program; SNPs, single nucleotide polymorphisms.
lung function because all the children in CAMP have asthma. Therefore, within-study adjustment is advantageous only if there is no need to compare subjects’ phenotypes with what might be con-sidered normal in the general population. The advantage of within-study adjustment in large studies is that it can provide a more accurate relative measure of a complex phenotype, allowing study subjects to be compared among themselves. In gen-etics studies, this is precisely what is needed.
When using standardised phenotypes, the method of standardisation can also affect study results. Rosenfeld, et al.showed that using different reference equations to calculate predicted FEV leads to differences in clinical assessment of individ-uals and in the results of cross-sectional and longi-tudinal analyses of cystic fibrosis.46 Both the standardisation and method of within-study adjust-ment should be carefully thought out. Although we only considered the Knudson equations here, our simulation design allows the results to be gen-eralised to other equations for predicted FEV.
In our simulations, within-study adjustment of standardised phenotypes was always equally or less powerful than within-study adjustment of raw pheno-types; however, our data analysis did not reflect this. The smallestp-value for the SNP previously associated with FEV was obtained using within-study adjusted PPFEV. Similarly, when we analysed the FTO SNPs, the most standardised phenotype, BMIZ, performed best (and within-study adjustment did not make a difference). Simulated data differ from real data because associations are simplistically modelled. Real data are much more complex. In real data, within-study adjustment does not fully capture the relation-ship between raw measurements and the complex trait of interest (eg between FEV and lung function or between weight and obesity). By standardising and then using the study population to adjust further, it is possible to make use of two sources of information: the reference population used to derive the standardis-ation and the study populstandardis-ation. Standardisstandardis-ation may also be the only way to account for confounders not collected in a particular study. For these reasons, it may be advantageous to do genetic association testing on within-study adjusted, standardised phenotypes.
Acknowledgments
Special thanks to Donald Halstead for his helpful comments regarding grammar and style. We thank all subjects for their ongoing participation in the CAMP study. We acknowledge the CAMP investigators and research team, supported by NHLBI, for collecting CAMP Genetic Ancillary Study data. All work on data collected from the CAMP Genetic Ancillary Study was conducted at the Channing Laboratory of the Brigham and Women’s Hospital under appropriate CAMP policies and protection of human subjects. CAMP is supported by U01 HL075419, U01 HL65899, P01 HL083069 and T32 HL07427 from the National Heart, Lung and Blood Institute, National Institutes of Health. This work was also supported by T32 MH17119 from the National Institute of Mental Health.
References
1. Lu, A.T.H. and Cantor, R.M. (2007), ‘Weighted variance FBAT: A powerful method for including covariates in FBAT analyses’, Genet. Epidemiol.Vol. 31, pp. 327 – 337.
2. Whittemore, A.S., Halpern, J. and Ahsan, H. (2005), ‘Covariate adjust-ment in family-based association studies’,Genet. Epidemiol.Vol. 28, pp. 244 – 255.
3. Baksh, M.F., Balding, D.J., Vyse, T.J. and Whittaker, J.C. (2007), ‘Family-based association analysis with ordered categorical phenotypes, covariates and interactions’,Genet. Epidemiol.Vol. 31, pp. 1 – 8. 4. Knudson, R.J., Lebowitz, M.D., Holberg, C.J. and Burrows, B. (1983),
‘Changes in the normal maximal expiratory flow-volume curve with growth and aging’,Am. Rev. Respir. Dis.Vol. 127, pp. 725 – 734. 5. Dockery, D.W., Berkey, C.S., Ware, J.H., Speizer, F.E. et al. (1983),
‘Distribution of forced vital capacity and forced expiratory volume in one second in children 6 to 11 years of age’,Am. Rev. Respir. Dis.Vol. 128, pp. 405 – 412.
6. Wang, X., Dockery, D.W., Wypij, D., Fay, M.E.et al. (1993), ‘Pulmonary function between 6 and 18 years of age’,Pediatr. Pulmonol.Vol. 15, pp. 75 – 88.
7. Wilk, J.B., Walter, R.E., Laramie, J.M., Gottlieb, D.J. et al. (2007), ‘Framingham Heart Study genome-wide association: Results for pul-monary function measures’,BMC Med. Genet.Vol. 8 (Suppl. 1), p. S8. 8. Leung, T.F., Chan, I.H.S., Wong, G.W.K., Li, C.Y. et al. (2007),
‘Association between candidate genes and lung function growth in Chinese asthmatic children’,Clin. Exp. AllergyVol. 37, pp. 1480 – 1486. 9. Fardo, D., Celedn, J.C., Raby, B.A., Weiss, S.T.et al. (2007), ‘On
dichot-omizing phenotypes in family-based association tests: Quantitative phe-notypes are not always the optimal choice’,Genet. Epidemiol.Vol. 31, pp. 376 – 382.
10. Zhang, H., Hang, J., Wang, X., Zhou, W. et al. (2007), ‘TNF poly-morphisms modify endotoxin exposure-associated longitudinal lung function decline’,Occup. Environ. Med.Vol. 64, pp. 409 – 413.
11. Sata, M., Takabatake, N., Inoue, S., Shibata, Y.et al. (2007), ‘Intronic single-nucleotide polymorphisms in Bcl-2 are associated with chronic obstructive pulmonary disease severity’,RespirologyVol. 12, pp. 34 – 41. 12. Ogawa, E., Ruan, J., Connett, J.E., Anthonisen, N.R. et al. (2007),
‘Transforming growth factor-beta1 polymorphisms, airway responsiveness and lung function decline in smokers’,Respir. Med.Vol. 101, pp. 938 –943. 13. Zhang, G., Hayden, C.M., Khoo, S.K., Laing, I.A. et al. (2006),
14. Tanaka, G., Sandford, A.J., Burkett, K., Connett, J.E. et al. (2007), ‘Tumour necrosis factor and lymphotoxin A polymorphisms and lung function in smokers’,Eur. Respir. J.Vol. 29, pp. 34 – 41.
15. Gungou, A., Leynaert, B., Bnessiano, J., Pin, I.et al. (2006), ‘Association of lung function decline with the heme oxygenase-1 gene promoter microsatellite polymorphism in a general population sample. Results from the European Community Respiratory Health Survey (ECRHS), France’,J. Med. Genet.Vol. 43, p. e43.
16. Ruse, C.E., Hill, M.C., Tobin, M., Neale, N. et al. (2007), ‘Tumour necrosis factor gene complex polymorphisms in chronic obstructive pul-monary disease’,Respir. Med.Vol. 101, pp. 340 – 344.
17. van Diemen, C.C., Postma, D.S., Vonk, J.M., Bruinenberg, M. et al. (2006), ‘Decorin and TGF-beta1 polymorphisms and development of COPD in a general population’,Respir. Res.Vol. 7, p. 89.
18. Rousseau, K., Vinall, L.E., Butterworth, S.L., Hardy, R.J.et al. (2006), ‘MUC7 haplotype analysis: Results from a longitudinal birth cohort support protective effect of the MUC7*5 allele on respiratory function’,
Ann. Hum. Genet.Vol. 70, pp. 417 – 427.
19. Tujague, J., Bastaki, M., Holland, N., Balmes, J.R. et al. (2006), ‘Antioxidant intake, GSTM1 polymorphism and pulmonary function in healthy young adults’,Eur. Respir. J.Vol. 27, pp. 282 – 288.
20. Steagall, W.K., Glasgow, C.G., Hathaway, O.M., Avila, N.A.et al. (2007), ‘Genetic and morphologic determinants of pneumothorax in lymphan-gioleiomyomatosis’,Am. J. Physiol. Lung Cell. Mol. Physiol.Vol. 293, pp. L800 – L808.
21. Takabatake, N., Toriyama, S., Takeishi, Y., Shibata, Y.et al. (2007), ‘A non-functioning single nucleotide polymorphism in olfactory receptor gene family is associated with the forced expiratory volume in the first second/ the forced vital capacity values of pulmonary function test in a Japanese population’,Biochem. Biophys. Res. Commun.Vol. 364, pp. 662 –667. 22. Lee, S.Y., Kim, H.B., Kim, J.H., Kim, B.S.et al. (2007), ‘Responsiveness to
montelukast is associated with bronchial hyperresponsiveness and total immunoglobulin E but not polymorphisms in the leukotriene C4 synthase and cysteinyl leukotriene receptor 1 genes in Korean children with exercise-induced asthma (EIA)’,Clin. Exp. AllergyVol. 37, pp. 1487–1493. 23. Palmer, C.N.A., Ismail, T., Lee, S.P., Terron-Kwiatkowski, A.et al. (2007),
‘Filaggrin null mutations are associated with increased asthma severity in children and young adults’,J. Allergy Clin. Immunol.Vol. 120, pp. 64–68. 24. Taill, C., Gungou, A., Almolki, A., Piperaud, M. et al. (2007), ‘ETB
receptor polymorphism is associated with airway obstruction’, BMC Pulm. Med.Vol. 7, p. 5.
25. Battle, N.C., Choudhry, S., Tsai, H.J., Eng, C. et al. (2007), ‘Ethnicity-specific gene-gene interaction between IL-13 and IL-4Ralpha among African Americans with asthma’,Am. J. Respir. Crit. Care Med.
Vol. 175, pp. 881 – 887.
26. Hawkins, G.A., Tantisira, K., Meyers, D.A., Ampleford, E.J.et al. (2006), ‘Sequence, haplotype, and association analysis of ADRbeta2 in a multi-ethnic asthma case-control study’, Am. J. Respir. Crit. Care Med. Vol. 174, pp. 1101 – 1109.
27. Hao, L., Sayers, I., Cakebread, J.A., Barton, S.J.et al. (2006), ‘The cysteinyl-leukotriene type 1 receptor polymorphism 927T/C is associated with atopy severity but not with asthma’,Clin. Exp. AllergyVol. 36, pp. 735–741. 28. He, J.Q., Shumansky, K., Zhang, X., Connett, J.E. et al. (2007),
‘Polymorphisms of interleukin-10 and its receptor and lung function in COPD’,Eur. Respir. J.Vol. 29, pp. 1120 – 1126.
29. Munthe-Kaas, M.C., Carlsen, K.C.L., Carlsen, K.H., Skinningsrud, B.et al. (2006), ‘CFTR gene mutations and asthma in the Norwegian Environment and Childhood Asthma study’,Respir. Med.Vol. 100, pp. 2121–2128. 30. Kaur, S., Gupta, V.K., Shah, A., Thiel, S.et al. (2006), ‘Elevated levels of
mannan-binding lectin [corrected] (MBL) and eosinophilia in patients of bronchial asthma with allergic rhinitis and allergic bronchopulmonary aspergillosis associate with a novel intronic polymorphism in MBL’,Clin. Exp. Immunol.Vol. 143, pp. 414 – 419.
31. Choi, J.H., Kim, S.H., Bae, J.S., Yu, H.L.et al. (2006), ‘Lack of an associ-ation between a newly identified promoter polymorphism (-1702G.A) of the leukotriene C4 synthase gene and aspirin-intolerant asthma in a Korean population’,Tohoku J. Exp. Med.Vol. 208, pp. 49 –56.
32. Naylor, M., Raby, B.A., Weiss, S.T. and Lange, C. (2005), ‘Generalizability of regression models for the FEV1-measurements in asthmatic children’,Far East J. Theo. Stat.Vol. 16, pp. 353 – 361. 33. Lange, C., DeMeo, D.L. and Laird, N.M. (2002), ‘Power and design
considerations for a general class of family-based association tests: Quantitative traits’,Am. J. Hum. Genet.Vol. 71, pp. 1330 – 1341. 34. Childhood Asthma Management Program Research Group (1999), ‘The
Childhood Asthma Management Program (CAMP): Design, rationale, and methods’,Control. Clin. TrialsVol. 20, pp. 91 – 120.
35. Lyon, H., Lange, C., Lake, S., Silverman, E.K.et al. (2004), ‘IL10 gene polymorphisms are associated with asthma phenotypes in children’,
Genet. Epidemiol.Vol. 26, pp. 155 – 165.
36. Lazarus, R., Klimecki, W.T., Palmer, L.J., Kwiatkowski, D.J.et al. (2002), ‘Single-nucleotide polymorphisms in the interleukin- 10 gene: Differences in frequencies, linkage disequilibrium patterns, and haplotypes in three United States ethnic groups’,GenomicsVol. 80, pp. 223–228.
37. Hobbs, K., Negri, J., Klinnert, M., Rosenwasser, L.J. et al. (1998), ‘Interleukin-10 and transforming growth factor-beta promoter poly-morphisms in allergies and asthma’,Am. J. Respir. Crit. Care Med. Vol. 158, pp. 1958 – 1962.
38. Hang, L.W., Hsia, T.C., Chen, W.C., Chen, H.Y. et al. (2003), ‘Interleukin-10 gene -627 allele variants, not interleukin-I beta gene and receptor antagonist gene polymorphisms, are associated with atopic bron-chial asthma’,J. Clin. Lab. Anal.Vol. 17, pp. 168 – 173.
39. Karjalainen, J., Hulkkonen, J., Nieminen, M.M., Huhtala, H. et al. (2003), ‘Interleukin-10 gene promoter region polymorphism is associated with eosinophil count and circulating immunoglobulin E in adult asthma’,Clin. Exp. AllergyVol. 33, pp. 78 – 83.
40. Lim, S., Crawley, E., Woo, P. and Barnes, P.J. (1998), ‘Haplotype associ-ated with low interleukin-10 production in patients with severe asthma’,
LancetVol. 352, p. 113.
41. Borish, L., Aarons, A., Rumbyrt, J., Cvietusa, P. et al. (1996), ‘Interleukin-10 regulation in normal subjects and patients with asthma’,
J. Allergy Clin. Immunol.Vol. 97, pp. 1288 – 1296.
42. Wjst, M., Altmller, J., Faus-Kessler, T., Braig, C. et al. (2006), ‘Asthma families show transmission disequilibrium of gene variants in the vitamin D metabolism and signalling pathway’,Respir. Res.Vol. 7, p. 60. 43. Chatterjee, R., Batra, J., Kumar, A., Mabalirajan, U. et al. (2005),
‘Interleukin-10 promoter polymorphisms and atopic asthma in North Indians’,Clin. Exp. AllergyVol. 35, pp. 914 – 919.
44. Frayling, T.M., Timpson, N.J., Weedon, M.N., Zeggini, E.et al. (2007), ‘A common variant in the FTO gene is associated with body mass index and predisposes to childhood and adult obesity’,ScienceVol. 316, pp. 889–894. 45. Kuczmarski, R.J., Ogden, C.L., Grummer-Strawn, L.M., Flegal, K.M.et al.
(2000), ‘CDC growth charts: United States’,Adv. DataVol. 314, pp. 1–27. 46. Rosenfeld, M., Pepe, M.S., Longton, G., Emerson, J. et al. (2001),
‘Effect of choice of reference equation on analysis of pulmonary function in cystic fibrosis patients’,Pediatr. Pulmonol.Vol. 31, pp. 227 – 237.
Supplementary Tables
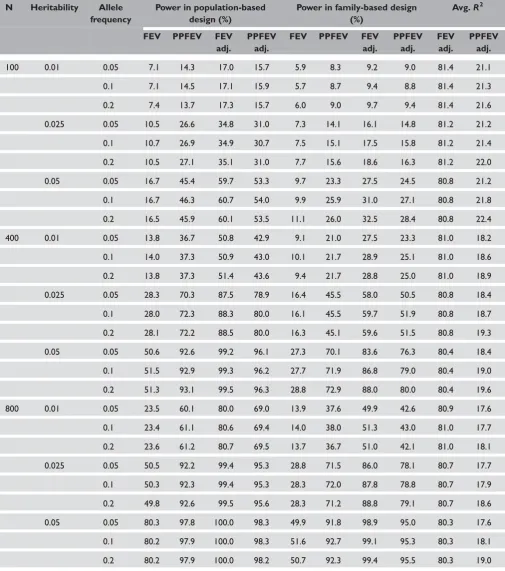
The following four tables show simulation results. Estimated power levels are for n trios simulated 10,000 times, with a type one error rate of 5 per cent. Four methods of confounder adjustment were employed: FEV, PPFEV, residuals from regressing FEV on relevant covariates and residuals from regressing PPFEV on relevant covariates. The per-centage of variation explained by the covariates used for within-study adjustment (R2) is shown for each of the covariate-adjusted phenotypes.
Table S1. Results from simulations in which the relationship between FEV and confounders was modelled using the CAMP data with no truncation
N Heritability Allele frequency
Power in population-based design (%)
Power in family-based design (%)
Avg.R2
FEV PPFEV FEV adj.
PPFEV adj.
FEV PPFEV FEV adj.
PPFEV adj.
FEV adj.
PPFEV adj.
100 0.01 0.05 7.1 14.3 17.0 15.7 5.9 8.3 9.2 9.0 81.4 21.1
0.1 7.1 14.5 17.1 15.9 5.7 8.7 9.4 8.8 81.4 21.3
0.2 7.4 13.7 17.3 15.7 6.0 9.0 9.7 9.4 81.4 21.6
0.025 0.05 10.5 26.6 34.8 31.0 7.3 14.1 16.1 14.8 81.2 21.2
0.1 10.7 26.9 34.9 30.7 7.5 15.1 17.5 15.8 81.2 21.4
0.2 10.5 27.1 35.1 31.0 7.7 15.6 18.6 16.3 81.2 22.0
0.05 0.05 16.7 45.4 59.7 53.3 9.7 23.3 27.5 24.5 80.8 21.2
0.1 16.7 46.3 60.7 54.0 9.9 25.9 31.0 27.1 80.8 21.8
0.2 16.5 45.9 60.1 53.5 11.1 26.0 32.5 28.4 80.8 22.4
400 0.01 0.05 13.8 36.7 50.8 42.9 9.1 21.0 27.5 23.3 81.0 18.2
0.1 14.0 37.3 50.9 43.0 10.1 21.7 28.9 25.1 81.0 18.6
0.2 13.8 37.3 51.4 43.6 9.4 21.7 28.8 25.0 81.0 18.9
0.025 0.05 28.3 70.3 87.5 78.9 16.4 45.5 58.0 50.5 80.8 18.4
0.1 28.0 72.3 88.3 80.0 16.1 45.5 59.7 51.9 80.8 18.7
0.2 28.1 72.2 88.5 80.0 16.3 45.1 59.6 51.5 80.8 19.3
0.05 0.05 50.6 92.6 99.2 96.1 27.3 70.1 83.6 76.3 80.4 18.4
0.1 51.5 92.9 99.3 96.2 27.7 71.9 86.8 79.0 80.4 19.0
0.2 51.3 93.1 99.5 96.3 28.8 72.9 88.0 80.0 80.4 19.6
800 0.01 0.05 23.5 60.1 80.0 69.0 13.9 37.6 49.9 42.6 80.9 17.6
0.1 23.4 61.1 80.6 69.4 14.0 38.0 51.3 43.0 81.0 17.7
0.2 23.6 61.2 80.7 69.5 13.7 36.7 51.0 42.1 81.0 18.1
0.025 0.05 50.5 92.2 99.4 95.3 28.8 71.5 86.0 78.1 80.7 17.7
0.1 50.3 92.3 99.4 95.3 28.3 72.0 87.8 78.8 80.7 17.9
0.2 49.8 92.6 99.5 95.6 28.3 71.2 88.8 79.1 80.7 18.6
0.05 0.05 80.3 97.8 100.0 98.3 49.9 91.8 98.9 95.0 80.3 17.6
0.1 80.2 97.9 100.0 98.3 51.6 92.7 99.1 95.3 80.3 18.1
0.2 80.2 97.9 100.0 98.2 50.7 92.3 99.4 95.5 80.3 19.0
Table S2. Results from simulations in which the relationship between FEV and confounders was determined by published FEV prediction equations with no truncation
N Heritability Allele frequency
Power in population-based design (%)
Power in family-based design (%)
Avg. R2
FEV PPFEV FEV adj.
PPFEV adj.
FEV PPFEV FEV adj.
PPFEV adj.
FEV adj.
PPFEV adj.
100 0.01 0.05 6.9 15.6 17.0 16.5 5.5 9.0 9.3 9.1 84.4 6.6
0.1 6.4 15.9 16.9 16.8 5.4 9.5 9.3 9.5 84.5 6.6
0.2 6.6 15.7 16.6 16.5 6.0 9.7 9.6 9.6 84.4 6.8
0.025 0.05 9.7 31.4 32.8 32.3 6.7 16.0 15.7 15.4 84.2 6.7
0.1 9.7 32.2 34.1 33.4 7.1 16.9 17.0 16.7 84.3 6.7
0.2 8.9 31.4 33.7 32.3 7.5 18.2 18.2 17.7 84.2 6.8
0.05 0.05 14.6 56.2 59.3 57.2 8.7 27.0 26.8 26.0 84.0 6.8
0.1 14.6 56.3 59.1 57.1 8.9 29.8 30.2 29.0 83.9 6.8
0.2 14.3 57.5 60.3 58.3 10.0 31.3 31.6 30.8 83.9 6.8
400 0.01 0.05 12.2 46.9 49.5 47.3 8.2 25.4 26.2 25.3 84.1 2.1
0.1 12.5 45.9 49.5 46.1 9.1 26.7 28.3 26.9 84.1 2.2
0.2 12.5 47.6 50.6 47.7 8.5 27.1 27.9 26.9 84.1 2.2
0.025 0.05 24.1 84.5 86.7 84.7 14.2 54.5 56.6 54.0 83.9 2.2
0.1 23.6 83.7 86.3 84.1 13.8 55.9 58.4 55.8 83.9 2.2
0.2 24.1 84.8 87.4 85.0 13.9 55.7 58.1 55.5 83.9 2.3
0.05 0.05 43.3 98.0 99.1 98.1 23.2 80.9 82.6 80.4 83.6 2.2
0.1 43.1 98.5 99.4 98.6 23.4 83.6 85.7 83.2 83.5 2.3
0.2 43.0 98.7 99.3 98.8 24.3 84.4 86.8 84.0 83.5 2.4
800 0.01 0.05 20.3 73.9 77.6 74.3 12.4 46.6 48.6 46.0 84.0 1.3
0.1 19.3 75.8 79.1 75.9 12.2 47.2 49.8 47.0 84.1 1.3
0.2 20.0 75.6 79.0 75.8 11.9 47.0 49.4 46.6 84.0 1.3
0.025 0.05 43.3 98.1 99.2 98.2 24.5 82.9 84.9 82.5 83.9 1.3
0.1 42.7 98.2 99.2 98.2 23.8 84.5 86.8 84.4 83.8 1.3
0.2 42.2 98.0 99.3 98.1 23.6 84.6 87.2 84.5 83.8 1.4
0.05 0.05 71.0 99.6 100.0 99.6 41.9 97.7 98.7 97.6 83.5 1.3
0.1 71.5 99.6 100.0 99.6 43.4 98.2 99.0 98.0 83.5 1.4
0.2 71.7 99.5 100.0 99.5 42.7 98.4 99.3 98.3 83.5 1.4
FEV, forced expiratory volume; PPFEV, percentage of predicted FEV.
Table S3. Results from simulations in which the relationship between FEV and confounders was modelled using the CAMP data, and
phenotype data were truncated to exclude individuals with PPFEV80 percent
N Heritability Allele frequency
Power in population-based design (%)
Power in family-based design (%)
Avg. R2(%)
FEV PPFEV FEV adj.
PPFEV adj.
FEV PPFEV FEV adj.
PPFEV adj.
FEV adj.
PPFEV adj.
100 0.01 0.05 6.7 13.2 16.4 15.0 5.1 7.4 8.5 7.6 83.8 25.6
0.1 6.5 12.5 15.4 14.1 5.6 7.4 8.8 8.1 83.8 25.5
0.2 6.7 11.8 15.3 14.0 5.3 7.6 9.2 8.4 83.7 26.2
0.025 0.05 9.4 24.2 32.8 29.1 6.3 11.6 14.6 13.2 83.5 25.5
0.1 9.1 23.7 31.5 27.9 6.4 13.0 15.2 14.1 83.5 25.9
0.2 8.8 22.0 29.9 26.3 6.9 12.7 15.5 14.0 83.4 26.3
0.05 0.05 14.5 41.8 56.3 50.6 8.6 20.3 25.3 22.8 83.2 25.5
0.1 13.7 40.4 54.6 48.3 8.2 21.5 27.2 24.0 83.1 25.9
0.2 13.1 39.9 54.3 47.8 8.8 21.8 28.0 24.6 82.9 26.3
400 0.01 0.05 11.0 30.4 44.5 36.9 7.5 17.4 23.5 19.7 83.4 23.1
0.1 11.2 31.0 44.1 37.1 7.7 18.1 24.0 20.8 83.4 23.3
0.2 11.1 29.7 43.1 36.1 8.0 18.1 24.2 20.0 83.3 23.6
0.025 0.05 21.8 63.4 83.2 73.9 13.2 38.1 51.4 44.5 83.2 23.1
0.1 21.8 62.2 82.7 73.0 12.6 38.1 51.5 44.1 83.1 23.5
0.2 20.6 61.9 81.6 72.0 12.9 36.2 50.7 42.9 83.0 23.8
0.05 0.05 41.7 89.5 98.6 95.0 22.5 63.7 80.2 72.1 82.8 23.0
0.1 39.4 88.9 98.6 94.7 21.0 63.7 80.5 72.3 82.7 23.3
0.2 38.6 88.3 98.5 94.3 21.7 63.0 82.3 72.7 82.6 24.1
800 0.01 0.05 17.7 51.3 73.6 61.3 11.3 30.8 42.5 36.0 83.4 22.4
0.1 16.6 50.7 72.2 60.3 11.3 30.1 43.7 35.7 83.3 22.6
0.2 16.6 50.5 71.4 60.0 10.9 28.2 41.6 34.2 83.3 22.9
0.025 0.05 38.3 87.4 98.4 93.3 20.7 63.5 80.8 71.2 83.1 22.5
0.1 36.9 87.3 98.3 93.1 20.5 61.5 81.4 71.0 83.1 22.7
0.2 36.2 86.6 98.2 92.8 20.0 61.2 81.6 70.8 82.9 23.2
0.05 0.05 68.3 97.6 100.0 98.5 40.3 88.0 97.8 93.2 82.7 22.4
0.1 67.0 97.7 100.0 98.6 39.0 88.6 98.6 94.0 82.6 22.8
0.2 65.2 97.4 100.0 98.2 38.0 87.8 98.3 93.4 82.5 23.3
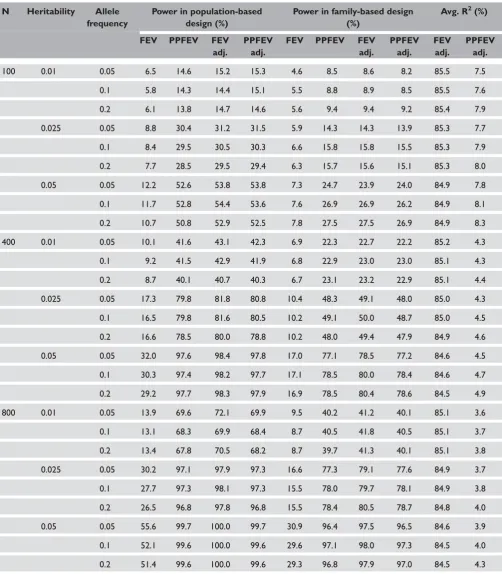
Table S4. Results from simulations in which the relationship between FEV and confounders was determined by published FEV prediction
equations and phenotype data was truncated to exclude individuals with PPFEV80 percent
N Heritability Allele frequency
Power in population-based design (%)
Power in family-based design (%)
Avg. R2(%)
FEV PPFEV FEV adj.
PPFEV adj.
FEV PPFEV FEV adj.
PPFEV adj.
FEV adj.
PPFEV adj.
100 0.01 0.05 6.5 14.6 15.2 15.3 4.6 8.5 8.6 8.2 85.5 7.5
0.1 5.8 14.3 14.4 15.1 5.5 8.8 8.9 8.5 85.5 7.6
0.2 6.1 13.8 14.7 14.6 5.6 9.4 9.4 9.2 85.4 7.9
0.025 0.05 8.8 30.4 31.2 31.5 5.9 14.3 14.3 13.9 85.3 7.7
0.1 8.4 29.5 30.5 30.3 6.6 15.8 15.8 15.5 85.3 7.9
0.2 7.7 28.5 29.5 29.4 6.3 15.7 15.6 15.1 85.3 8.0
0.05 0.05 12.2 52.6 53.8 53.8 7.3 24.7 23.9 24.0 84.9 7.8
0.1 11.7 52.8 54.4 53.6 7.6 26.9 26.9 26.2 84.9 8.1
0.2 10.7 50.8 52.9 52.5 7.8 27.5 27.5 26.9 84.9 8.3
400 0.01 0.05 10.1 41.6 43.1 42.3 6.9 22.3 22.7 22.2 85.2 4.3
0.1 9.2 41.5 42.9 41.9 6.8 22.9 23.0 23.0 85.1 4.3
0.2 8.7 40.1 40.7 40.3 6.7 23.1 23.2 22.9 85.1 4.4
0.025 0.05 17.3 79.8 81.8 80.8 10.4 48.3 49.1 48.0 85.0 4.3
0.1 16.5 79.8 81.6 80.5 10.2 49.1 50.0 48.7 85.0 4.5
0.2 16.6 78.5 80.0 78.8 10.2 48.0 49.4 47.9 84.9 4.6
0.05 0.05 32.0 97.6 98.4 97.8 17.0 77.1 78.5 77.2 84.6 4.5
0.1 30.3 97.4 98.2 97.7 17.1 78.5 80.0 78.4 84.6 4.7
0.2 29.2 97.7 98.3 97.9 16.9 78.5 80.4 78.6 84.5 4.9
800 0.01 0.05 13.9 69.6 72.1 69.9 9.5 40.2 41.2 40.1 85.1 3.6
0.1 13.1 68.3 69.9 68.4 8.7 40.5 41.8 40.5 85.1 3.7
0.2 13.4 67.8 70.5 68.2 8.7 39.7 41.3 40.1 85.1 3.8
0.025 0.05 30.2 97.1 97.9 97.3 16.6 77.3 79.1 77.6 84.9 3.7
0.1 27.7 97.3 98.1 97.3 15.5 78.0 79.7 78.1 84.9 3.8
0.2 26.5 96.8 97.8 96.8 15.5 78.4 80.5 78.7 84.8 4.0
0.05 0.05 55.6 99.7 100.0 99.7 30.9 96.4 97.5 96.5 84.6 3.9
0.1 52.1 99.6 100.0 99.6 29.6 97.1 98.0 97.3 84.5 4.0
0.2 51.4 99.6 100.0 99.6 29.3 96.8 97.9 97.0 84.5 4.3
FEV, forced expiratory volume; PPFEV, percentage of predicted FEV.