R E V I E W
Open Access
UGM: a more stable procedure for
large-scale multiple testing problems, new
solutions to identify oncogene
Chengyou Liu
1, Leilei Zhou
1, Yuhe Wang
1, Shuchang Tian
1, Junlin Zhu
2*, Hang Qin
1, Yong Ding
3,4and
Hongbing Jiang
1,5*Abstract
Variations of gene expression levels play an important role in tumors. There are numerous methods to identify differentially expressed genes in high-throughput sequencing. Several algorithms endeavor to identify distinctive genetic patterns susceptable to particular diseases. Although these processes have been proved successful, the probability that the number of non-differentially expressed genes measured by false discovery rate (FDR) has a large standard deviation, and the misidentification rate (type I error) grows rapidly when the number of genes to be detected become larger. In this study we developed a new method, Unit Gamma Measurement (UGM), accounting for multiple hypotheses test statistics distribution, which could reduce the dependency problem. Simulated expression profile data and breast cancer RNA-Seq data were utilized to testify the accuracy of UGM. The results show that the number of non-differentially expressed genes identified by the UGM is very close to the real-evidence data, and the UGM also has a smaller standard error, range, quartile range and RMS error. In addition, the UGM can be used to screen many breast cancer-associated genes, such as BRCA1, BRCA2, PTEN, BRIP1, etc., provides better accuracy, robustness and efficiency, the method of identification differentially expressed genes in high-throughput sequencing.
Keywords:Differentially expressed genes, False discovery rate, Standard deviation, RNA-Seq data, Root mean square error, Cancer-associated genes
Introduction
Cancer is a major public health problem worldwide. It is a disease that arises from uncontrolled cell cycle, proliferation and inter-cellular communication. As of to date, more than 100 types of cancers were diagnosed in human [1]. Scientists have reached a consensus that cancer is caused by both gen-etic factors, such as mutations and disrupted hormones, and environmental factors [2]. Some tumors are hereditary dis-eases, which are attributed by the disorder of the mechanism regulating cell growth and proliferation. In general, genetic or epigenetic changes in DNA could confer a normal cell potential malignancy [3, 4]. Cellular- oncogenes,
anti-oncogene and DNA repair genes are major types of genes that contribute to this process. The interaction of these genes is sometimes referred to as the“driver”of cancer [5].
Although the genomic composition of cells are almost identical for an individual, genetic, transcriptional and ex-pression variation may occur during cell differentiation and proliferation. Investigation into the difference of gene expression profiles among cells in different state would provide significant insights into the function of genes and their products [6]. The identification of affiliation/connec-tion between disease and genetic or expressional pattern renders tremendous/enormous significance. Differentially expressed genes and proteins can be screened from the level of genes and proteins, respectively.. Screening differ-ential molecules can be accomplished in two ways: screen-ing from protein expression data or usscreen-ing RNA-Seq data to detect differentially expressed genes. Over the past dec-ade many genome-wide studies have demonstrated that
© The Author(s). 2019Open AccessThis article is distributed under the terms of the Creative Commons Attribution 4.0 International License (http://creativecommons.org/licenses/by/4.0/), which permits unrestricted use, distribution, and reproduction in any medium, provided you give appropriate credit to the original author(s) and the source, provide a link to the Creative Commons license, and indicate if changes were made. The Creative Commons Public Domain Dedication waiver (http://creativecommons.org/publicdomain/zero/1.0/) applies to the data made available in this article, unless otherwise stated.
* Correspondence:[email protected];[email protected]
2
Department of Critical Care Medicine, Nanjing First Hospital, Nanjing Medical University, Nanjing 210016, Jiangsu, China
1Department of Medical Engineering, Nanjing First Hospital, Nanjing Medical
University, Nanjing, China
there are many genes harboring overrepresented muta-tions, such as tumour protein 53 (TP53) [7], phosphatase and tensin homolog deleted on chromosome ten (PTEN) [8], kirsten rat sarcoma viral oncogene homolog (KRAS) [9], myelocytomatosis viral oncogene (MYC) [10], breast cancer (BRCA) [11] .
Gene chip is also known as Bio-array or microarray, and this technology is based on the theory of hybridization by Edwin Mellor Southern. In the 1980s, gene chip prototype was proposed. The first gene chip was achieved in 1991. With the development of human genome project and molecular biology technology, gene chip technology has been developing rapidly in the past 20 years. Gene chip can detect the growth of tumor-related information, and has evolved to be a sophisti-cated technology in tumor detection and analysis. The rapid development of gene chip technology has brought revolutionary impact on medical research [12].
Genomics research shows that the gene expression dif-ferences are associated with biological conditions and disease stages. It is a useful tool of microarray technol-ogy for quantitative analysis of gene expression in recent decades. Both the microarray data and RNA-Seq data is characterized by low sample size and high dimensional
variables. Therefore, when identifying differentially
expressed genes in these data, multiple comparisons are required. When we conduct multi-sample hypothesis tests, the false discovery rate (FDR) is a widely adopted method to control type I errors in null hypothesis test-ing. The FDR method is a probability designed to con-trol the false events [13, 14]. For type I error, the FDR controlling procedure is not as strict as family wise error rate (FWER) controlling procedures, which controls the probability of more than one type I error [15]. There-fore, FDR controlling programs have an advantage over type I errors, but at the cost of increasing the error rate
[16, 17]. At the same time, the results of different
methods are quite different. So far, there is still no uni-fied conclusion in the scientific community regarding the most efficient, robust and accurate method. There-fore, this paper aims to propose a new method for screening differentially expressed genes based on gene
expression profiling data, and uses simulated gene chip data and breast cancer data to verify the validity and ac-curacy of the proposed method. Furthermore, this article also aims to provide a case study for the screening of clinical differentially expressed genes.
Methods
Multiple hypothesis testing and FDR
In the 1950s, multiple hypothesis testing began to gain attraction, especially for high-throughput data analysis, where the problem of multiple comparisons was particu-larly outstanding. Microarray data is an example of high-dimensional data, which is characterized by small sample size and high variable dimension, which constituted a
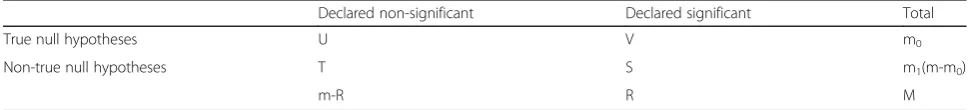
typical multiple hypothesis testing problem. Table 1
summarizes this situation in traditional form.
FDR¼ E SþVV
¼E VR R≠0 0R¼0
8 <
: ð1Þ
The definition of FDR is the expectation of false discov-ery rate(V/R). At present FDR has been widely used in practical problems. According to the literature reported, when m0=m, then FDR = FWER. When m0≤m, then
FDR≤FWER. FDR not only improves the test capability, but also makes better the traditional multi-hypothesis test process, which is too conservative. Therefore, FDR sup-plies a applicable error calculation standard for multiple tests of large-scale data. FDR commonly used control process Benjamini, & LIU (BL), Benjamini, & Hochberg (BH), Benjamini & Yekutieli (BY) and a-daptive linear step- up (ALSU). Currently the most widely used method is the ALSU procedure. The ALSU procedure as follows:
(1) LetH01,H02,H03,…,H0mbe the tested null hypotheses. Using single test method to test each event and getPvaluesP1,P2,P3,…,Pm, and sortp valuesP1;P2;P3;…;Pm.
(2) LetrðλÞ ¼ max
1≤i≤mfi:P
i≤λg, whereλis usually taken as 0.5.r(λ) represents the number less thanλ.
Table 1Multiple hypothesis testing
Declared non-significant Declared significant Total
True null hypotheses U V m0
Non-true null hypotheses T S m1(m-m0)
m-R R M
We need to consider testing the m (null) hypothesis, where m0 is true and the rest m1 = m-m0 is false. After testing the m (null) hypotheses, there are R rejected and m-R not rejected null hypotheses. m (null) hypotheses were committed into four parts by type I error and type II error. They are U, V, S, and T. U and S denote the number of correct tests in m. V denotes the number of type I error tests in m. T represents the number of type II error in m, and R is used to represent observable random variables. U, V, S, and T are unobservable random variables
(3) Estimateπ^0byπ^0¼mm−rð1ð−λλÞÞ. Estimatem^0bym^0
¼m−r1−ðλλÞ, wherem^0is the number of true vents.
(4) Estimate^k¼ arg max
1≤i≤mfi:P
i≤mi αg. Whereα= 0.05.
(5) If^kexists, reject the events ofH0ð1Þ;H0ð2Þ;H0ð3Þ;…; H
0ð^kÞ. Else, do not reject any hypotheses.
(6) AdjustPi byPi ¼ min i≤k≤mf minf
c m0
k Pk;1gg.
From the above introduction, we can figure out that the key step of the ALSU procedure is the appraisal of m0. The accuracy of m0 is crucial for the screening of
differentially expressed genes, FDR control processes and testing capabilities. However, statisticians found that this approach is very unstable [18]. In spite of the fact that we repeated many times FDR procedure and get the
mean of m0 is exactly similar to the true value, the
standard deviation (SD) is very large, which caused wide random deviation. Therefore, it is necessary to improve the estimation algorithm of m0.
New estimation method
The P-value is the probability that the sample emerge extreme results when the null event is true. In the pothesis test, the P-value is used to determine the hy-pothesis test results and reflects the feasibility of the test
results, i.e., the level of accepting and rejecting the null hypothesis. The smallerPvalue, the more significant the hypothesis test result. If we assume the null hypothesis is H0, the alternative hypothesis is H, and the sample
ob-servations are X1, X2, X3, …, Xn. After selecting the
ap-propriated statistic T, we can compute the
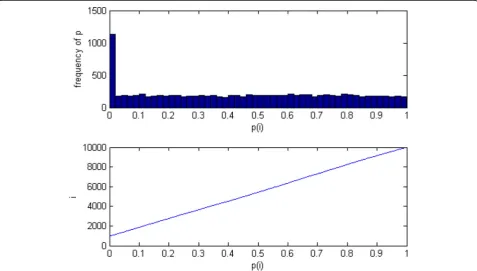
corresponding P value. In multiple hypothesis tests, the P-value results are shown in Fig.1.
From Fig.1we can get that P value is a very regular na-ture in the ideal state. If the number of genes is m, and the ratio of the number of non-differentiated genes isπ0,
therefore the number of non-differentiated genes are m0=m∗π0. Assuming there is a valueγ, which all
differ-ential expression of gene test P values are distributed in (0,γ). In this case, the genes distributed in (γ, 1) should be all non-differentially expressed genes. In this region, the number of non-differentially expressed genes in unit gamma length were min
1≤i≤mfi:P
i≥γg1γ−γ#fPi≥γg γ
1−γ. Therefore the number of genes distributed in (0,γ) should theoretically be the sum of all the differentially expressed
genes and min
1≤i≤mfi:P
i≥γg1−γγ, i.e., the number of genes
in (0,γ) is m−m0þ min 1≤i≤mfi:P
i≥γg1−γγm−m0þ γ
1−γ# fPi≥γg:. In order to avoid the effect of random error, we
Fig. 1Relationship between P(i) and its frequency; P(i) and i are simu-lated data (10,000 genes).a. Frequency distribution of P(i);b. P(i) vs i. Note: Hypothesis testing has the following two characteristics. I). When H0is true, thePvalue calculated from observed value is uniform distribution in
(0, 1), i.e., P ~ U (0, 1). II). When H0is false, the distribution of P value is uncertain. However according to the definition of P value can be known,
calculated the number of non-differentially expressed genes in the multi-gammas.
The key of this algorithm is to appraisem0m0. LetH01,
H02, H03, …, H0m be null hypothesis (genes).
Corres-pondingly, the P-values of independent hypothesis tests
areP1, P2,P3, …, Pm. Level of significance isα. Because
this article uses the concept of the unit gamma length number of genes. In this paper, the algorithm is named Unit Gamma Measurement (UGM), which process as follows:
(1) LetH01,H02,H03,…,H0mbe the tested null hypotheses. Using single test method to test each event and getPvaluesP1,P2,P3,…,Pm, and sortp valuesP1;P2;P3;…;Pm.
(2) Select the appropriate cutoff gamma, which is used to qualitatively divide the P value. Gamma should be greater than the Level of significance. Gamma can be appropriately increased when there are lots of genes. Calculate the number of genes distributed in (0,γ), (γ, 2γ),…, (n∗γ, (n+ 1)∗γ). (n+ 2)∗γwas greater than 1. We definePre_γandLat_γ(k) as follows:
Preγ ¼ max
1≤i≤m i:P
i≤γ
Latγð Þk ¼ max
1≤i≤m i:P
i≤kγ
k¼1;2;3;…;n 8
<
: ð2Þ
(3) Estimatem−m0. Estimation method as follow:
m−m0¼m^1¼Preγ−
Xn
i¼1
τiLat γð Þi ð3Þ
τiτiwas weight coefficient, which formula is as follows:
τi¼ 1 Lat γð Þi Pnj¼1
1 Lat γð Þi
ð4Þ
(4) Getm^0
^
m0¼m−m^1 ð5Þ
(5) AdjustPi byPi ¼ min i≤k≤mf minf
c m0
k Pk;1gg. Simulation experiment and evaluation parameters
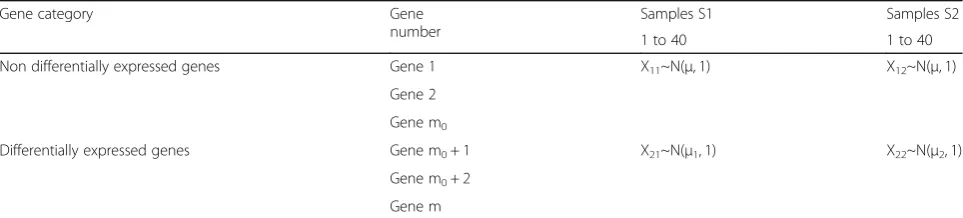
We use in silico analysis to generate gene expression profiles according to the data structure presented in Table 2. The sample size of the experimental group (pa-tient group) and the control group (normal observation group) is 40. The population mean of gene expression
levels of experimental group and control group is μ1i
and μ2i. When the gene (non-differentially expressed
gene) number is less than m0, μ1i=μ2i=μμ1i=μ2i=μ.
When the gene (differentially expressed gene) number is more than m0–1,μ1i≠μ2i. In order to avoid the impact of accidental factors on the results, we performed 1000 repeated experiments on the algorithm for different values ofπ0.
Results
Performance on simulated data
In general, the proportion of differentially expressed genes was small, i.e., π0π0 was large. In the simulation,
we set the total number of genes (m) was 10,000, 8000, 5000, 3000, 2000 and 1000. We set the value ofπ0π0was
0.8,0.85,0.9 and 0.95. In each case, we estimated the m0
using Adaptive Benjamini and Hochberg (ABH), Storey & Tibshirani-λ (S~λ), Two Stages Test (TST) and UGM
methods and computed the average of m0with repeated
1000 times simulations.
Table 2 Constitution of the gene expression profiles
Gene category Gene
number
Samples S1 Samples S2
1 to 40 1 to 40
Non differentially expressed genes Gene 1 X11~N(μ, 1) X12~N(μ, 1)
Gene 2
Gene m0
Differentially expressed genes Gene m0+ 1 X21~N(μ1, 1) X22~N(μ2, 1)
Gene m0+ 2
Gene m
μ~N(0, 2),μ1~N(0, 1),μ2~N(2, 1). Non-differentially expressed genes’number is from 1 to m0, which samples S1 and S2 come from a same population, i.e.,
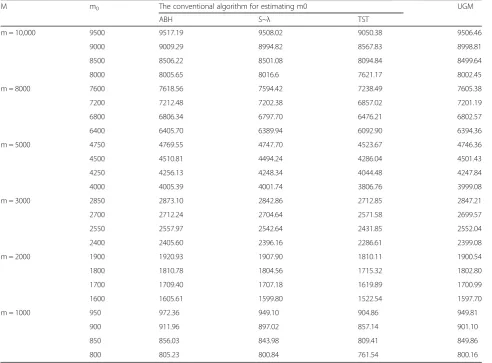
Table3 showed the mean of m0estimated by ABH,
S-λ, TST, UGM in different conditions. We used the
esti-mated m0 values and the actual m0value to do the
rela-tive error analysis. The result shows that the relarela-tive
error of the UGM method is distributed between−0.181
and 0.156%. The relative error of the other three estima-tion methods were distributed between 0.071 and
5.900%,−0.708 and 0.431%,−4.873% and−4.633%. The
estimation results of m0in the four methods have
identi-cal tendency as the actual value. However, the results of the UGM method and the ABH, TST method have sig-nificant difference (P= 0.01296, P= 0.0000, chi-square test), which is undetected between the UGM method and the S-λmethod (P= 0.8644).
The SD represents the discrete degree of the data. The range is the diversity between the maximum and mini-mum values in a list of numbers. The quartile range is the distance between upper quartile and lower quartiles. Both range and quartile range can reflect the fluctuation range and the discrete degree of the data. The root mean squared error (RMSE) is used to measure the disparity
between the estimated values and the true values. The coefficient of variation (CV) is used to indicate the
dif-ference between the different indicator units. Table 4
compares the results of m0 estimation of the four
methods using six indicators.
Table 4 showed that all the results of four
methods trended to 2850. However, there was a big deviation yielded by the TST method computing the number of non-differentially genes (2714.4), i.e., the
TST algorithm is less reliable for m0 estimation. The
mean shows that the m0 estimated by the UGM
method is the closest to the real value, which
slightly better than the S-λ algorithm. In addition,
the quartile range computed using ABH, UGM and
S-λ method were increased. But the results of ABH
and UGM method were very close to each other.
What’s more, the SD, range and CV derived by the
UGM method are better than both the ABH and S-λ
method, which means that the discrete extent of the
data calculated using the proposed method is
smaller. In summary, UGM is more stable, accurate
Table 3Estimate the number of non - differentially expressed genes
M m0 The conventional algorithm for estimating m0 UGM
ABH S~λ TST
m = 10,000 9500 9517.19 9508.02 9050.38 9506.46
9000 9009.29 8994.82 8567.83 8998.81
8500 8506.22 8501.08 8094.84 8499.64
8000 8005.65 8016.6 7621.17 8002.45
m = 8000 7600 7618.56 7594.42 7238.49 7605.38
7200 7212.48 7202.38 6857.02 7201.19
6800 6806.34 6797.70 6476.21 6802.57
6400 6405.70 6389.94 6092.90 6394.36
m = 5000 4750 4769.55 4747.70 4523.67 4746.36
4500 4510.81 4494.24 4286.04 4501.43
4250 4256.13 4248.34 4044.48 4247.84
4000 4005.39 4001.74 3806.76 3999.08
m = 3000 2850 2873.10 2842.86 2712.85 2847.21
2700 2712.24 2704.64 2571.58 2699.57
2550 2557.97 2542.64 2431.85 2552.04
2400 2405.60 2396.16 2286.61 2399.08
m = 2000 1900 1920.93 1907.90 1810.11 1900.54
1800 1810.78 1804.56 1715.32 1802.80
1700 1709.40 1707.18 1619.89 1700.99
1600 1605.61 1599.80 1522.54 1597.70
m = 1000 950 972.36 949.10 904.86 949.81
900 911.96 897.02 857.14 901.10
850 856.03 843.98 809.41 849.86
800 805.23 800.84 761.54 800.16
and robust. The UGM method is better than other conventional algorithms.
Performance on real data
In order to verify the validity and accuracy of UGM, we selected the breast cancer gene chip data to further ver-ify UGM in this paper. However, the selection of real data is random and unlimited breast cancer gene chip data, which is part of our previous research. In this paper, the gene chip data was downloaded from the NCBI\GEO database. (platforms number: GPL570; ac-cession number: GSE31192 [5,19]. Total RNAs were ex-tracted from breast cancer and normal tissues. The experimental group was women with breast cancer, and the control group was women of the same age without breast cancer. Malignant epithelia and tumor-associated matrix of pregnancy-associated breast cancer (PABC) and non-PABC were isolated by laser capture micro-dissection and gene expression profile. Eventually, a total of 33 set of gene expression data composed of 20 tumors tissue and 13 normal tissues profiled by 22,283 probes were obtained.
Breast cancer gene chip data were pretreated by the
RMA procedure, and all probesPvalues were computed
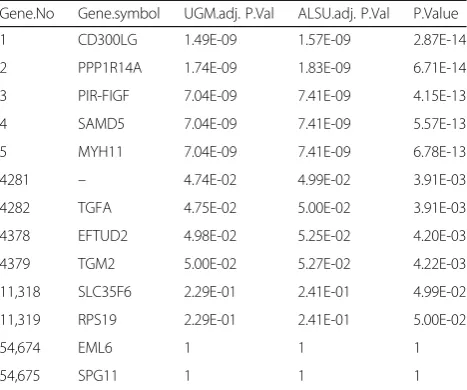
with t-test or Satterthwaite’s approximate t-test. With FDR set at 0.05, ALSU and the UGM estimated m0 and identified the differentially expressed genes associated with breast cancer. Results were shown in Table5.
The results showed that UGM algorithm and ALSU al-gorithm respectively yielded 4397 (8.04%) and 4282 (7.83%) differentially expressed genes. While the general t-test resulted in 11,319 (20.7%). The UGM and the ALSU were reduced by 6922 (61.2%) and 7037 (62.2%). The ALSU and the UGM methods are significantly more powerful than the general t-test (p= 0). What’s more, the UGM method calculating the number of differen-tially expressed genes were slightly higher than the result of ALSU, suggesting that the UGM method renders a more comprehensive screening results with higher effi-ciency and a reduced false negative rate.
Risk factors for developing breast cancer include being female, obesity, lack of physical exercise, drinking
alcohol, ionizing radiation, etc. In recent years, many cancers have been recognized as inherited disease with a subset of genes mutated, including BRCA1 and BRCA2, both of which are tumor suppressor. These proteins help repair damaged DNA and, therefore, play a role in en-suring the stability of the cell’s genetic material. Specific inherited mutations in BRCA1 and BRCA2 increase the risk of female breast and ovarian cancers, and they have been associated with increased risks of several additional types of cancer. In this paper, we used the UGM algo-rithm to analyze the gene expression profile data of
breast cancer. The results showed that BRCA1 (P=
0.007) and BRCA2 (P= 0.000129) were selected the
genes susceptible to cancer (differentially expressed
genes). What’s more, many genes related to BRCA1 and
BRCA2 have been screened out. They are BRIP1 (P=
0.0000572), PTEN (P= 0.00399), RAD51 (P= 0.00389),
BARD1 (P= 0.0344), MMP11 (P= 0.0256), RRM2 (P=
0.000823), NEK2 (P= 0.0000149), MKI67 (P= 0.000397),
ITGA7 (P= 0.0195), CXCL5 (P= 0.0014).
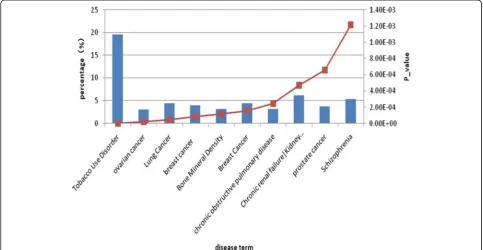
In this paper, the data we used were breast cancer gene expression profile data. we further used the
DA-VID Bioinformatics Resources 6.8 (https://david.
ncifcrf.gov) to analyzed gene-disease association of differentially expressed genes. DAVID 6.8 allows re-searchers to associate sets of genes from a gene list (differentially expressed genes list) to disease pheno-type, employing information from OMIM and the Genetic Association Database mapped to DAVID genes. The results showed that there were 2 terms as-sociated with breast cancer, and 224 (8.414%) genes were enriched in disease-associated with breast cancer (p1 = 8.31E-05, p2 = 1.57E-04). The results of
gene-Table 4Comparison of results of m0estimation using the four methods
Indicators ABH S-λ TST UGM
Mean 2870.35 2852.16 2714.4 2849.83
SD 21.89 20.6 11.51 18.8
Range 142.72 244 67 110
quartile range 23.17 76 15 23.33
RMSE 29.93 50.36 136.08 18.71
CV 0.76% 1.77% 0.24% 0.66%
m = 3000,π0= 0.95,m0=m∗π0= 2850
Table 5Results of identified the differentially expressed genes with the GEO database
Gene.No Gene.symbol UGM.adj. P.Val ALSU.adj. P.Val P.Value
1 CD300LG 1.49E-09 1.57E-09 2.87E-14
2 PPP1R14A 1.74E-09 1.83E-09 6.71E-14
3 PIR-FIGF 7.04E-09 7.41E-09 4.15E-13
4 SAMD5 7.04E-09 7.41E-09 5.57E-13
5 MYH11 7.04E-09 7.41E-09 6.78E-13
4281 – 4.74E-02 4.99E-02 3.91E-03
4282 TGFA 4.75E-02 5.00E-02 3.91E-03
4378 EFTUD2 4.98E-02 5.25E-02 4.20E-03
4379 TGM2 5.00E-02 5.27E-02 4.22E-03
11,318 SLC35F6 2.29E-01 2.41E-01 4.99E-02
11,319 RPS19 2.29E-01 2.41E-01 5.00E-02
54,674 EML6 1 1 1
54,675 SPG11 1 1 1
disease association analysis by differentially expressed genes are shown in Fig. 2.
Conclusion and discussion
In this paper, we have improved the use of p-value of
multiple hypothesis testing in identifying
disease-associated genes. The estimation results of methods were compared using simulated microarray data with mean, SD, range, quartile range, RMSE and CV as evalu-ation indices. The simulevalu-ation results showed that the mean of non-differentially genes (m0) estimated by the
new method was very close to the real value. The results of the UGM method and the ABH, TST method have
significant differences (P= 0.01296, P= 0.0000).
How-ever, there was no significant difference between the
UGM method and the S-λ method (P= 0.8644). These
results suggested that the UGM method and S-λmethod
are significantly superior to the ABH and the TST methods. In addition, the SD, range, quartile range, CV and RSME of the number of non-differentially expressed genes calculated by the S-λ method were all larger than those of the UGM method and are more discrete, which
is concordant with the study by Wu Jing [16]. In
sum-mary, the UGM exhibited better stability, accuracy and robustness,which was better than other conventional algorithms.
In order to verify the effectiveness of the new pro-posed method in screening differentially expressed
genes, we used this method to calculate the gene expres-sion profile data of breast cancer. The results displayed that the UGM method was significantly more powerful than the general t-test (p= 0), and has slightly larger set of differentially expressed genes than those of the ALSU, presenting lower false negative rate and higher screening efficiency. In the differentially expressed genes screened by UGM method, a bunch of well-established oncogenes and anti-oncogenes were discovered, including BRCA1,
BRCA2, PTEN, BRIP1 [20], RAD51 [21], BARD1 [16,
17], MMP11 [22], RRM2 [23], NEK2 [24] et al. Further-more, genes associated with BRCA1, BRCA2 and TP53 were also identified, such as ITGA7 [25], CXCL5 [26] etc.
Microarray technology and DNA and RNA sequencing technology produced huge amount of gene data, which has been widely used in biomedical research. The data dimension of gene expression profile is high and the sample size is small. Identifying informative candidate genes from expression profile data has become an im-perative task and attracts extensive attention in the field of biology and medical statistics research. Microarrays can provide a dynamic snapshot of cell activity, but the results are not noticeable/obvious. The purpose of this paper is to provide useful answers to some of the most common practical problems in microarray data analysis,
especially the multiple validation of differential
expressions.
In the field of microarray data analysis, one of the cri-tica problems of multiplicity test is to estimate the num-ber of true null hypothesis. Traditional processes have dominated the FWER, which is the probability of type I error. When the number of genes is large, the ability to detect differentially expressed genes decreases, and the bona fide differentially expressed genes may be ignored. In actual research, identifying differentially expressed genes from expression profile data is important for gene localization, identification of biomarker and therapeutic targets and study of disease mechanism. The expected percentage of the null hypothesis that is wrongly rejected is a meaningful indicator in multiple compari-sons, but not the probability of error detection. In this
background, Benjamini and Hochberg [14] developed
the FDR control program, which was a groundbreaking achievement. The traditional method needs tight domin-ate the FWER, with a conservative type I error rdomin-ate dom-inated contra any configuration of the hypothesis tested. The FDR method keeps the error-recognition rate within the allowable range, which provides an appropriate metric for multiple tests of large-scale data. Following
Benjamin and Hochberg (BH) ‘s pioneering paper, the
concept of FDR has been widely used in large-scale data analysis. For the BH method, many scholars have ex-tended on their basis and developed many excellent methods. The adaptive linear step-up (ALSU) method proposed by Benjamin et al. has been widely used in pre-vious studies.
The key step in the ALSU process is to estimate the number of non-differentially expressed genes. However, we find that the estimation method proposed in this process is not accurate enough. Although the average of the estimated values has been very close to the true value over the course of many iterations, it is still far from the standard deviation. This introduces large amount of random errors, leading directly to inaccurate final results. In this study, we designed a new method to estimate the number of non-differentially expressed genes and proved its superiority, by using well-established microarray data.
Acknowledgements
The authors thank Professor Ding Yong for help in data analysis. The authors thank Dr. Wu Jing for suggestions and corrections that improved the text.
Author contributions
Chengyou Liu contributed to article writing. Chengyou Liu, Junlin Zhu and Hongbing Jiang designed the study and guided the experiment. Leilei Zhou, Yuhe Wang and Shuchang Tian devoted themselves to data collection. Hang Qin provided fund support. Yong Ding provides technical support. All authors were responsible for experimental design and proofread the final version of manuscript. All authors read and approved the final manuscript.
Funding
This work has been supported by the Innovation Foundation of Nanjing Medical University (2014NJMU035) and Nanjing Medical Science and
Technology Development Fund“Youth Project Talent Training Special Funds”(QRX11033).
Availability of data and materials
The gene chip data are available athttps://www.ncbi.nlm.nih.gov/. The gene-disease association analysis is available athttps://david.ncifcrf.gov. All data and materials are fully available without restriction.
Ethics approval and consent to participate
Not applicable.
Consent for publication
Not applicable.
Competing interests
The authors declare that they have no competing interests.
Author details
1Department of Medical Engineering, Nanjing First Hospital, Nanjing Medical
University, Nanjing, China.2Department of Critical Care Medicine, Nanjing First Hospital, Nanjing Medical University, Nanjing 210016, Jiangsu, China.
3
Department of Mathematics and Computer, Nanjing Medical University, Nanjing, China.4Department of Biomedical Engineering, Nanjing Medical
University, Nanjing, China.5Hongbing Jiang, Nanjing Health Information Center, Nanjing 210016, Jiangsu, China.
Received: 19 July 2019 Accepted: 22 November 2019
References
1. Datta K, Choudhuri M, Guha S, Biswas J. Breast cancer scenario in a regional cancer Centre in eastern India over eight years--still a major public health problem. Asian Pac J Cancer Prevent Apjcp. 2012;13:809–13.https://doi.org/ 10.7314/apjcp.2012.13.3.809.
2. Stojadinovic A, Summers TA, Eberhardt J, Cerussi A, Grundfest W, Peterson CM, et al. Consensus recommendations for advancing breast Cancer: risk identification and screening in ethnically diverse younger women. J Cancer. 2011;2:210–27.https://doi.org/10.7150/jca.2.210.
3. Schmidt LS, Linehan WM. Genetic predisposition to kidney cancer. Semibars Oncol. 2016;43:566–74.https://doi.org/10.1053/j.seminoncol.2016.09.001. 4. Salehi M, Kamali E, Karahmadi M, Mousavi SM. RORA and autism in Isfahan
population: is there an epigenetic relationship. Cell J. 2017;18:540–6.https:// doi.org/10.22074/cellj.2016.4720.
5. Li FY, Zhou J, Xu M, Yuan G. Exploration of a multi-target ligand, dehydroevodiamine, for the recognition of three G-quadruplexes in c-Myb proto-oncogene by ESI-MS. Int J Mass Spectrom. 2017a;414:39–44.https:// doi.org/10.1016/j.ijms.2017.01.006.
6. Heikkila JJ. The expression and function of hsp30-like small heat shock protein genes in amphibians, birds, fish, and reptiles. Comparat Biochem Physiol A-Molec Integ Physiol. 2017;203:179–92.https://doi.org/10.1016/j. cbpa.2016.09.011.
7. Sato K, Hara T, Ohya M. The code structure of the p53 DNA-binding domain and the prognosis of breast cancer patients. Bioinformatics. 2013;29:2822–5. https://doi.org/10.1093/bioinformatics/btt497.
8. Jia PL, Zheng SY, Long JR, Zheng W, Zhao ZM. dmGWAS: dense module searching for genome-wide association studies in protein-protein interaction networks. Bioinformatics. 2011;27:95–102.https://doi.org/10. 1093/bioinformatics/btq615.
9. Ambroise J, Piette AS, Delcorps C, Rigouts L, De Jong BC, Irenge L, et al. AdvISER-PYRO: amplicon identification using SparsE representation of PYROsequencing signal. Bioinformatics. 2013;19:1963–9.https://doi.org/10. 1093/bioinformatics/btt339.
10. Panopoulos AD, Smith EN, Arias AD, Shepard PJ, Hishida Y, Modesto V, et al. Aberrant DNA methylation in human iPSCs associates with MYC-binding motifs in a clone-specific manner independent of genetics. Cell Stem Cell. 2017;20:505.https://doi.org/10.1016/j.stem.2017.03.010.
11. Farmer H, McCabe N, Lord CJ, Tutt ANJ, Johnson DA, Richardson TB, et al. Targeting the DNA repair defect in BRCA mutant cells as a therapeutic strategy. Nature. 2015;434:917–21.https://doi.org/10.1038/nature03445. 12. Park PJ. ChIP-seq: advantages and challenges of a maturing technology. Nat
13. Barrett T, Suzek TO, Troup DB, Wilhite SE, Ngau WC, Ledoux P, et al. NCBI GEO: mining millions of expression profiles-database and tools. Nucleic Acids Res. 2005;33:D562–6.https://doi.org/10.1093/nar/gki022. 14. Benjamini Y, Hochberg Y. Controlling the false discovery rate: a practical
and powerful approach to multiple testing. JR Stat Soc. 1995;57:289–300. https://doi.org/10.1111/j.2517-6161.1995.tb02031.x.
15. Benjamini Y, Krieger AM, Yekutieli D. Adaptive linear step-up procedures that control the false discovery rate. Bioinformatics. 2006;93:491–507. https://doi.org/10.1093/biomet/93.3.491.
16. Wu J, Liu CY, Chen WT, Ma WY, Ding Y. A new method for estimating the number of non-differentially expressed genes. Genet Mol Res. 2016a;15:13– 28.https://doi.org/10.4238/gmr.15017402.
17. Wu WW, Nishikawa H, Fukudal T, Vittal V, Asano M, Miyoshi Y, et al. Interaction of BARD1 and HP1 is required for BRCA1 retention at sites of DNA damage. Cancer Res. 2016b;75:1311–21. https://doi.org/10.1158/0008-5472.can-14-2796.
18. Burbelo PD, Arnbatipudi K, Alevizos I. Genome-wide association studies in Sjögren’s syndrome: what do the genes tell us about disease pathogenesis? Autoimmun Rev. 2014;13:756–61.https://doi.org/10.1016/j.autrev.2014.02.002. 19. Li WX, He K, Tang L, Dai SX, Li GH, Lv WW, et al. Comprehensive
tissue-specific gene set enrichment analysis and transcription factor analysis of breast cancer by integrating 14 gene expression datasets. Oncotarget. 2017b;8:6775–86.https://doi.org/10.18632/oncotarget.14286.
20. Daino K, Imaoka T, Morioka T, Tani S, Iizuka D, Nishimura M, et al. Loss of the BRCA1-interacting helicase BRIP1 results in abnormal mammary Acinar morphogenesis. PLoS One. 2013;8:e74013.https://doi.org/10.1371/journal. pone.0074013.
21. Marsden CG, Jensen RB, Zagelbaum J, Rothenberg E, Morrical SW, Wallace SS, et al. The tumor-associated variant RAD51 G151D induces a hyper-recombination phenotype. PLoS Genet. 2016;12:e1006208.https://doi.org/ 10.1371/journal.pgen.1006208.
22. Wan XC, Pu HL, Huang WH, Yang S, Zhang YL, Kong Z, et al. Androgen-induced miR-135a acts as a tumor suppressor through downregulating RBAK and MMP11, and mediates resistance to androgen deprivation therapy. Oncotarget. 2016;7:51284–300.https://doi.org/10.18632/oncotarget.9992. 23. Rasmussen RD, Gajjar MK, Tuckova L, Jensen KE, Maya-Mendoza A, Holst CB,
et al. BRCA1-regulated RRM2 expression protects glioblastoma cells from endogenous replication stress and promotes tumorigenicity. Nat Commun. 2018;9:5396.https://doi.org/10.1038/s41467-018-07892-6.
24. Lee J, Gollahon L. Mitotic perturbations induced by Nek2 overexpression require interaction with TRF1 in breast cancer cells. Cell Cycle. 2013;12: 3599–614.https://doi.org/10.4161/cc.26589.
25. Nunes AM, Wuebbles RD, Sarathy A, Fontelonga TM, Deries M, Burkin DJ, et al. Impaired fetal muscle development and JAK-STAT activation mark disease onset and progression in a mouse model for merosin-deficient congenital muscular dystrophy. Hum Mol Genet. 2017;26:2018–33.https:// doi.org/10.1093/hmg/ddx083.
26. Zhao JK, Ou BC, Han DP, Wang PX, Zong YP, Zhu CC, et al. Tumor-derived CXCL5 promotes human colorectal cancer metastasis through activation of the ERK/Elk-1/snail and AKT/GSK3β/β-catenin pathways. Mol Cancer. 2017; 16(1):70.https://doi.org/10.1186/s12943-017-0629-4.
Publisher’s Note