Painter et al. Anim Biotelemetry (2016) 4:20
DOI 10.1186/s40317-016-0113-8
Use of bio-loggers to characterize red fox
behavior with implications for studies
of magnetic alignment responses
in free-roaming animals
RESEARCH
Use of bio-loggers to characterize
red fox behavior with implications
for studies of magnetic alignment responses
in free-roaming animals
Michael S. Painter
1*†, Justin A. Blanco
2†, E. Pascal Malkemper
3,5, Chris Anderson
2, Daniel C. Sweeney
4,
Charles W. Hewgley
2, Jaroslav Červený
5, Vlastimil Hart
5, Václav Topinka
5, Elisa Belotti
5, Hynek Burda
3,5and John B. Phillips
1Abstract
Background: Spontaneous magnetic alignment (SMA), in which animals position their body axis in fixed alignments relative to magnetic field lines, has been shown in several classes of vertebrates and invertebrates. Although these responses appear to be widespread, the functional significance and sensory mechanism(s) underlying SMA remain unclear. An intriguing example comes from observations of wild red foxes (Vulpes vulpes) that show a ~fourfold increase in hunting success when predatory ‘mousing’ attacks are directed toward magnetic north-northeast. This form of SMA is proposed to receive input from a photoreceptor-based magnetoreception mechanism perceived as a ‘visual pattern’ and used as a targeting system to increase the accuracy of mousing attempts targeting hidden prey. However, similar to previous observational studies of magnetic orientation in vertebrates, direct evidence for the use of magnetic cues, and field-based experiments designed to characterize the biophysical mechanisms of SMA are lack-ing. Here, we develop a new approach for studies of SMA using triaxial accelerometer and magnetometer bio-loggers attached to semidomesticated red foxes.
Results: Accelerometer data were recorded from 415 ground-truth events of three behaviors exhibited by an adult red fox. A 5-nearest neighbor classifier was developed for behavioral analysis and performed with an accuracy of 95.7% across all three behaviors. To evaluate the generalizability of the classifier, data from a second fox were tested yielding an accuracy of 66.7%, suggesting the classifier can extract behaviors across multiple foxes. A similar classifica-tion approach was used to identify the fox’s magnetic alignment using two 8-way classifiers with differing underlying assumptions to distinguish magnetic headings in eight equally spaced 45° sectors. The magnetic heading classifiers performed with 90.0 and 74.2% accuracy, suggesting a realistic performance range for a classifier based on an inde-pendent set of training events equal in size to our sample.
Conclusions: We report the development of ‘magnetic ethograms’ in which the behavior and magnetic alignment of foxes can be accurately extracted from raw sensor data. These techniques provide the basis for future studies of SMA where direct observation is not necessary and may allow for more sophisticated experimental designs aimed to characterize the sensory mechanisms mediating SMA behavior.
Keywords: Accelerometer, Magnetometer, Magnetoreception, Spontaneous magnetic alignment, Light-dependent, Compass, Red fox, Radio-frequency, Vulpes vulpes
© The Author(s) 2016. This article is distributed under the terms of the Creative Commons Attribution 4.0 International License (http://creativecommons.org/licenses/by/4.0/), which permits unrestricted use, distribution, and reproduction in any medium, provided you give appropriate credit to the original author(s) and the source, provide a link to the Creative Commons license, and indicate if changes were made. The Creative Commons Public Domain Dedication waiver (http://creativecommons.org/ publicdomain/zero/1.0/) applies to the data made available in this article, unless otherwise stated.
Open Access
*Correspondence: [email protected]
†Michael S. Painter and Justin A. Blanco contributed equally to this work and are co-first authors
Background
Recent advances in bio-logging technology and its increasing deployment in studies of animal behavior and physiology are providing new approaches to investigat-ing both large-scale and fine-scale properties of spatial behavior in domestic and free-roaming animals [1–3]. Among the many sensor options, triaxial accelerometers can yield a wealth of valuable information about move-ments in three-dimensional space, but need sophisticated analysis techniques to be properly interpreted [4]. There is no consensus on the statistical techniques to use in extracting behavioral data from accelerometer signatures; the available methods have been shown to have varying degrees of success in identifying differences in behavior and posture across a range of diverse kinematic patterns [5, 6]. In addition to accelerometers, bio-logging devices equipped with triaxial magnetometers are now avail-able, providing researchers with a continuous record of the alignment of the sensor with respect to magnetic north. Therefore, if the alignment of the sensor is in a known and fixed alignment with respect to the animal, the magnetic heading of the individual can be identified. However, transforming raw magnetometer data into reli-able directional headings of free-roaming subjects poses several challenges [4, and see “Methods”]. Yet despite the technical obstacles, developing behavioral classifiers that can reliably identify behaviors of interest from acceler-ometer signatures time-synched with magnetacceler-ometer data has the potential to provide investigators with a record of spatiotemporal behavior in animals inhabiting diverse environments where direct observation may not be pos-sible, or in animals where direct observation may influ-ence behavior (i.e., observer bias).
In particular, ‘magnetic bio-loggers’ used in studies of animal navigation and orientation could provide impor-tant new evidence for behavioral responses dependent on the geomagnetic field [7–14]. For example, several studies have reported evidence of spontaneous magnetic alignment (SMA) behavior across a range of vertebrates that show a strong tendency to align the anteroposte-rior axis bimodally along the north–south magnetic axis [for reviews see 15, 16, and recently 17]. Although SMA appears to be widespread, exhibited by a wide range of taxa including both vertebrate [15, 16, 17, 18] and inver-tebrate groups [19–22], the functional significance and biophysical mechanism mediating this behavior remains poorly understood. Possibilities of the functional signifi-cance underlying SMA include that the magnetic field could provide a stable reference frame for coordinating movement in open landscapes [23], or help to coordi-nate group responses in social animals [24]. Furthermore, magnetic alignment has been proposed to be involved in retinotopic matching in honeybees, helping to recognize
familiar environments [25], and may simplify encod-ing the spatial relationships between landmarks and/or help to place local maps of space into register [26]. Given the utility of magnetic cues underlying diverse spatial behaviors, it is clear that the magnetic field is not used only as source of ‘simple’ directional information, but rather may play a more general role in organizing and structuring spatial behavior and cognition. Therefore, SMA may reflect a basic form of spatial positioning to optimize the use of magnetic input for more complex spatial behaviors. However, the majority of vertebrate SMA studies have relied on field observations, which are difficult to conduct following double-blind proto-cols, are subject to observer bias, and are not well suited for experimental manipulations needed to confirm that alignment responses are directly mediated by magnetic cues. Furthermore, field studies have not implemented experimental designs aimed to characterize the sensory mechanisms underlying SMA that will be critical for helping to determine the functional significance of this widespread behavior.
magnetic field lines, the inclination of the pattern of ‘visual’ input generated by a light-dependent magnetic mechanism could be used to estimate distance. Specifi-cally, in the northern hemisphere, the magnetic field lines re-enter the Earth at increasing angles with increasing latitude, and therefore, some components of the three-dimensional visual pattern would be superimposed on the substrate below the level of the retina [for additional details and proposed three-dimensional patterns see 26, 34, 38–40]. The inclination of the magnetic field would not vary substantially (e.g., ~0.1°) over a fox’s home range [41], and therefore, the fox could approach the prey along a fixed compass heading until some component of the visual pattern generated by the light-dependent magnetic mechanism was superimposed on the sound source gen-erated by a prey hidden beneath the substrate (analogous to centering the ‘cross-hairs’ of a gun sight), enabling the fox to initiate mousing attacks from a fixed dis-tance. Given the indirect (‘ballistic’) trajectory of mous-ing attacks, the accuracy of such attacks may be greater if they are initiated from a fixed distance and performed using a stereotyped set of mousing mechanics. Interest-ingly, the small clustering of successful mousing attacks directed toward magnetic south [27] suggests that the opposite end of the magnetic axis may also guide mous-ing behavior, and is consistent with an axially symmetri-cal pattern of magnetic input as proposed by [26, 34, 40]. Therefore, SMA in red foxes is thought to result from the fox aligning components of the visual pattern, providing a targeting system helping to estimate the distance of the unseen prey, increasing the likelihood of successful prey capture [27].
Here, we report the development of magnetic bio-logging techniques for future studies of SMA in free-roaming red foxes that will likely provide new approaches to studying other forms of magnetic behaviors across a range of terrestrial animals. Semi-tamed red foxes trained to exhibit ‘mousing-like’ leaps in outdoor enclo-sures were used to develop ‘magnetic ethograms’ to pro-vide templates for data collection from free-roaming animals in the wild. Three predetermined behaviors per-formed in varying magnetic directions were videotaped to serve as ground-truth data. Raw accelerometer data were then used to establish classifiers ‘trained’ to identify these behaviors in unseen data sets recorded from the same individual and from a different individual exhibit-ing similar behavior. Usexhibit-ing a similar machine learnexhibit-ing algorithm approach, magnetic classifiers were developed using ground-truth video records and ‘trained’ to distin-guish between eight magnetic directions corresponding to the cardinal (i.e., N, S, E, W) and anti-cardinal (i.e., NE, SE, SW, NW) magnetic axes. Taken together, the time-synched accelerometer and magnetometer data provide
magnetic directional headings for events identified by the behavioral classifier, demonstrating the potential for bio-logging applications in studies of SMA in free-roaming foxes that can be adapted for use in studies of magnetic responses in other mammals.
This work provides the basis for future SMA research in foxes and other free-living mammals equipped with miniaturized triaxial accelerometer and magnetometer devices and, more generally, makes it possible to improve the accuracy of directional observations for magnetic alignment studies of semidomesticated and wild ani-mals and avoid potential biases inherent to observational studies. Such studies have been difficult to conduct fol-lowing double-blind protocols, are not well suited for experimental manipulations, and have been criticized for failing to provide direct evidence for the involvement of magnetic cues underlying SMA responses. We discuss the potential use of magnetic bio-loggers in field-based studies of magnetic behavior in free-roaming animals and propose specific experiments to test for the involve-ment of light-dependent and magnetite-based magnetic mechanisms underlying magnetic targeting behavior of wild red foxes that would be possible using bio-logging technologies.
Methods
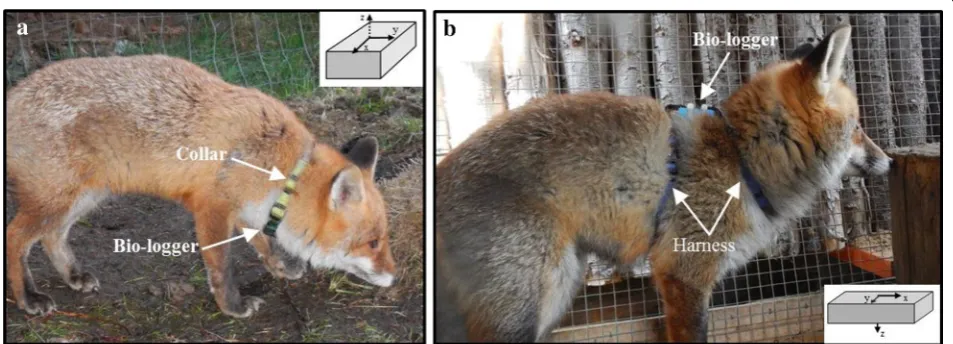
secured with two plastic zip ties to the ventral side of the collar (Fig. 1a). The device was secured to the dorsal side of the harness on Fox2 (Fig. 1b). Two identical devices were used to collect behavioral and magnetometer data from each of the foxes and were switched every ~5 days to recharge the internal battery. The units recorded con-tinuously until the battery was depleted or the device was removed from the animal. On average, two 30-min behavioral sessions were recorded each day taking place at various times between 7:00 and 19:00 local time.
Bio‑logging Recording Specifications
The X8M-3 USB accelerometer devices provided a con-tinuous stream of time-stamped accelerometer and mag-netometer data saved to a 2-GB internal flash memory drive. The devices included a ±8 g accelerometer with a 14-bit analog-to-digital converter yielding 0.001 g measurement resolution on each axis. The magnetom-eter was programmed to operate over a ±400 µT range with measurements approximated to within ±111 nT on the x- and y-axes and ±125 nT on the z-axis. For all data collected, triaxial accelerometer data were recorded at a sampling rate of 6 Hz and the magnetometer data were recorded at 3 Hz. An internal lithium-ion poly-mer battery powered the device and when fully charged
would run continuously for ~130 h in these sample rate configurations.
Behavioral recording sessions
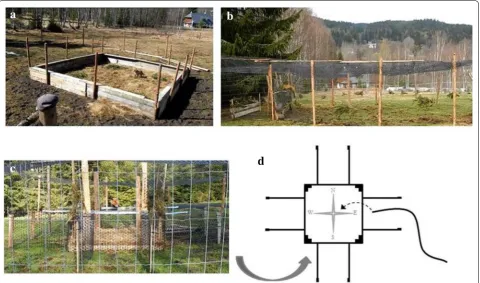
During the 30-min recording sessions, all behaviors were videotaped using a digital camera (Nikon Coolpix AW110) mounted on a tripod located approximately 1 m outside the observation arena. During each recording session, the fox was released from its home cage directly into a circular open field arena (~25 m diameter) where it was allowed to roam freely. At no point were the two foxes in the arena at the same time. The perimeter of the arena was secured using 1.5-m-tall aluminum mesh fencing, and the top of the arena was covered with plas-tic mesh to ensure the fox did not escape during trials. Additional structures were constructed inside the obser-vational arena and used for behavioral and magnetic data collection (described immediately below).
Behavioral data were collected from Fox2 inside a 10 m × 10 m square enclosure with walls 1-m-tall con-structed of wooden boards located in the center of the observation arena (Fig. 2a and see Additional file 2: Video file S1, Additional file 3: Video file S2). The fox was placed inside the enclosure and allowed to forage for food pel-lets and live wood mice hidden under small brush piles Fig. 1 Photographs of the two adult red foxes (Vulpes vulpes) used to develop magnetic ethograms equipped with triaxial accelerometer and magnetometer bio-logging devices. a Fox1—modified Kong Comfort Dog Harness (collar portion only) equipped with Gulf Coast Data Concept bio-logging device attached to the ventral side of collar beneath the neck. The long axis of the device is aligned perpendicular to the spine. b
composed of straw and pine branches. After a foraging bout, typically less than 3 min, the fox would jump out of the square enclosure and return to the home cage. Unfor-tunately, Fox2 was stolen from its home cage shortly after beginning the behavioral recording sessions. Therefore, only a limited amount of behavioral data was obtained from this subject. As a result of the limited number of recording sessions and relatively primitive square enclosure used to collect behavioral data, the behaviors recorded from Fox2 were more variable and erratic rela-tive to those of Fox1.
Most of the behavioral data were collected from Fox1. This fox was trained using two different obstacles built inside the observational arena, both designed to encour-age the fox to perform ‘mousing-like’ leaps. One obsta-cle made of wooden boards and plastic netting stretched across the entire arena at a height of ~1 m. An observer inside the arena trained the fox to jump over the obstacle by tossing a food reward (one piece of dog food) on the
opposite side of the obstacle. In an attempt to make the jumps mimic natural mousing behavior, in which the fox performs a high vertical jump followed by a rapid decel-eration as it lands on top of its prey, a second barrier was placed ~1 m beyond the first obstacle so that when the fox jumped over the first obstacle it had to stop immedi-ately after landing to prevent a collision with the second wooden barrier (Fig. 2b and see Additional file 4: Video file S3).
file S5). ‘Mousing-like’ leap data for Fox1 were collected using both of the obstacles described above. Magnetom-eter data were analyzed from Fox1 only using the arena with the attached corridors aligned along the cardinal compass directions to obtain more precise ground-truth magnetic data from time points when Fox1 was in car-dinal (i.e., 0°, 90°, 180°, 270°) and anti-carcar-dinal (i.e., 45°, 135°, 225°, 315°) magnetic alignments.
When the bio-logging unit was removed every ~5 days, the accelerometer and magnetometer data were down-loaded. Each of the 30-min video recording sessions was partitioned into separate data files. The video was then replayed and manually analyzed for three discrete behav-iors: trotting, foraging, and ‘mousing-like’ leaps over the barriers described above. These behaviors were chosen a priori with no knowledge about the acceleration signa-tures underlying each behavior. Mousing, trotting, and foraging behaviors are performed with distinct patterns of movement and have been observed in wild foxes (pers. observ.) and therefore were used to develop a behavioral classifier that would satisfy the focus of the current study (i.e., mousing behavior) and identify other functionally relevant behaviors for future bio-logging studies in red foxes. Trotting was defined as moving through the arena at a pace where two of the four paws were not in contact with the ground, but without the rapid horizontal accel-erations and high rate of speed associated with sprinting behaviors (see Additional file 7: Video file S6) [6]. For-aging was defined as the fox slowly moving through the arena (slower pace than a walk) with its head and snout toward the ground searching for food using olfactory and visual cues (see Additional file 8: Video file S7). A ‘mousing-like’ leap was defined for Fox1 as jumping over the vertical barrier in either of the obstacles described above (Additional file 4: Video file S3, Additional file 5: Video file S4), or in the case of Fox2, out of the sides of the square enclosure (see Additional file 2: Video file S1, Additional file 3: Video file S2). Based on preliminary visual observations, a typical jump lasted ~2 s (~0.5 Hz) and the predominant oscillations in trotting and forag-ing behaviors did not exceed 3 Hz. Therefore, in order to fulfill the Nyquist sampling criterion which requires the sampling rate to be greater than twice the highest fre-quency of the signal components used to characterize the events of interest, the accelerometer sampling rate was programmed to record at 6 Hz after low-pass filtering to minimize aliasing [42].
Statistical analysis
Accelerometer data analysis
All accelerometer and magnetometer data were analyzed in MATLAB (MathWorks, Natick, MA). Cross-validation was used to estimate how the classifier would perform on
new, unseen accelerometer data. Prior to analysis, indi-vidual behaviors (i.e., ‘mousing-like’ leap, foraging, and trotting) were identified using raw video records. For each behavioral event, 15-sample segments, correspond-ing to 2.5 s of data given the accelerometer’s samplcorrespond-ing rate of 6 Hz, were extracted and used for analysis. The 2.5-s window duration was chosen under the hypothesis that it would be long enough to characterize and distin-guish, leaping, foraging, and trotting activity while short enough to minimize errors due to overlapping events and to maintain the practicability of real-time processing. In order to determine whether the preselected behaviors could be distinguished based on the acceleration signa-tures, a 5-nearest neighbor classifier was used, in which unknown (i.e., ‘test’) behaviors are classified by a ‘major-ity vote’ of their 5 nearest known (training) neighbors in a feature space. Expanded details of the behavioral clas-sification method are provided in “Accelerometer Feature Extraction” and “Behavioral Classification” sections.
Accelerometer feature extraction
Each 15-sample data segment was zero-meaned prior to extracting the following four time-domain features: (1) the magnitude of the largest z-axis peak; (2) the time delay between the two largest z-axis peaks; (3) the energy in the output of a matched filter run on the z-axis; and (4) the energy in the output of a 2-Hz high-pass fil-ter, averaged over the x- and y-axes. The matched filter used for feature 3 was a simple four-sample rectangular pulse with height 1 g. For feature 4, the data on both the x- and y-axes were first normalized to have unit energy; a third-order Butterworth high-pass filter [43] with a −3 dB point of 2 Hz, chosen for its maximally flat pass-band response, was then applied to each axis. Features 1 and 2 were designed to be selective for leaping events, which were expected to have large-magnitude verti-cal acceleration components; feature 3 was designed to be selective for foraging events, which were expected to have a relatively stable vertical axis acceleration profile; and feature 4 was designed to be selective for relatively high-frequency rhythmic trotting activity. The features were deliberately chosen to have some robustness to dif-ferences in accelerometer orientation, which can arise due to both movement and differences in mounting of the triaxial accelerometer, requiring only that one axis was known to be at least nominally aligned (at either 0° or 180°) with respect to vertical.
Behavioral classification
between corresponding feature values). K-nearest neigh-bor (k-NN) is a standard nonparametric technique for performing supervised learning tasks such as classifica-tion. It can be viewed as an approximation to the optimal but practically unrealizable Bayes classifier, which assigns an observation to the most likely of a predetermined set of classes given its feature measurements. In k-NN, the probability that an unknown observation belongs to a particular class is estimated by the fraction of its k closest training set neighbors belonging to that class. The pre-dicted class label is then the class with the highest prob-ability. Tenfold cross-validation was used to estimate test set error. That is, the entire data set was partitioned into ten randomly chosen disjoint subsets of approximately equal size, nine of which were used for training the clas-sifier and the other for testing on each of ten iterations. Each subset served as the testing data exactly once. The overall estimate of test set error was obtained as an aver-age of the test set errors achieved on each of the ten iterations.
Magnetometer data analysis
We defined the animal’s magnetic heading (hereafter referred to as heading) as the angle between the posterior to anterior alignment of the spine, assumed to be rigid, and the direction of the Earth’s magnetic field when both of these lines are projected onto the plane perpendicular to the gravity vector. A number of uncertainties associ-ated with the free-roaming animal paradigm make it chal-lenging to infer the animal’s heading based upon triaxial magnetometer and accelerometer data. For example, due to the animal’s normal movements, all of the following alignments are known only imprecisely: (1) alignment of the sensor relative to the fox’s collar; (2) alignment of the collar relative to the fox’s neck; and (3) alignment of the fox’s neck relative to the rest of its spine. Additionally, it is reasonable to assume that a fox may slightly alter its heading on the timescale of a single magnetometer sam-ple (0.33 s), leading to the potential measurement of sen-sor transient responses that add further noise to the data. Traditional tilt-compensation algorithms [e.g., 44] that attempt to use triaxial accelerometer data to sense device orientation and apply the appropriate trigonometric cor-rections to heading estimates are not reliable under these conditions because they assume an unchanging reference mounting orientation; in other words, they assume that the mapping (rotation matrix) between the coordinate frame of the sensor and the coordinate frame of the fox’s body remains constant.
To deal with the uncertainties outlined above, we framed the heading estimation problem as a super-vised learning task, and in particular, as a classification task. While in principle we could have treated this as a
regression, our video-labeling method of ground-truth-ing had limited resolution, and therefore, we used an 8-way classification task with the four cardinal and four anti-cardinal directions comprising the complete set of eight possible headings. This amounts to binning con-tinuous headings using eight 45° sectors. Specifically, we sought to estimate the fox’s heading with this degree of resolution given the acceleration and magnetic field strength measurements along the three orthogonal (x, y, z) axes of the sensor. Inputs to the classifier were thus the six-element vectors formed by concatenating the three accelerometer and three magnetometer measurements. We hypothesized that the optimal boundaries between each of the classes in this six-dimensional input space would be highly nonlinear due to the aforementioned sources of noise and therefore used random forest clas-sification [45], which is capable of learning nonlinear boundaries while simultaneously mitigating overfitting.
Random forests offer improved predictive accuracy over single decision tree classifiers by smoothing pre-dictions over an ensemble of related trees. Detailed reviews of tree-based classification, and random for-ests in particular, can be found in [46]. In brief, decision tree classifiers seek to optimally partition input space into a series of non-overlapping hyper-rectangles using labeled training data. Once the partitioning is learned, new observations are classified according to the region (hyper-rectangle) of input space into which they fall. Spe-cifically, they are assigned the class label most frequently occurring among the training data points falling into the same region.
Because exhaustively searching over all possible unique partitionings of input space is generally computation-ally intractable, it is standard to use a greedy, top-down approach known as recursive binary splitting. At the start of the procedure (i.e., at the top (root) node of the tree), each training observation belongs to the same region. On each successive iteration, the algorithm chooses the single input feature and cut point (feature value), across all current regions, that leads to the greatest reduction in some objective function. It then forms two new regions by dividing the selected region in accordance with the chosen feature–cut point combination and continues the splitting procedure until a stopping criterion is met. In this work, we use the Gini index [47] in region m, Gm:
as the basis for the objective function, where K, the num-ber of classes (headings), is 8 in our case, and pˆmk is an
estimate of the probability that an observation in the mth hyper-rectangular region belongs to the kth class. The
Gm=
K
k=1
ˆ
latter is computed as the fraction of training observa-tions within the mth region having the class label k. Gm
can be interpreted as an estimate of what the misclassi-fication rate for observations falling into region m would be if observations were randomly classified according to the distribution of classes in that region. It measures the class impurity of region m, being smallest (zero) when all observations in the region fall into a single class and larg-est when the distribution of observations across classes is constant.
The objective at each stage of the binary recursive split-ting procedure is to find the region and split that leads to the smallest weighted sum of Gini indices across regions (where the weights are equal to the number of observa-tions in each region). We stop the binary recursive split-ting procedure when no split can be found that decreases the objective. Since this procedure is prone to growing deep trees that overfit the training data and therefore have poor generalization performance, it is typically aug-mented using some type of statistical method to reduce the variance of the learned model.
Random forests accomplish this variance reduction by learning separate trees on B (here B = 1000) boot-strapped data sets [48] of size equal to that of the origi-nal training data, formed by randomly sampling with replacement from the original training data. Further-more, when considering each split for particular tree, only a random subset of j input features (here j = 2) are considered as potential candidates for the split. This has the effect of producing B trees that are less correlated than those that would be learned if the full set of input features were considered on each iteration, and hence a final classifier with lower variance and better generaliza-tion performance. Specifically, the final random forest classifier, Crf, assigns its class labels according to:
where −→x is the input vector and the right side of the
equation denotes a plurality vote among the class predic-tions made for −→x by each of the B single-tree classifiers
learned on a separate bootstrap sample.
Magnetometer classifier training
To form a ground-truth data set for training the random forest classifier, a total of 381 samples recorded during 66 distinct heading events were assigned one of eight magnetic heading labels (N, NE, E, SE, S, SW, W, NW) by consensus between two human reviewers. Assign-ments were made based on reviewing video recordings of Fox1 behaving in the vicinity of the four-arm maze (Fig. 2c) aligned along the cardinal compass axes. There-fore, ground-truth heading classifications in the cardi-nal and anti-cardicardi-nal directions could be identified by
Crf(−→x)=mode{Cb(−→x)}Bb=1
using the maze as a reference. Distinct heading events were identified as time-separated occasions on which the fox appeared to maintain a consistent heading for at least 0.5 s. The duration of the consistent-heading period determined how many samples were collected for each heading event.
Results
Behavioral classification
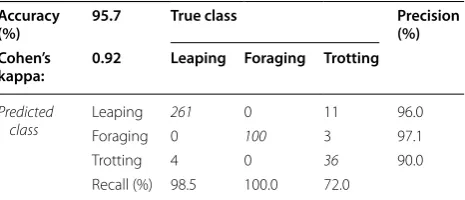
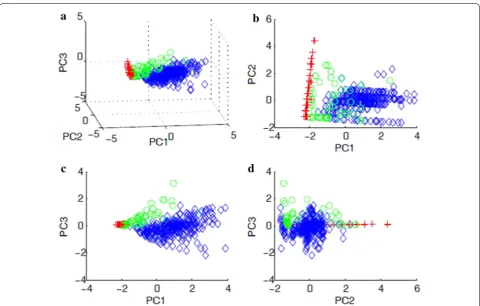
A total of 415 events from Fox1 trained to the two obsta-cles were manually identified using video records and input into the classifier. Of the 415 events, 265 (64%) were ‘mousing-like’ leaps, 100 (24%) were foraging, and 50 (12%) were trotting. Overall classification accuracy was 95.7% (chance performance with a null model of equiprobable classes is 33.3%; chance performance with a null model obtained by assigning each observation to the most frequent class is 63.9%; Table 1). The error rates for each class, leaping, foraging, and trotting, respec-tively, were 0.015, 0.00, and 0.28. Unsurprisingly, given its relative infrequency, trotting behavior was the most difficult to classify, with 11/50 trotting events misclas-sified as leaping and 3/50 as foraging (Table 1 and see “Discussion”). Accelerometer data showed stereotypi-cal acceleration signatures recorded on each axis of the three behaviors used in the classifier (Fig. 3). Figure 4 shows the data plotted in the three-dimensional space given by the first three principal components projections after z scoring (i.e., subtracting the mean and dividing by the standard deviation of each feature), as well as in the two-dimensional spaces defined by all possible pairs of the first three principal components. Z scoring and PCA were employed only to facilitate viewing the four-dimen-sional feature data in three dimensions and were not used as processing steps prior to classification.
Table 1 Confusion matrix showing tenfold cross-valida-tion performance of the 5-nearest neighbor classificacross-valida-tion algorithm run on Fox1
The results displayed in this matrix can be viewed as estimates of how well the classifier, trained on data from Fox1, would perform on new, unseen data from this same fox
Italicized values indicate cases where ground-truth behaviors (i.e. ’true class’) match classifier prediction (i.e. ’predicted class’)
Accuracy
(%) 95.7 True class Precision (%) Cohen’s
kappa: 0.92 Leaping Foraging Trotting
Predicted
class Leaping
261 0 11 96.0
Foraging 0 100 3 97.1
Trotting 4 0 36 90.0
Generalizability of the classifier to new foxes
To the extent that foxes perform mousing-like leaps, for-aging, and trotting in a stereotyped way, one would expect our classifier to accurately distinguish these behaviors in new, free-living foxes. A small amount of data (33 events) from Fox2 were recorded prior to its removal from the study and used to test the classifier’s ability to generalize across foxes not used to train the classifier. It should be noted that this fox had much less experience perform-ing the behaviors of interest and was trained usperform-ing a dif-ferent type of obstacle compared to Fox1 (see “Methods”, “Behavioral recording sessions” and Additional file 2: Video file S1, Additional file 3: Video file S2, Additional file 4: Video file S3, Additional file 5: Video file S4, Addi-tional file 6: Video file S5), and therefore, its ‘mousing-like’ leaps differed from Fox1 used to collect the majority of
the severity of the impact is difficult to estimate without a quantitative understanding of other orientation differ-ences. No changes were made to the data processing chain to customize the classifier for Fox2 before testing; Fox2 was simply tested using a classifier trained exclusively on
data from Fox1. Results were particularly encouraging in light of the different mounting schemes and will likely improve if mounting can be standardized in future work. See “Discussion” for other factors that could contribute to decreased classifier performance across individuals and possible solutions to mitigate these sources of error for more accurate and reliable behavioral data in future stud-ies involving wild foxes.
Magnetometer data
Classification results
As previously mentioned, the duration of the consistent-heading period determined how many samples were col-lected for each heading event. The number of samples per event ranged from 2 to 29 with a mean of 5.77 ± 5.16 (mean ± 1 SD). Table 3 shows a detailed breakdown of events and samples for each of the eight heading directions.
We performed two separate classification analyses. The first implicitly assumed that all samples collected from a given heading were independent draws from the same unknown class-conditional probability density Fig. 4 a Scatter plot of data collected from Fox1 in the three-dimensional space given by the first three principal component projections after
z scoring (i.e., subtracting the mean and dividing by the standard deviation of each feature). Note that z-scoring and PCA were done strictly to facilitate viewing the four-dimensional feature data in three dimensions; they were not employed as processing steps prior to classification. b–d
Two-dimensional projections onto all possible pairs of the first three principle components. Blue= leaping; red= foraging; green= trotting
Table 2 Confusion matrix showing performance of the 5-nearest neighbor classification algorithm trained on data from Fox1 and tested on data from Fox2
The results displayed in this matrix can be viewed as estimates of how well the classifier, trained on Fox1, would perform on new, unseen data from a different fox
Italicized values indicate cases where ground-truth behaviors (i.e. ’true class’) match classifier prediction (i.e. ’predicted class’)
Accuracy
(%): 66.7 True class Precision (%) Cohen’s
kappa: 0.50 Leaping Foraging Trotting
Predicted
class LeapingForaging 73 05 06 100.035.7
Trotting 0 2 10 83.3
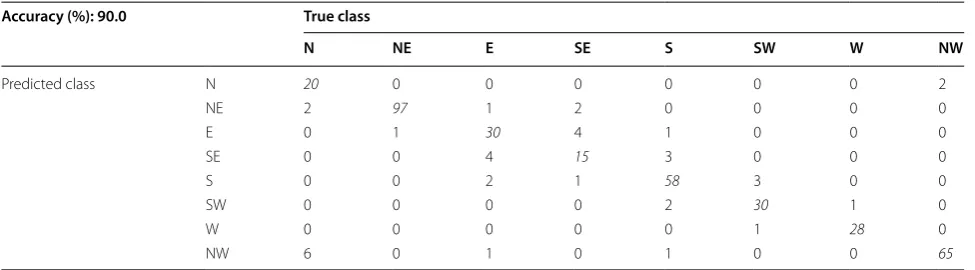
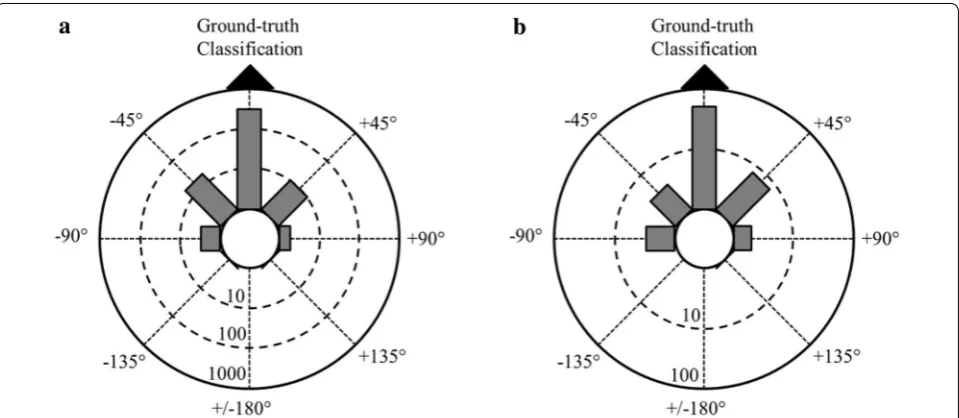
function. Each sample was therefore treated as an indi-vidual observation (i.e., object for which a heading esti-mate is desired), giving a total number of observations of 381. Using tenfold cross-validation to estimate the gen-eralization performance of the random forest classifier, the accuracy achieved was 90.0%. Table 4 lists the com-plete confusion matrix for the first classifier, which shows performance on a per-heading basis. A Rayleigh test was used to test for non-random clustering of magnetic head-ings, as predicted by the classifier, relative to ground-truth classifications determined by a human observer [49]. Therefore, data were pooled with respect to ground-truth predictions in each of the eight magnetic direc-tions and plotted as the degree of error for each sample, regardless of the ‘true’ or absolute bearing for a given sample (Fig. 5). All circular statistics were performed using Oriana 4.0, Kovach Computing Services, and for each analysis, the data were treated as eight equal width groups, each width equal to 45°. Treating each sample as an independent point from the overall data set resulted in the following: sample size, n = 381, mean vector of the distribution, µ = 359°, r value = 0.95, where r represents the mean vector length of a circle with radius = 1, and
p < 1 × 10⁻¹² (Fig. 5a).
The second analysis replaced the assumption that all samples from a given heading were class-conditionally independent with the less-stringent assumption that only events within a given heading represented independ-ent draws. This accounts for potindepend-ential time correlations
among the samples within an event that might optimis-tically bias the measure of generalization performance. Individual observations in this second analysis were therefore heading events rather than samples and were computed by averaging the samples collected during each event. Collapsing the data set in this way yielded a train-ing set with 66 observations, one for each of the head-ing events identified by the human reviewers. The tenfold cross-validated accuracy for the random forest classifier learned in this setting was 74.2%, and the complete con-fusion matrix is given in Table 5. Testing for non-random clustering of classifier predictions relative to ground-truth classifications when each event was treated as an independent point from the overall data set resulted in the following: sample size, n = 66, mean vector of the distribution, µ = 2°, r value = 0.87, where r represents the mean vector length of a circle with radius = 1, and
p < 1 × 10⁻¹² (Fig. 5b).
Discussion
The use of bio-logging technologies to help characterize spatial behavior and the underlying sensory mechanisms mediating magnetic alignment is a promising technique for future studies of free-roaming animals. In particular, the development of the behavioral ethogram coupled with time-synched recordings of magnetic headings pro-vides a powerful tool to collect unbiased and noninva-sive behavioral and magnetic data from wild foxes in the absence of direct observation. These techniques can also Table 3 Summary of the data set used to train the random forest classifier
An event corresponds to a time interval during which the fox was judged by human reviewers to be maintaining a consistent heading. Samples are six-element vectors of concatenated x, y, z accelerometer and magnetometer measurements, collected with a 3-Hz sampling rate during each event
N NE E SE S SW W NW
Num. events 8 12 9 7 11 4 7 8
Samples/event (mean ± 1 s.d.) 3.50 ± 1.60 8.17 ± 6.46 4.20 ± 1.56 3.10 ± 0.378 5.90 ± 2.91 8.50 ± 10.4 4.10 ± 2.12 8.40 ± 8.60
Total num. samples 28 98 38 22 65 34 29 67
Table 4 Confusion matrix for the random forest classifier treating each sample as an observation
Italicized values indicate cases where ground-truth headings (i.e. ’true class’) match classifier prediction (i.e. ’predicted class’) Accuracy (%): 90.0 True class
N NE E SE S SW W NW
Predicted class N 20 0 0 0 0 0 0 2
NE 2 97 1 2 0 0 0 0
E 0 1 30 4 1 0 0 0
SE 0 0 4 15 3 0 0 0
S 0 0 2 1 58 3 0 0
SW 0 0 0 0 2 30 1 0
W 0 0 0 0 0 1 28 0
be adapted for deployment in magnetic studies of a vari-ety of terrestrial vertebrates, an exciting potential given the growing evidence for SMA responses across diverse taxa [15–17, 24]. Although similar devices (i.e., acceler-ometer and magnetacceler-ometer bio-loggers) have been used to characterize spatial behavior in free-roaming mals, extracting magnetic compass headings from ani-mals moving in three-dimensional space is much more challenging and is rarely reported in behavioral stud-ies. The first attempt to use magnetic sensors to record directional behavior in free-living animals monitored
changes in magnetic measurements over time using a fluid-filled ship’s compass equipped with Hall sensors to determine activity patterns in sea turtles [50]. A more recent study of flight paths in Andean condors equipped with bio-loggers was able to identify when birds were cir-culating within thermals using the sine wave signatures of compass measurement readouts, indicating the bird was rotating through 360° in the horizontal plane [51]. However, magnetic compass headings were not reported and only circular vs straight flight path trajectory could be derived from the information provided. Magnetic Fig. 5 Radial circular plots showing magnetic classifier prediction relative to ground-truth classification made by a human observer. Classifier predi-cations are pooled relative to ground-truth classification (black triangle at top of circle, i.e., 0°), and the seven other possible classifications headings are shown on the periphery of the circle indicating the degree of error in classifier prediction (positive values indicate clockwise error; negative values indicate counter-clockwise error). The length of each gray bar extending from the center of the circle represents the number of classifications that fall within the 45° bin for that particular direction. The numbers on each dashed circle inside the plot indicate the number of observations (i.e., classification predictions) needed to reach that radius, and note that these are shown on a logarithmic scale. a Distribution of classifier predictions relative to ground-truth observations when treating each sample as an independent data point (n= 381, µ= 359°, r= 0.95, p < 1 × 10⁻¹²). b
Distribution of classifier predictions relative to ground-truth observations when treating each event as an independent data point (n= 66, µ= 2°,
r= 0.87, p < 1 × 10⁻¹²)
Table 5 Confusion matrix for the random forest classifier treating each event as an observation
Italicized values indicate cases where ground-truth headings (i.e. ’true class’) match classifier prediction (i.e. ’predicted class’) Accuracy (%): 74.2 True class
N NE E SE S SW W NW
Predicted class N 7 0 0 0 0 1 0 2
NE 0 9 1 1 0 0 0 1
E 0 2 8 0 1 0 0 0
SE 0 0 0 5 1 0 0 0
S 0 0 0 1 9 1 0 0
SW 0 0 0 0 0 0 0 0
W 0 0 0 0 0 1 6 0
heading data were reported in studies of pinnipeds that deployed triaxial sensors to measure changes in mag-netic field intensity helping to reconstruct dive paths [52, 53]. However, the accuracy of the heading estimates was not reported or verified by ground-truth data, and it is unclear whether the devices were calibrated prior to deployment, as the magnetic output of each axis var-ies with device orientation and could lead to large errors when calculating magnetic headings [4].
Using a k-NN technique for behavioral classification, we have shown that three distinct behaviors can be iden-tified with a 95.7% rate of accuracy when tested against unseen data from the same individual (Fox1) that was not used to train the classifier. As given in Table 1, trotting behavior was by far the most difficult to classify. How-ever, the trots misclassified as leaping represented a false positive rate for leaping of only 4.0%. The rates of mis-classification of the three behaviors in the current study are sensitive to relative sample sizes of each behavior and may not be representative of the relative occurrence of behaviors in wild foxes. Therefore, in future studies of free-living foxes, the percentages of misclassifications will be subject to the relative occurrence of each behavior. The low percentage of misclassifications of leaping events may be overly optimistic, and the algorithm’s assignment of trotting events might be problematic depending upon the cost a particular researcher assigns to a missed trot in other types of studies. However, the precision for declar-ing a trot (i.e., the likelihood that a trot, as identified by the classifier, was indeed a trot) was 90.0%, and the recall for trotting (i.e., the percentage of total trots identified by the classifier) was 72%, much better than chance perfor-mance. Increasing the sample size for trots used to train the classifier would likely increase trotting precision and recall. In addition, implementing automated filters within the feature extraction process (e.g., z-axis max accelera-tion or peak-to-peak time interval thresholds) could be used to limit the influence of outlying training observa-tions and further ‘tune’ the classifier for any behavior of interest, e.g., ‘mousing’. Additional features that capture pre-mousing behavior (e.g., stalking and slow approach toward prey often accompanied by a brief pause prior to the mousing jump) could help to distinguish between mousing jumps and other non-predatory movements that may resemble mousing behavior. However, the foxes used in the current study did not display this type of pre-mousing behavior, and therefore, we were not able to incorporate such techniques into the algorithms.
Importantly, in the context of this study, the classifier was successful at identifying behaviors from data col-lected from a separate fox (Fox2) not used to train the classifier with an accuracy of 66.7%. These results are encouraging given the small sample size, the difference
in device mounting scheme on Fox2 (see “Methods”), and much higher behavioral variability relative to Fox1. This variability was due to differences in the design of the enclosure used to elicit mousing-like behavior, resulting in observable differences in jump approach, jump trajec-tory, and landing mechanics (see Additional file 2: Video file S1, Additional file 3: Video file S2, Additional file 4: Video file S3, Additional file 5: Video file S4, Additional file 6: Video file S5). However, even with the differences in sample size, device mounting orientations, and the behavior of Fox2, there were no false positives in identi-fication by the classifier of ‘mousing-like’ leaps (Table 2), i.e., all mousing-like leaps identified in Fox2 were indeed mousing-like leaps.
The observed performance decline for Fox2 reflects not only differences in training and natural behavior between the experimental foxes but also potentially differences in device orientation, as mentioned above, as well as other sensor-related factors, such as temporal drift and cali-bration parameter differences between devices. All of these sources of error can be mitigated to some degree in future work by protocol standardization (e.g., of behav-ioral training and device mounting) and enlargement of the sample size of foxes and sensors used to build the training set. But classifier generalization performance will ultimately be governed by how representative any training data are of fox behavior in the wild. Since any wild fox experiment will necessarily involve first captur-ing subjects in order to instrument them, one possibil-ity would be to use a protocol involving a brief classifier training period during which captive foxes are video-monitored under freely behaving conditions, perhaps in an enclosure similar to the one used in this study. Though it is unlikely that each fox would exhibit the full set of desired behaviors in this captive setting, data recorded from these sessions could be used to impart some degree of individualized tuning to the classifiers used for each fox, which would in turn result in improved performance for wild fox classifiers. Furthermore, this approach would help to confirm the generalizability of the current clas-sifier by comparing ground-truth data from the semido-mesticated foxes and wild foxes.
for future studies of SMA in red foxes. Moreover, the development of more sophisticated classifiers and using an expanded feature set could allow even greater preci-sion of behavioral identification and provide opportuni-ties to identify more complex behaviors, e.g., predatory from non-predatory leaps, and could be augmented with additional sensors such as jaw accelerometers or onboard video recording devices to identify behavioral outcomes, e.g., prey capture success or foraging habitat type.
In addition to the behavioral classification, we used a supervised learning task, specifically a classification task, to identify the magnetic compass headings of Fox1 dur-ing behaviors that parallel the behaviors preceddur-ing mous-ing attempts in wild foxes (e.g., slow, stalkmous-ing approach). Due to resolution of ground-truth video records, we used an 8-way classification task with the four cardinal and four anti-cardinal directions, and therefore, the classifier could distinguish among eight magnetic directions with a 45° resolution.
We performed two separate random forest classifi-cation analyses, the first assumed each sample was an individual observation and therefore contained a total of 381 observations. Using tenfold cross-validation to esti-mate the generalization performance of the random for-est classifier, the accuracy achieved was 90.0% (Table 4; Fig. 5a). Of note, all but 7 (1.8% of all observations) of the errors made by the classifier were ‘off-by-one’; i.e., the classifier predicted either the correct heading or one of the headings adjacent to the true heading in 98.2% of all cases. However, we recognize that this analysis may be overly optimistic since this approach did not account for potential time correlations between samples drawn from a given heading. Therefore, the second analysis lim-ited individual observations to heading events, defined in this study as periods of time when Fox1 was assigned to a consistent direction by a human reviewer. Heading events were then computed by averaging samples over each such time period. This resulted in a smaller sample size (n = 66 observations), and tenfold cross-validated accuracy for the random forest classifier learned in this setting was 74.2% (Table 5; Fig. 5b).
While it is tempting to conclude that the second analy-sis is more appropriate than the first, it should be noted that some of the observed performance decline is likely attributable to the dramatic reduction in the size of the training set used in the second analysis. It is reasonable to assume that if a larger number of events were available for training, accuracy on unseen data would fall some-where between the bounds of 74.2 and 90.0% that was achieved (Fig. 5). Of course, even a pessimistic estimate of 74.2% accuracy far outstrips a chance classifier, which would perform at 12.5% on this problem.
Whether a digital compass (i.e., heading classifier) with the degree of resolution and accuracy we present here would yield conclusive data in a larger field study involving multiple wild foxes depends on the strength and scale of any effect being measured as well as the degree of behavioral similarity across animals. The lat-ter can potentially be managed by training classifiers on individual foxes which participate in field-based studies, or across a representative group of wild and/or captive foxes. In addition, improvements in the sensor fixation and mounting technique, in the resolution of the appa-ratus and methodology used to collect and label ground-truth data, and in the size of the training data set would all likely yield improvements in the resolution and accu-racy of the classifier. In future studies designed to char-acterize the biophysical mechanisms mediating SMA, treatment groups (e.g., foxes exposed to radio-frequency fields in the low-MHz range, see below) would be pre-dicted to exhibit magnetic alignment responses indistin-guishable from random, similar to the behavioral effects of radio-frequency exposure on the magnetic compass response in migratory birds [54]. The 8-way classi-fier developed in this study is well suited to distinguish between the magnetic headings of oriented and random mousing attempts, although the strength of the orienta-tion in control group would determine the sample size needed to confirm any treatment effect. In conclusion, we are encouraged by the performance of the 8-way clas-sifiers in light of the difficulty of the problem and believe the framework established here is promising that merits further study and development.
attempt. Consistent with Červený et al.’s findings, the contribution of the proposed magnetic ‘range-finder’ (i.e., distance estimator) to the accuracy of predatory attacks could be especially pronounced when the fox’s view of the prey is obstructed by dense vegetation or snow cover [27].
Although the red fox is considered a generalist species, several studies of central European red foxes suggest that a significant proportion of their diet comes from rodents that varies depending on elevation and season. For exam-ple, one study estimates that 65% of the fox’s diet comes from rodents throughout the year [56], whereas more recent estimates suggest that >30% of their diet is com-posed of rodents (and hares), and during the winter months, small mammals make up approximately 40% of the fox’s diet [57]. Although foxes will use sight to guide the majority of predatory behaviors in habitats with low vegetation and no snow cover, even just 2 weeks of tall grass or snow would require that foxes ‘mouse’ to catch prey burrowed under the substrate, and therefore, ‘hard’ evolutionary selection is considered to underlie the fox mousing phenotype. Given the importance of mousing to fox survival, it is not surprising that multiple cues and sensory systems are involved, helping to increase the suc-cess and efficiency of mousing behavior.
Magnetic bio-loggers can provide a valuable tool for future studies of magnetic alignment in free-roaming animals, and in particular foraging wild red foxes. The development of these devices along with well-developed behavioral classifiers and magnetic alignment data offers a noninvasive technique for collecting robust and unbi-ased behavioral data sets across multiple individuals. However, it must be confirmed that the bio-loggers them-selves, the harness system, or any additional equipment secured to the fox do not introduce unintentional biases or effect the performance of functional behaviors in wild foxes. One advantage of the miniaturized bio-logger and collar use in the current study is that it offers a light-weight and durable approach for external data tag attach-ment. The mean body mass of western European adult red foxes ranges from roughly 5.5 to 6.5 kg (although individual, sexual, and seasonal factors introduce vari-ation) [58], and therefore, the bio-logging equipment used in the current study (total mass = 55.2 g) accounts for less than 0.1% of the mean body mass, well below the suggested <10% body mass guidelines recommended by [59]. Since the collars were snuggly secured around the fox’s neck, it is unlikely that it would hamper the move-ments involved in wild mousing behavior, and indeed, no impairment in mousing-like leaps or decrease in fre-quency of leaps was observed in the semidomesticated
foxes when the harnesses were attached compared to when they were removed. However, this was based on general observations of the semidomesticated foxes inside the behavioral arena, and field-based observations comparing the behavior of free-roaming foxes with and without harnesses will be important to confirm that the equipment is not influencing the quality or frequency of natural behaviors. Furthermore, although the devices did contain small amounts of magnetic material causing a slight deflection (<5°) of a compass needle when placed in contact with the device, this effect was eliminated when the device was moved 2 cm from the compass. There-fore, it is unlikely that the small magnetic component inherent to the bio-logger would have an effect on per-ceiving the magnetic field, as the magnetic field strength falls off exponentially with distance, decreasing at a rate to the third power with distance (i.e., inverse cube law) [60], and therefore would produce a much weaker effect, if any, in the eyes and head region (i.e., the proposed site of magnetoreceptors [33, 61]). Also, magnetic compass responses in migratory birds exposed to field strengths differing by ±30% of the natural field strength showed no effect on compass orientation, suggesting a functional window of magnetic compass responses [62], and if SMA in red foxes is mediated by a similar sensory mechanism, weak magnetic fields produced by the bio-logging device would not be expect to disrupt magnetic alignment responses.
efficiency and promote longer battery life for input to the multi-turn antenna. Because the physical size of the antenna was extremely small relative to the wavelength at 1.4 MHz (approximately 215 m), multiple loops of wire were stacked vertically to improve the antenna’s efficiency and ensure sufficient energy was emitted to the fox. The resulting collar produces a radio-frequency stimulus with a maximal intensity of 88 nT, beyond inten-sities shown to disrupt migratory compass orientation in birds and SMA responses in hatchling snapping tur-tles [18, 66]. Integrating the radio-frequency collar with the bio-logging device and harness system will provide a powerful opportunity to test for the involvement of a light-dependent radical pair mechanism underlying mag-netic alignment responses of mousing red foxes under otherwise natural conditions that can be conducted fol-lowing double-blind protocols. Importantly, this system can provide further support for, or against, the impact of anthropogenic radio-frequency exposure on wild life [67–69]. Although field observations of wild foxes will be important to confirm that the radio-frequency col-lars do not affect natural behaviors, it is unlikely that they would impair the use of magnetic cues during mousing attempts. As discussed above, magnetic field strengths fall off exponentially as a function of distance [60], and the radio-frequency collars are only weakly magnetic, making it unlikely that the collar would appreciably affect the perception of magnetic fields. Furthermore, if foxes use a similar magnetoreception mechanism to that used by migratory birds, then magnetic field intensities would need to change by 30% or more to disrupt behaviors rely-ing on magnetic cues [62]. Lastly, non-iron containing loops of wire, like those used in the current radio-fre-quency collar design, will not manipulate or distort the ambient magnetic field. The radio-frequency intensities proposed for use in future studies of red foxes are well below the guidelines for human exposure adopted by the World Health Organization [70] and are thought to only affect biological processes occurring at the quantum level. Therefore, we do not anticipate the animal to expe-rience any discomfort or long-term effects from radio-frequency exposure.
If, however, mousing success is unaffected by radio-frequency exposure, alternative manipulations could be performed, aimed to test for the involvement of a mag-netite-based mechanism similar to the one proposed to mediate spontaneous magnetic nest building behaviors in subterranean mole-rats [71–73]. For example, prior to attaching the harness system to wild-caught foxes, individuals could be exposed to a brief, high-intensity magnetic pulse that re-magnetizes particles of biogenic
magnetite. Similar to the effects of pulse re-magnetiza-tion on mole-rats that exhibited a 90° deviare-magnetiza-tion of mag-netic nest building orientation after pulse treatments [73], wild foxes would be predicted to exhibit shifted or abolished SMA responses while mousing if this behavior is mediated by a magnetite-based mechanism.
Conclusions
We report the development of ‘magnetic ethograms’ in which the behavior and magnetic alignment of red foxes can be accurately extracted from raw sensor data recorded from triaxial accelerometer and magnetometer bio-loggers. Three functionally relevant behaviors could be identified using a 5-nearest neighbor classifier that performed with an overall accuracy of 95.7% across 415 ground-truth events. To evaluate the generalizability of the classifier, similar behavioral data were recorded from a second fox and resulted in 66.7% performance accuracy when analyzed using identical techniques, suggesting the classifier can extract behaviors across multiple foxes. A similar classification approach was used to identify the fox’s magnetic alignment using two 8-way classifiers with differing underlying assumptions to distinguish magnetic headings in eight equally spaced 45° sectors. The mag-netic heading classifiers performed with 90.0 and 74.2% accuracy, suggesting a realistic performance range for a classifier based on an independent set of training events equal in size to our sample.
Abbreviation
SMA: spontaneous magnetic alignment.
Authors’ contributions
MSP contributed to project conception, carried out experimental design, was responsible for data collection, data analysis and interpretation of data, and drafted and edited sections of the manuscript. JAB was responsible for data analysis and interpretation and drafted and edited sections of the manu-script. MSP and JAB contributed equally to the manuscript and should be considered co-first authors. EPM contributed to project conception, assisted with experimental design, data analysis and interpretation, and helped draft and edit sections of the manuscript. CRA assisted in experimental design, was responsible for radio-frequency collar conception and electrical design, data analysis and interpretation, and drafted and edited sections of the manu-script. DCS contributed to the experimental design, data collection method-ology, contributed to data analysis and interpretation, and drafted and edited sections of the manuscript. CWH contributed to data analysis and interpreta-tion. JC contributed to project conception, helped coordinate experiments with semidomesticated foxes, and provided logistical support throughout the course of the study. VH contributed to the project conception, assisted with experimental design, helped coordinate experiments with semidomes-ticated foxes, and provided logistical support throughout the course of the study. VT helped with construction and design of experimental arenas, gave permission for study of semidomesticated foxes, assisted with handling of semidomesticated foxes, and provided logistical support throughout the course of the study. EB provided logistical support throughout the course of the study and edited versions of the manuscript. HB contributed to project conception, assisted with experimental design, and provided logistical sup-port throughout the study. JBP contributed to project conception, assisted with experimental design, assisted with data analysis and interpretation of data, provided logistical support throughout the course of the study, and drafted and edited sections of the manuscript. All authors read and approved the final mauscript.
Author details
1 Department of Biological Sciences, Virginia Tech, Blacksburg, VA, USA. 2 Department of Electrical and Computer Engineering, United States Naval Academy, Annapolis, MD, USA. 3 Department of General Zoology, Faculty of Biology, University of Duisburg-Essen, 45117 Essen, Germany. 4 Department of Biomedical Engineering and Mechanics, Virginia Tech, Blacksburg, VA, USA. 5 Department of Game Management and Wildlife Biology, Faculty of Forestry and Wood Sciences, Czech University of Life Sciences, 16521 Praha 6, Czech Republic.
Additional files
Additional file 1: Table S1. Bio-logging device orientations.
Additional file 2: Video file S1. Example of Fox2 exhibiting a ‘mousing-like’ leap out of the 10 × 10 × 1 m arena.
Additional file 3: Video file S2. Example of Fox2 exhibiting a ‘mousing-like’ leap out of the 10 × 10 × 1 m arena.
Additional file 4: Video file S3. Example of Fox1 trained to jump over a barrier and immediately come to a stop preventing a collision with a second, smaller barrier. This obstacle was designed to elicit ‘mousing-like’ leaps.
Additional file 5: Video file S4. Example of Fox1 trained to approach a ~1-m-tall barrier by walking down one of four corridors aligned in the four cardinal magnetic directions to receive a food reward in the central square of the arena.
Additional file 6: Video file S5. Example of Fox1 exhibiting ‘mousing-like’ behavior using the four-corridor arena described above.
Additional file 7: Video file S6. Example of Fox1 exhibiting behavior defined as ‘trotting’ for the behavioral analysis.
Additional file 8: Video file S7. Example of Fox1 exhibiting behaviors defined as ‘foraging’ for the behavioral analysis.
Acknowledgements
We are grateful to Štěpánka Topinková and Veronika Hartová for all of their assistance during the study. We thank Paul Youmans, Lukas Landler, and Jack Whitehead for their input on project conception and helpful feedback on versions of the manuscript. We also thank the editor for the handling and processing of the manuscript.
Competing interests
The authors declare that they have no competing interests.
Availability of data
The authors agree to make all of the raw accelerometer and magnetometer data publically available.
Ethics approval
All methods were approved by the Expert Commission of the Czech University of Life Sciences (SP506051228).
Funding sources
This work was funded by the Virginia Tech Doctoral Scholarship Program and Sigma-Xi. The study was also supported by the Grant Agency of the Czech Republic (Project No. 506/11/2121). JBP was supported by National Science Foundation, IOS 07-48175 and IOS 13-49515.
Received: 18 May 2016 Accepted: 17 October 2016
References
1. Evans K, Lea M-A, Patterson T. Recent advances in bio-logging science: technologies and methods for understanding animal behav-iour and physiology and their environments. Deep Sea Res Part II. 2013;88:1–6.
2. Wilmers CC, et al. The golden age of bio-logging: how animal-borne sensors are advancing the frontiers of ecology. Ecology. 2015;96(7):1741–53.
3. Payne NL, et al. From physiology to physics: are we recognizing the flex-ibility of biologging tools? J Exp Biol. 2014;217(3):317–22.
4. Wilson RP, Shepard E, Liebsch N. Prying into the intimate details of animal lives: use of a daily diary on animals. Endanger Species Res. 2008;4(1–2):123–37.
5. Bidder OR, et al. Love thy neighbour: automatic animal behavioural clas-sification of acceleration data using the k-nearest neighbour algorithm. PLoS ONE. 2014;9(2):e88609.
6. Gerencsér L, et al. Identification of behaviour in freely moving dogs (Canis familiaris) using inertial sensors. PLoS ONE. 2013;8(10):e77814.
7. Wiltschko W, Wiltschko R. Magnetic orientation and magnetoreception in birds and other animals. J Comp Physiol A Neuroethol Sens Neural Behav Physiol. 2005;191(8):675–93.
8. Mouritsen H, Ritz T. Magnetoreception and its use in bird navigation. Curr Opin Neurobiol. 2005;15(4):406–14.
9. Lohmann KJ, Lohmann CMF, Putman NF. Magnetic maps in animals: nature’s GPS. J Exp Biol. 2007;210(21):3697–705.
10. Freake MJ, Muheim R, Phillips JB. Magnetic maps in animals: a theory comes of age? Quart Rev Biol. 2006;81(4):327–47.
11. Kirschvink JL, Walker MM, Diebel CE. Magnetite-based magnetoreception. Curr Opin Neurobiol. 2001;11(4):462–7.
12. Deutschlander ME, Phillips JB, Borland SC. The case for light-dependent magnetic orientation in animals. J Exp Biol. 1999;202(Pt 8):891–908. 13. Wiltschko R, Wiltschko W. Magnetoreception. BioEssays.
2006;28(2):157–68.
14. Kishkinev D, Chernetsov N. Magnetoreception systems in birds: a review of current research. Biol Bull Rev. 2015;5(1):46–62.
15. Begall S, et al. Magnetic alignment in mammals and other animals. Mamm Biol. 2013;78:10–20.