Recent result from CMD-3 detector
A. S. Popov1,2,afor collaboration CMD-3
1Budker Institute of Nuclear Physics, SB RAS, Novosibirsk, 630090, Russia 2Novosibirsk State University, Novosibirsk, 630090, Russia
3Novosibirsk State Technical University, Novosibirsk, 630092, Russia
4University of Sydney, School of Physics, Falkiner High Energy Physics, NSW 2006, Sydney, Australia 5University of Tokyo, Department of Physics, 7-3-1 Hongo Bunkyo-ku Tokyo, 113-0033, Japan
Abstract.Since December 2010, the CMD-3 detector has collected data at the electron-positron collider VEPP-2000. The sample of the accumulated data corresponds to about 60pb−1of integrated luminosity in the c.m. energy from 0.32 up to 2 GeV. Preliminary results of the analysis of various processese+e−annihilation to hadrons are presented. It is shown the processes with multihadron events have several intermediate states which must be taken into account to correctly describe the angular and invariant mass distributions as well as cross section dependence versus energy.
1 Introduction
The electron-positron collider VEPP-2000 [1] operates at the Budker Institute of Nuclear Physics since December 2010. The collider is designed to provide luminosity up to
1032cm−2s−1at the maximum center-of-mass energy√s=
2 GeV. The current integrated luminosity accumulated by
the CMD-3 is about 60 pb−1. One of the main physical
task is to measure the hadronic cross sections in the wide energy range, and searches for the new vector and scalar mesons and as well as for the exotic hadrons.
The precision data of the hadronic cross sections are required for various applications, in particular, to evaluate
the anomalous magnetic moment (AMM) of muon,aμ =
(g−2)μ/2. The VEPP-2000 energy range gives the major
hadronic contribution to AMM (ahad
μ ∼92%) both to the
hadronic vacuum polarization itself and to its uncertainty [2].
The precision measurement of luminosity is a key in-gredient of many experiments which study the hadronic
cross sections ate+e−colliders. So far it is very
impor-tant to have several QED processes such ase+e−→e+e−,
μ+μ−,γγto have the cross check as it was done by CLEO
[3].
The general purpose detector CMD-3 has been de-scribed in detail elsewhere [4]. Its tracking system con-sists of a cylindrical drift chamber (DC) and double-layer multiwire proportional Z-chamber, both also used for a
trigger, and both inside a thin (0.2 X0) superconducting
solenoid with a field of 1.3 T. The liquid xenon (LXe)
barrel calorimeter with 5.4 X0 thickness has fine
elec-trode structure, providing 1-2 mm spatial resolution, and shares the cryostat vacuum volume with the
superconduct-ae-mail: [email protected]
ing solenoid. The barrel CsI crystal calorimeter [5] with
thickness of 8.1 X0is placed outside the LXe
calorime-ter, and the end-cap BGO calorimeter with a thickness
of 13.4 X0 is placed inside the solenoid. The
luminos-ity is measured using events of Bhabha scattering andγγ
at large angles with about 1% accuracy.
The beam energy has been monitored by measuring the current in the dipole magnets of the main ring, and for a few energy points by using the Back-Scattering-Laser-Light system [6]. Using measured average momentum from Bhabha events, and average momentum of
proton-antiproton pairs from thee+e− → pp¯process, we
deter-mine Ecmfor each energy point with about 1 MeV
accu-racy.
To study a detector responce and to obtain a
registra-tion efficiency, we have developed a Monte Carlo (MC)
simulation of our detector based on GEANT4 package, and all simulated events pass all our reconstruction and selection procedures. The MC simulation includes photon radiation by initial electron or positron, calculated accord-ing to Ref. [7].
2 Luminosity measurement
The energy range from 1 to 2 GeV was scanned upward and downward with a step of 50 MeV. At each energy point
the integrated luminosity of about 500nb−1was
accumu-lated. In the case of scanning downward, the energy points have been shifted by 25 MeV with respect to the previous case. The experiments were performed from January to June 2011 and, similarly, in 2012.
Two types the «CHARGED» and the «NEUTRAL» first level triggers were used while data have been taking.
A combinations of the signals from DC cells and ZC sec-tors, which roughly reproduce “track”, start a special pro-cessor «TRACKFINDER» (TF). The combinations of
sig-nals from calorimeters with different energy thresholds
ac-tuated the «CLUSTERFINDER» (CF) processor. A posi-tive decision of either processor allowed the recording of current event onto a hard disk with capacity about 2 TB. In the course of data accumulation, the mean trigger
fre-quency ranged in∼200÷400 Hz. The sample of collinear
Bhabha eventse+e−were selected for luminosity
determi-nation.
The processe+e− → γγwas also used, since it has
essential advantages [8] with respect to the first one.
It is free of radiation of the final state particles and its Coulomb interaction, the corresponding Feynman graphs
do not contain photon propagators affected by the vacuum
polarization effects. These advantages are the main
mo-tivation to exploit this process as an independent tool for luminosity.
Figure 1.The ratio of the relative difference of the luminosi-ties vs beam energy (scan 2011). Full circles - scan up, trian-gles - scan down. Line - fit: 0.2±0.3%
, MeV beam E 160 180 200 220 240 260 280 300 320 340
QED
σ
)/
-μ +μ
→
-e
+
(e
σ
0.9 0.95 1 1.05 1.1
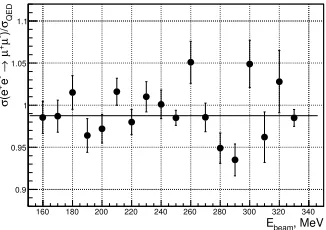
Figure 2.Result of the measurement of muon pair production in comparison with the QED prediction. Horizontal line - fit: 0.995±0.005
The collected integrated luminosity above theφmass
is about 34.5pb−1, 8.3 and 8.4
pb−1at theωandφ
reso-nances, respectively, and 9.4pb−1from a scan below theφ.
The peak luminosity∼2·1031cm−2s−1is limited while by a positrons injection rate and it will gain by a factor of ten after upgrade of the injection facility.
The relative difference of the luminosities determined
with two processes versus energy is presented in Fig. 1, where only statistical errors are shown (SCAN 2011). The horizontal line is a fit for this ratio and in average it is
about 0.2±0.3%. The main sources which contribute to
systematic error are: contribution due to the different
an-gular resolutions for Bhabha events andγγis estimated as
∼0.8%; correction, which takes into account inclination of
the beam axis with respect to detector is about∼0.4%; DC
z-coordinate calibration contributes about 0.3%; radiative corrections are calculated according to [9] with the ac-curacy about 0.2%. Presently we estimate the current
lu-minosity systematic accuracy as∼1% for energies higher
than 1 GeV.
3 Processes with multihadrons in final
states
One of the main goal of the CMD-3 experiment is to re-duce a systematic uncertainty of the cross section of two
pion production to 0.3-0.4%. Theπ+π−events are
sep-arated either using the particles momentum or their en-ergy deposition in EM-calorimeter. Two ways of event separation will provide cross-check and is expected al-low to keep the systematic error under control. The first energy scan below 1 GeV was performed in 2013. The collected statistics is a few times higher than we had in the previous CMD-2 measurements and it is at the level of ISR statistics accumulated by the BaBar and KLOE.
The process e+e− → μ+μ− is very importance since
it provides overall systematic test of the event separa-tion accuracy. Preliminary results for the cross secsepara-tion
σ(e+e− → μ+μ−) are shown in Fig. 2 with respect to
the QED prediction. Horizontal line is a fit for the dou-ble ratioσexpμμ/σQEDμμ /σexpee /σQEDee which was found to be
0.995±0.005. At the moment this result demonstrates our
potential power of the event separation procedure. Study
of different systematic uncertaintices is ongoing.
3.1 Study of the processese+e−→KSKLand
e+e−→K+K−.
It is known the CMD-2 and BaBar results for cross
sec-tions at theφ-peak region disagree at the level∼4% for
charged channel, so a new measurement are required. The e+e− → K0
SK 0
Lande+e− → K+K−cross sections were
measured in the c.m. energy range 1.004-1.060 GeV at 25 energy points. The neutral mode detection is based on the search of two central tracks with common vertex in
DC from theK0
S →π+π−decay. The number of events is
defined by the fit of two pions invariant mass distribution [10].
detection efficiency of each kaon was determined with data and as well as with MC and deliver a deviation less 1.5%. The obtained cross sections for the neutral (published) and charged mode (preliminary) are presented in Fig. 3 and Fig. 4, correspondingly. The measured cross section is approximated according to VDM model as a sum of
φ,ω,ρ-like amplitudes and their excitations. The
inter-ference of non-resonant amplitudes with the amplitude of
φ meson scales in ten times and shown too at the
bot-tom of graphs. The neutral and charged channels were approximated simultaneously, as a result the following
values of the φmeson parameters have been obtained:
mφ=1019.464±0.060 MeV/c2,Γ
φ=4.240±0.017 MeV, Bφ→K+K−
Bφ→K0 S K0L
=1.573±0.06.The obtained parameters have
ac-curacy comparable or better than it was obtained in previ-ous experiments.
, MeV C.M. E
1010 1020 1030 1040 1050 1060
0 200 400 600 800 1000 1200 1400
, nb
L
K
S
-> K
e
+
e
σ CMD-3
CMD-3 Fit 10, nb × NR σ CMD-2
Figure 3. The cross section of the processe+e− → KLKS
aroundφ-meson energy region. CMD-2, CMD-3 and BaBar data are presented.
, MeV C.M. E
1010 1020 1030 1040 1050 1060
0 500 1000 1500
2000 σe+ e- -> K+K-, nb CMD-3
CMD-3 Fit 10, nb × NR σ BaBar
Figure 4. The cross section of the processe+e− → K+K− aroundφ-meson energy region. CMD-2, CMD-3 and BaBar data are presented.
3.2 Study of the processe+e−→K+K−π+π−
The cross section measurement of the processe+e− →
K+K−π+π− is based on the integrated luminosity of
22 pb−1in the c.m. energy range from 1.5 to 2.0 GeV and
early was measured by the BaBar via ISR. Nevertheless the direct measurements are very important, since some
contributes toaμare based on isospin relations of various
KK¯+nπfinal states. Any uncertainty of this approach will
be crucial for theaμaccuracy in the future calculations.
The signal events should have three or four tracks in the DC coming from interaction region and obey to the energy-momentum conservation. Two tracks
correspond-ing to kaons should have specific ionization losses dE/dx
in DC. Fig. 5 shows the difference between measured total
, MeV/c
tot
P
100 200 300 400 500 600
, MeVπ
4
E
Δ
800
−
600
−
400
−
200
−
0
Figure 5. The difference between the total energy and c.m. energy (ΔE4) versus the total momentum for the four-track events. The upper cluster of dots representsπ+π−π+π−while the lower one -K+K−π+π−events.
, MeV
c.m.
E 1500 1600 1700 1800 1900 2000
), nb
-π
+
π
-K
+
K
→
-e
+
(e
σ
0 1 2 3 4 5
Figure 6. Dots - thee+e−→K+K−π+π−cross section
mea-sured with the CMD-3. The BaBar results are shown by open circles.
energy and c.m. energyΔE4=Etot−Ec.m.vs the total
mo-mentum for all events with four tracks. The signal events are located near in origin of coordinates. The cluster of events with a zero total momentum but shifted up along the vertical axis, corresponds toπ+π−π+π−events.
The similar procedure was used to select signal events
with the three-track in DC. As a result, ∼13300
four-track events and ∼16000 three-track events were
se-lected. To calculate a detection efficiency, theK+K−π+π−
events were simulated with a primary generator using the GEANT4 package and then reconstructed with the same software as experimental data.
and mainly due to model dependence of the detection ef-ficiency. More detail analyses can be found in publication [12].
3.3 Six pion production
Production of the six charged pions ine+e−annihilation
was studied at DM2 [13] and BaBar [14]. The DM2 experiment observed a “dip” in the cross section of the
processe+e−→3(π+π−) near 1.9 GeV, confirmed later by
the BaBar. The origin of the “dip” remains unclear, but the most popular explanation is based on a hypothesis of a
presence of the under-threshold (pp¯) resonance discussed
in many theoretical papers [15].
The analysis is based on 22 pb−1of the integrated
lu-minosity collected in the c.m. energy range from 1.5 to 2 GeV. Candidates for the process under study are required to have five or six tracks in DC. For six- or five-track candi-dates the total energy and total momentum are calculated, assuming all tracks to be pions. To estimate the
back-ground MC simulation of the major processes 2(π+π−π0)
and 2(π+π−)π0was performed and was found to be smaller
than 1%. The analysis in detail for this channel can be found in [16].
To measure the cross section of the processe+e− →
2(π+π−π0) the sample of events with the four charged and two neutral pions were selected. To select neutral pions the spectrum of invariant mass of all two photon
combi-nations was studied inside energy gap from 60< mγγ <
200 MeV/c2and combination with the nearest to the pion
mass is chosen. The number of events under study at each energy point was determined by fit of the distributions shown in Fig. 7 with a sum of three Gaussian functions for signal events and quadratic polynomial for background. The cross section calculates according to the number of determine events and takes into account RC and detection
efficiency. The preliminary results for the cross section are
presented in Fig. 8. The analysis of the data is in progress.
3.4 Cross sections measurement of the
e+e−→ηπ+π−ande+e−→ωπ+π−processes
The process e+e− → ηπ+π− was studied in two decay
modes ofη: 2γandπ+π−π0. The signal events should have two tracks and at least two photons in EM-calorimeter. The shape of two photons invariant mass distribution was fix from MC and used to determine the number of the
ηπ+π−events at each energy point. The result of such fit
at 1500 MeV is shown in Fig. 9. The preliminary results for the Born cross section are presented in Fig. 10. The
systematic uncertainty for this process is about 5.2% and
mainly due to uncertainty of detection efficiency, which
depends on angular distribution of the final particles, i.e. depends on the intermediate states (theoretical models) through this process goes.
These two processes were studied too whenηandω
decay to the three pions:π+π−π0. To determined the
sig-nal events the shape of theπ+π−π0invariant mass
distri-bution has been studied using Monte Carlo simulation and
, MeV beam )-2E 0 π 2 π E(4 600
− −400 −200 0 200 400 600
/10 MeV
events
N
0 5 10 15 20 25 30 35 40 45
Figure 7. The number of events vs the total energy of the system 2(π+π−π0). Signsl- fit with a sum of three Gaussian functions, background - fit with quadratic polynomial.
, (MeV) c.m. E 1400 1500 1600 1700 1800 1900 2000 2100
)), (nb)
0π -π +π
2(
→
-e
+
(e
σ
0 1 2 3 4 5 6 7
Figure 8.. Cross section of the processe+e−→2(π+π−π0) vs energy. Black points - CMD3, green - BaBar.
was used to count the number of the signal events. The preliminary results for the Born cross sections are consis-tent with other experiments. The current systematic uncer-tainty for these channels we estimated as 15% and mainly
driven by the difference between angular distributions of
charged particles in simulation and experiment. The anal-ysis of systematic errors is ongoing.
3.5 Study of the processese+e−→K+K−ηand
e+e−→K+K−ω
The analysis of the process e+e−→K+K−η was based
on 19 pb−1 of an integrated luminosity collected by the
CMD-3 detector in 2011–2012 in the Ec.m. range from
1.59 to 2.01 GeV. On the base of these statistics we
observed the contribution ofφ(1020)ηintermediate state
only. Candidates for the events of the signal process
were required to have two, three or four tracks in the DC,
coming out of the beams intersection point. The kaon/pion
separation was performed with the use of fK/π(p,dE/dx)
functions [12], representing the probability density for
charged kaon/pion with the momentum pto produce the
energy lossesdE/dxin the DC. We consideredη-meson
as a recoil particle, which allowed us to avoid the loss
of statistics due to the selection of the specificηdecay
mode. But such an inclusive approach lead to the
2 , MeV/c
γ γ
M
300 400 500 600 700 800
0 20 40 60 80 100 120 140
Figure 9. Two photons invariant mass at the energy of 1500 MeV.
, MeV s 1200 1300 1400 1500 1600 1700 1800 1900 2000
, nb
-π
+
πη
-->
-e
+
e
σ
0 1 2 3 4
5 BaBar
CMD-3 fit, model 1 fit, model 2
Figure 10. Thee+e−→ηπ+π−Born cross section measured in theη→γγchannel. The results are presented together with BaBar data.
the major background processes were studied and were found to be e+e−→K+K−ω(782), e+e−→K+K−π+π−, e+e−→φf0(500),K∗±(892)K∓π0→K+K−π0π0,
e+e−→2π+2π−2π0. We perform the signal/background
separation and 1296±43 signal events were extracted. The
resulting e+e−→φ(1020)η cross section is shown in the
Fig. 11 along with the BaBar results. The overall sys-tematic uncertainty of the cross section measurement was estimated to be 6%. Via the cross section approximation
theφ(1680)-meson parameters have been determined.
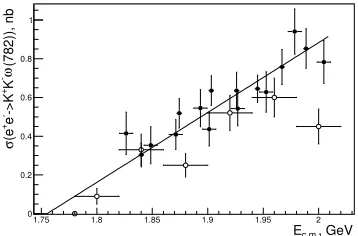
The analysis of the processe+e−→K+K−ω(782) was
based on 12 pb−1 of the integrated luminosity collected
by the CMD-3 detector in 2011–2012 in theEc.m. range
from 1.8 to 2.01 GeV. Candidates for the events of the sig-nal process were required to have three or four tracks in the DC, flying out of the area of the beams intersection.
The kaon/pion separation was performed in the same way,
as in thee+e−→K+K−ηprocess analysis. We studied the
process in theω(782)→π+π−π0decay mode, considering
π0as a recoil particle. The major background processes
were found to bee+e−→K+K−ηande+e−→K+K−π+π−, but their contribution was almost completely suppressed by the cuts on the invariant and missing masses of kaons and pions. After background suppression we performed a direct subtraction of the estimated number of background
events and in total in the experiment we obtained 886±30
1.55 1.6 1.65 1.7 1.75 1.8 1.85 1.9 1.95 2 0
0.5 1 1.5 2 2.5 3 3.5
, GeV
c.m.
E
σ( −>φ(1020)η),
-e
+e
nb
Figure 11. The BaBar (open circles) and CMD-3 (filled cir-cles) results for the measurement of e+e−→φ(1020)ηcross section in the range from 1.59 to 2.01 GeV. The approxima-tion of CMD-3 data together with the BaBar data in the range from 2.3 to 3.46 GeV is also shown.
1.75 1.8 1.85 1.9 1.95 2
0 0.2 0.4 0.6 0.8 1
, GeV c.m. E
(782)), nb
-K
+
->K
-e
+
(e
σ
ω
Figure 12. The BaBar (open circles) and CMD-3 (filled cir-cles) results for the measurement ofe+e−→K+K−ω(782) cross section in the range from 1.8 to 2.01 GeV. The approximation of CMD-3 data is also shown.
signal events. The resulting e+e−→K+K−ω(782) cross
section is shown in the Fig. 12 along with the BaBar re-sults. The overall systematic uncertainty of the cross sec-tion measurement was estimated to be 6%.
4 Summary and conclusion
CMD-3 detector will operate with a goal to get∼ 1f b−1
in 5-10 years and provides the new precise results on the hadron production. The current integrated luminos-ity was measured using two well known QED processes
e+e−→e+e−,γγand systematic accuracy is estimated as
1%. Two type of the first level triggers «CHARGED» and «NEUTRAL» deliver the independent information that
al-lowed to determine the detection efficiencies and to
esti-mate their uncertainties. Data analysis is in progress, the already collected data sample provides the same or better statistical precision for the hadronic cross sections than in previous experiments were achieved.
Acknowledgements
We thank the VEPP-2000 team for excellent machine op-eration.
This work is supported in part by the Russian Ed-ucation and Science Ministry, by FEDERAL TARGET PROGRAM Scientific and scientific-pedagogical person-nel of innovative Russia in 2009-2013, by agreement 14.B37.21.07777, by the Russian Fund for the Basic Re-search grants.
Part of this work related to the photon reconstruction algorithm in the electromagnetic calorimeter is supported by the Russian Science Foundation (project No. 14-50-00080).
RFBR 10-02-00695-a, RFBR 10-02-00253-a, RFBR 11-02-00328-a, RFBR 11-02-00112-a, RFBR 31501-mol-a, RFBR 31499-mol-a, RFBR 12-02-31498-mol-a, RFBR 12-02-01032-a, RFBR 13-02-00215-a.
References
[1] I. Koopet al., Nucl.Phys.B, Proc.Suppl. 181, 371
(2008)
[2] M. Davieret al., Eur. Phys. J. C31, 503 (2003)
K. Hagiwaraet al., J. Phys. G38, 085003 (2011)
[3] G. Grawfordet al., Nucl. Instr. Meth. A345, 429
(1994)
[4] B. I. Khazinet al., Nucl.Phys.B, Proc. Suppl.
181-182, 376 (2008)
[5] V. M. Aulchenko et al, 2015 JINST 10 P10006
(2015)
[6] E. V. Abakumovaet al., Phys. Rev. Lett.110, 140402
(2013)
[7] E. A. Kuraev and V. S. Fadin, Yad. Fiz., vol.341, 733
(1984)
[8] S. I. Eidelmanet al., Eur. Phys. J. C71, 1597 (2011)
[9] A. B. Arbuzovet al.Eur. Phys. J. C46, 689 (2006)
S. Actiset al., Eur. Phys. J. C66, 585 (2010)
[10] E. A. Kozyrevet al., Phys. Lett. B760, 314 (2016)
[11] B. Aubert et al. (BaBar Collaboration), Phys. Rev. D 76, 012008 (2007)
J. P . Leeset al.(BaBar Collaboration), Phys. Rev. D
86, 012008 (2012)
[12] D. N. Shemyakinet al., Phys.Lett. B756, 153-160
(2016)
[13] R. Baldiniet al., reported at the “Fenice” Workshop,
Frascati (1988);
A. B. Clegg and A. Donnachie, Z. Phys. C45, 677
(1990);
M. R. Whalley, J. Phys. G29, A1 (2003)
[14] B. Aubertet al., (BaBar Collaboration), Phys. Rev.
D73, 052003 (2006)
[15] A. Sibirtsev and J. Haidenbauer, Phys. Rev. D71,
054010 (2005)
A. Antonelli et al. (FENICE Collaboration), Phys.
Lett. B365, 427 (1989)