R E S E A R C H A R T I C L E
Open Access
The impact of human and mouse differences in
NOS2 gene expression on the brain
’
s redox and
immune environment
Michael D Hoos
1, Michael P Vitek
2, Lisa A Ridnour
3, Joan Wilson
2, Marilyn Jansen
2, Angela Everhart
2,
David A Wink
3and Carol A Colton
2*Abstract
Background:Mouse models are used in the study of human disease. Despite well-known homologies, the difference in immune response between mice and humans impacts the application of data derived from mice to human disease outcomes. Nitric oxide synthase-2 (NOS2) is a key gene that displays species-specific outcomes via altered regulation of the gene promoter and via post-transcriptional mechanisms in humans that are not found in mice. The resulting levels
of NO produced by activation of humanNOS2are different from the levels of NO produced by mouse Nos2.
Since both tissue redox environment and immune responsiveness are regulated by the level of NO and its interactions, we investigated the significance of mouse and human differences on brain oxidative stress and on immune activation in HuNOS2tg/mNos2−/−mice that express the entire humanNOS2gene and that lack a functionalmNos2compared to wild type (WT) mice that express normalmNos2.
Methods/results:Similarly to human, brain tissue fromHuNOS2tg/mNos2−/−mice showed the presence of aNOS2gene 3′UTR binding site. We also identified miRNA-939, the binding partner for this site, in mouse brain lysates and further demonstrated reduced levels of nitric oxide (NO) typical of the human immune response on injection with lipopolysaccharide (LPS).HuNOS2tg/mNos2−/− brain samples were probed for characteristic differences in redox and immune gene profiles compared to WT mice using gene arrays. Selected genes were also compared againstmNos2−/−brain lysates. Reconstitution of the human NOS2 gene significantly altered genes that encode multiple anti-oxidant proteins, oxidases, DNA repair, mitochondrial proteins and redox regulated immune proteins. Expression levels of typical pro-inflammatory, anti-inflammatory and chemokine genes were not significantly different with the exception of increased TNFαandCcr1mRNA expression in theHuNOS2tg/mNos2−/−mice compared to WT ormNos2−/−mice.
Conclusions:NO is a principle factor in establishing the tissue redox environment and changes in NO levels impact oxidative stress and immunity, both of which are primary characteristics of neurodegenerative diseases. The HuNOS2tg/mNos2−/− mice provide a potentially useful mechanism to address critical species- specific immune differences that can impact the study of human diseases.
Keywords: NOS2, Mouse models, Neurodegeneration, Redox, Inflammation, Nitric oxide
* Correspondence:Carol.Colton @duke.edu
2
Department of Neurology, Duke University Medical Center, Durham, NC 27710, USA
Full list of author information is available at the end of the article
Background
The past five years have proven to be disappointing and frustrating to pre-clinical scientists in the Alzheimer’s field. Multiple therapeutics that worked to reduce amyl-oid mediated pathology in established mouse models of Alzheimer’s disease (AD) have not proven to be useful in humans with AD and, in some cases, have made the dis-ease outcomes worse [1-4]. The results of these and other clinical trials have now driven the search for a better un-derstanding of AD disease mechanisms and emphasize the pressing need for re-evaluation of research directions in the field. Recently, a critical avenue of research relevant to neurodegeneration has been a subject of renewed inter-est. Although immune changes in AD have been known for many years, the importance of an immune response to the disease process was unclear. This was despite convin-cing evidence from Caleb Finch [5], W. Sue Griffin [6,7], Piet Eikenlenboom [8], Patrick and Edith McGeer [9,10] and others who showed that immune responses were observed as an early and key pathological characteris-tic of humans with AD. Data from genome-wide associ-ation studies (GWAS) have now firmly established that genes involved in the immune response are central to the risk for development of late onset Alzheimer’s disease [11-13]. These genes encode proteins that include apoli-poprotein E (APOE) that serves as a global immune regu-lator [14], complement receptor 1(CR1) that may mediate Aβ clearance from the brain [15], CD33 (Siglec11) that when expressed on microglia becomes neuroprotective [16] and TREM2 with its downstream target TYROBP (DAP12) that regulates multiple microglial functional pathways [17,18]. The immune response in AD is clearly a critical event in the disease process. Zhang et al. [17] using an integrated network analysis of late onset AD-associated genes showed that immune/microglia gene networks dem-onstrated the strongest degree of disease association and the highest correlation to AD neuropathology compared to other gene subsets. Despite these exciting findings, we still don’t understand how immune cells such as microglia are involved in the initiation or progression of disease, if and when their involvement changes with time or even what type of response is generated by microglia (or other immune cells) at different stages of AD.
Seok et al. [19] have re-enforced an additional dimen-sion of complexity that impacts our methodologies we use to understand how the brain’s immune response is in-volved in neurodegenerative diseases such as AD. In their controversial study, Seok and colleagues compared the genomic responses of mice and humans during an acute immune response resulting from endotoxemia, burns or trauma. Their study demonstrated that correlations be-tween mouse and human immune signaling pathways were poor for these acute illnesses and at least for path-ways that are commonly initiated by lipopolysaccharide
(LPS), mouse gene changes were not predictive of human gene changes for a similar disease initiation process. More recently, this interpretation has been challenged by Takao and Miyakawa [20]. Regardless, it is generally agreed that not only are disease-based changes in immunity a challenging issue, but also the models used to study human immune responses during disease should be care-fully considered.
The recognition that mouse immune processes are not the same as human immune processes is clearly not new. Mestas and Hughes in 2004 [21] defined a number of dif-ferences in both innate and adaptive immune characteris-tics between rodents and man. These differences include Fc receptor subtypes, the action of IFNαon Th1 cells and the involvement of the Th2 response in clearance of para-sites. In 1995 our lab showed that cultured microglia and macrophages from humans showed limited nitric oxide (NO) production in response to immune stimuli that were commonly used on mouse cells in culture such as LPS or polyinosinic:polycytidylic acid (PIC) alone or in com-bination with cytokines such as interferon- γ (IFNγ) or interleukin-1β [22,23]. Microglia cultured from rodent brains, however, are well known to produce robust levels of NO when stimulated with the same induction agents. NO is the product of the inducible iNOS protein that is encoded by theNOS2gene and serves defensive and regu-latory roles in an immune response. Multiple other labs have observed similar differences between NO production in mouse and in human cells and a vigorous discussion on the molecular mechanisms underlying these differences has ensued over the intervening years [24-28]. An elegant study by Guo et al. [29] demonstrated a reasonable explanation for these differences. Guo, Geller and col-leagues found binding sites for a microRNA (miRNA-939) in the 3′untranslated region (UTR) of the human NOS2 gene. When these sites are bound to miRNA-939, a post-transcriptional repression of iNOS protein expression is initiated and NO production was thereby reduced. While this may not be the sole mechanism for differences between human and rodent NO production and differ-ences in promoter regulatory activity also exist [25,30-32], miRNA-mediated silencing may account for a large part of the inability to readily stimulate and measure NO in human macrophages and microglia.
these problems include our lack of knowledge on regula-tion of the cell and tissue redox environment that also im-pacts immunity [34,35].
One way to address these issues is to“humanize”mouse models by replacing mouse genes with corresponding hu-man genes. There are currently hu-many examples of this type of approach including multiple models of neurodegenera-tive disease where a mutated gene is added in addition to the mouse gene (for example, the APPsw-Tg2576 mice; [36] or where the human gene replaces a large part of the mouse gene with or without replacing the promoter region of the gene (Apoe4targeted replacement mice, [37]). Simi-lar methodologies have been used for immune genes. The choice of which mouse gene to alter depends on the dis-ease process.
We have developed mouse models of AD that express mutated human amyloid precursor protein (APP) and also demonstrate human-like NO production when im-mune stimulated. Our scientific rationale for this model was based on the interrelationship between inflamma-tion, oxidative stress and neurodegeneration [34,38]. NO serves as a nodal point between inflammation and oxida-tive stress, and when altered, results not only in a changed brain redox environment [34,35], but also in altered im-mune regulation, both of which impact human disease [33,34]. The types of interactions and their products are now well described in excellent reviews and will not be dis-cussed here [39-43]. However, it is clear that both super-oxide anion through oxidative events and NO through both direct and indirect reactions regulate multiple pro-teins and cellular pathways in a precise manner. These pathways dictate immune regulation and immune defense [34]. Because the direct and indirect reactions of NO are dependent on the available concentration of NO, the consumption of NO, for example by combination with superoxide anion, significantly impacts the redox envir-onment of the tissue and alters multiple NO-dependent pathways [42-44]. By shifting the inherent NO level during an immune response, the outcome is likely to provide a unique subset of regulatory and defensive events that are tailored to the individual species. Evolution has made this shift for humans and rodents and has imposed a differ-ence in NOS2 regulation between these species.
To better understand the importance of mouse and hu-manNos2differences, we have generated a mouse model that expresses the entire humanNOS2 gene on a mouse Nos2 knockout background [45]. This new mouse strain has gene regulatory sites that, similar to the human NOS2 gene, are associated with reduced NO production. Here, we show characteristic redox gene differences between mice expressing a normalmNos2gene and mice express-ing only thehuNOS2gene. We also discuss the potential impact of these gene differences on tissue redox balance and immunity.
Results
HuNOS2tg/mNos2−/−mice show 3′UTR binding sites,
miRNA-939 homolog and reduced NO productionin vivo Guo et al. [31] have shown that miRNA-939 binds to sites in the 3′UTR region of the human NOS2 gene, thereby altering the translation of iNOS protein and reducing NO production. To determine if the human NOS2 gene inHuNOS2tg/mNos2−/−mice expressed the appropriate 3′ UTR binding sites we PCR amplified the miRNA-939 binding region from DNA isolated from HuNOS2tg/ mNos2−/− brain tissue. Figure 1A shows the results of a
typical genotyping assay for 7 individual HuNOS2tg/ mNos2−/−mice and corresponding WT mice. The upper
band found in mice expressing the HuNOS2 gene corresponds to a region of the mNos2 gene, which has remained intact in themNos2−/−strain despite the disrup-tion to themNos2gene. The lower band corresponds to a 185 bp product containing the 3′UTR miRNA-939 bind-ing region ofhuNOS2gene.
Having demonstrated that HuNOS2tg/mNos2−/− mice express the 3′UTR binding site that is characteristic of the human NOS2 gene, we then used RT-PCR to detect the presence of a miRNA-939 homolog in brain and liver lysates from lipopolysaccharide (LPS)- treatedHuNOS2tg/ mNos2−/−mice. LPS diluted into saline was injected
intra-venously (iv) to induce an immune response that in-cludes induction of the NOS2 gene and immune-related cytokines. Saline-injected mice were used as untreated controls. At 7 hrs after injection, we assayed brain sam-ples for miRNA-939 and used small nucleolar RNA-202 (snoRNA-202) as an endogenous control for microRNAs. Figure 1B presents results from a typical PCR cycling reac-tion and demonstrates the presence of miRNA-939 in HuNOS2tg/mNos2−/− brain. We also examined the effect
of LPS treatment on the level of miRNA-939 homolog in our mice. Figure 1C shows the average fold change (±sem) in miRNA-939 in brain and liver samples after stimulation with LPS. A similar LPS-mediated increase in miRNA939 levels was shown by Guo et al. [29] for human hepatocytes in culture and in liver lysates from WT mice injected with LPS or a cytokine mix.
plus nitrate (NOx) levels in whole brain lysates in HuNOS2tg/mNos2−/−mice compared to similarly treated
mNos2−/−and WT mice. All mice (36–40 weeks of age)
were intravenously (iv) injected with either 10 mg/kg of LPS or saline (0.9% NaCl) via the tail vein and tis-sues were collected at either 7,18 or 24 hrs post injection. Figure 2A show mRNA levels for LPS-treated mice com-pared to untreated (saline-injected) conditions for both WT andHuNOS2tg/mNos2−/−mice brain lysates. As pre-dicted, mRNA increased in both strains on LPS stimula-tion, however, levels of expression were lower in mice expressing the huNOS2 gene. We next compared nitrite
and nitrate (NOx) levels in brain (Figure 2B) and liver (Figure 2C) lysates derived from LPS-injected or saline-injected WT mice to the levels of NOx found in lysates from mNos2−/− and HuNOS2tg/mNos2−/− mice. As pre-dicted, WT mice demonstrated a significantly in-creased level of NOx in both brain and liver tissue lysates with time after immune stimulation. However, nei-ther mNos2−/− knockout mice nor HuNOS2tg/mNos2−/− mice showed a measurablein vivo response to treatment with LPS when compared to WT-Nos2sufficient mice.
HuNOS2tg/mNos2−/−mice show a unique redox gene
profile
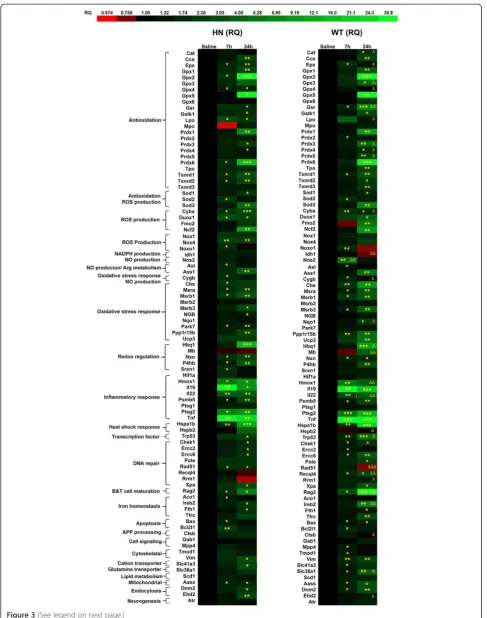
To better understand how reconstitution of the human NOS2gene in amNos2−/−knockout background impacts the redox and immune profile compared to WT mice that normally expressmNos2 and high levels of NO, we performed a directed gene array analysis. For this experi-ment RNA was extracted from brain lysates previously prepared from the WT and HuNOS2tg/mNos2−/− mice injected with either LPS (10 mg/kg) or saline. Quantitative RT-PCR was performed on the cDNA using a custom TaqMan Gene Expression Assay plate (Life Technologies). The array was designed to evaluate a defined mixture of redox and immune genes and three mice for each treat-ment group at each time point were assessed. All CT values were normalized to endogenous levels of 18sRNA and average fold change values (RQ) were determined by 2(−ΔΔCt) method using either WT saline- injected or HuNOS2tg/mNos2−/− saline- injected as the comparator
[47]. The resultant RQ values for LPS-treatedHuNOS2tg/ mNos2−/−mice (here abbreviated HN) and WT mice
sam-ples were then compared at 7 and 24 hrs post-LPS injec-tion. To better visualize the changes due to LPS treatment for each mouse strain and at each time point, a heat map was prepared using these ratios (Figure 3). Ratio values were linearized by Log2 conversion, then subjected to conditional formatting whereby Log2(RQ) values less than 0 were colored red (decreased expression) and Log2(RQ) values greater than 0 were colored green (increased ex-pression) according to the scale in Figure 3. Asterisks de-note a statistically significant change due to LPS treatment with respect to control (saline-injected) mice. In addition, we compared the fold-change in expression levels in LPS treated HuNOS2tg/mNos2−/− mice for each gene to the corresponding fold-change found in WT mice. Statistically significant changes for these data are shown only for the 24 hrs treatment point and are labeled on the heat map with a delta (Δ) sign. Genes are also grouped according to their known function.
LPS stimulation differentially altered the expression of redox related genes in both a time and gene specific manner in the HuNOS2tg/mNos2−/− mice compared to WT mice. For example, as shown in the heat map, DNA Figure 1HuNOS2tg/mNos2−/−mice express both the 3′UTR
binding site and a miRNA-939 homolog involved in regulation of thehuNOS2gene. A- PCR amplification of the 3′UTR region containing putative binding sites for miRNA-939 of the human NOS2 gene inHuNOS2tg/mNos2−/−and WT mice. Lanes represent individual
repair genes that are critical to reducing oxidative DNA damage such as Excision Repair Cross Complementation 2 (Ercc2) that encodes the XPD protein and Ercc6 that encodes the Cockayne syndrome b (CSB) protein show no significant gene induction in HuNOS2tg/mNos2−/− mice at 7 hrs post-LPS injection. By 24 hrs, however, ex-pression of these genes in response to LPS-injection in HuNOS2tg/mNos2−/− mice was observed, indicating a
different time to response in HuNOS2tg/mNos2−/− mice vs WT mice. Checkpoint homolog 1 (Chek1) and the transcription factor p53 follow a similar pattern. The sig-nificance of this delayed repair response to LPS in HuNOS2tg/mNos2−/− mice is not clear, but it suggests
that NO levels affect the early phases of the innate im-mune process in a species-specific manner. Similarly, we find that anti-oxidant and oxidant genes show a signifi-cantly higher or lower expression level in LPS-treated HuNOS2tg/mNos2−/−mice at 24 hrs post-injection
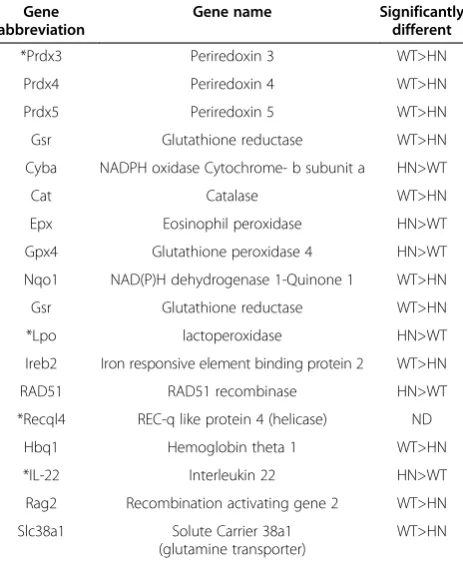
com-pared to similarly treated WT mice. Selected genes are also shown in Table 1. As predicted from the role of NO as a regulator of oxidant/antioxidant balance,HuNOS2tg/ mNos2−/−mice show decreased expression (WT > HN) of
many antioxidant genes (peroxiredoxins, glutathione re-ductase (Gsr), catalase (Cat)) concomitant with increased expression of genes (HN > WT) associated with oxidative pathways such asCyba(the b subunit of the NADPH oxi-dase), Lpo (lactoperoxidase) and eosinophil peroxidase (Epx) compared to WT mice. This altered expression pat-tern is indicative of a shift of the response at 24 hrs poten-tially to a more“oxidative” environment that is regulated by NO flux. Again, how this exactly impacts the disease process remains unknown but it is likely to dictate a dif-ferent overall redox microenvironment of affected cells.
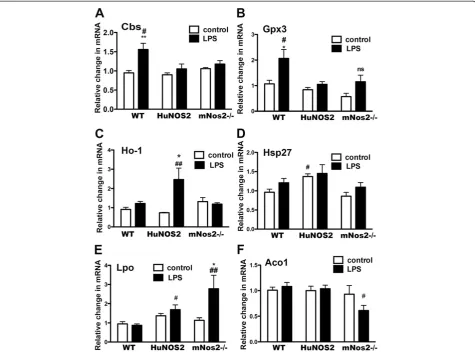
To better understand how varying NO levels in vivo might alter LPS-stimulated gene expression, we further
Figure 2LPS-stimulated mRNA and NOx production in HuNOS2tg/mNos2−/−mice.A. Comparison of the fold changes in
analyzed expression of selected genes inmNOS2−/−mice (no NO) and compared these mRNA levels to the levels found in high NO (WT mice) and to mice with“human” -like levels (HuNOS2tg/mNos2−/−). Examples of gene expression patterns are shown in Figure 4. We found LPS-stimulated genes (cystathione-b- synthase; glutathione peroxidase-3; Figure 4 A, B) that were significantly changed only in WT mice compared to eitherHuNOS2tg/mNos2−/− ormNOS2−/−, and thus appeared to be dependent on high levels of NO production. Alternatively, heme oxygenase−1 (Ho-1) and heat shock protein 27 (Hspb2, Hsp27) were specifically altered in theHuNOS2tg/mNos2−/−mice brain (Figure 4 C, D). Ho-1 mRNA levels increased with LPS treatment whereas no significant change in Ho-1 was found for either WT or themNos2knockout mice. Basal expression levels of Hsp-27, however, were increased in
mice expressing human NOS2 but not in WT ormNos2−/− mice. Finally, as shown in Figure 4 (E,F) mice lacking mNos2 and thus unable to increase NO in response to LPS showed significantly higher levels of lactoper-oxidase (Lpo) and lower levels of aconitase1 (Aco1).
Gene changes between HuNOS2tg/mNos2−/− and WT mice under non- immune stimulated conditions provide insights into the potential physiological impact of an in-herent background difference in WT mice that have high levels of NO and inHuNOS2tg/mNos2−/−mice that have low levels of NO. However, NOS2 is an inducible gene and any non-stimulated change in brain expression levels when theHuNOS2gene is inserted into the mouse genome is puzzling.NOS2translation and transcription are well-known to be regulated by disease-based immune acti-vators including LPS and cytokines via multiple membrane receptors. For the human gene, NOS2 gene expression is also regulated by non ‘cytokine’- like factors includ-ing β-catenin/Wnt2, epidermal growth factor (EGF), col-ony stimulating factor 1 (CSF1) and hormones such as testosterone [30,38,48]. Geller and colleagues [25,30] have shown specific upstream sites in the human NOS2 pro-moter that alter gene regulation. One of these sites medi-ates basal promoter activity of the NOS2 gene and functions independently of known cytokine responsive regulatory elements in the gene promoter. The physio-logical role of basal induction of theNOS2gene in human cells is not well studied but has been implicated in changes that lead to cancer [48,49]. To determine if non-stimulated “basal” changes could be found in mice ex-pressing the human NOS2 gene we compared mRNA levels of selected genes between saline- treatedmNos2−/− (where NO is not produced) and HuNOS2tg/mNos2−/− mice that express a humanNOS2 gene and promoter and produce human levels of NO. Of the genes tested (Figure 4), Hsp27 was found to demonstrate a significant change in saline-treated (control) levels of mRNA expression with no significant difference in LPS-stimulated mRNA expression.
Immune gene profiles are altered in mice expressing the
huNOS2gene
We next determined if changes in the tissue redox re-sponses in HuNOS2tg/mNos2−/− mice could also impact cytokine production in the brain. Thus, gene expression
(See figure on previous page.)
Figure 3Comparison of redox gene expression levels between LPS-simulatedHuNOS2tg/mNos2−/−mice and WT mice.HuNOS2tg/mNos2−/− and WT mice were injected with 10 mg/kg LPS, or with saline as a control, and brains were removed after 7 or 24 hours. RNA was extracted, reverse transcribed, and target gene expression was measured by q-PCR. Fold changes (RQ) were determined forHuNOS2tg/mNos2−/−and WT mice using appropriate saline-injected animals as the comparator for each mouse strain. RQ values were linearized by Log2 conversion, and then subjected to conditional formatting whereby red cells denote lower expression and green cells denote higher expression according to the color scale. Significant differences in gene expression for LPS treated as compared to same strain saline-injected controls were determined by student’st-test (*p≤0.05, **p <0.01, ***p <0.001). Significant differences in gene expression between WT andHuNOS2tg/mNos2−/−mice at specific time points were determined by student’st-test (Δp≤0.05,ΔΔp <0.01,ΔΔΔp <0.001). n = 3 mice per group.
Table 1 LPS-stimulated gene expression differences betweenHuNOS2-/-/mNos2-/-and WT mice brain at 24 hrs post injection
Gene abbreviation
Gene name Significantly different
*Prdx3 Periredoxin 3 WT>HN
Prdx4 Periredoxin 4 WT>HN
Prdx5 Periredoxin 5 WT>HN
Gsr Glutathione reductase WT>HN
Cyba NADPH oxidase Cytochrome- b subunit a HN>WT
Cat Catalase WT>HN
Epx Eosinophil peroxidase HN>WT
Gpx4 Glutathione peroxidase 4 HN>WT
Nqo1 NAD(P)H dehydrogenase 1-Quinone 1 WT>HN
Gsr Glutathione reductase WT>HN
*Lpo lactoperoxidase HN>WT
Ireb2 Iron responsive element binding protein 2 WT>HN
RAD51 RAD51 recombinase HN>WT
*Recql4 REC-q like protein 4 (helicase) ND
Hbq1 Hemoglobin theta 1 WT>HN
*IL-22 Interleukin 22 HN>WT
Rag2 Recombination activating gene 2 WT>HN
Slc38a1 Solute Carrier 38a1 (glutamine transporter)
WT>HN
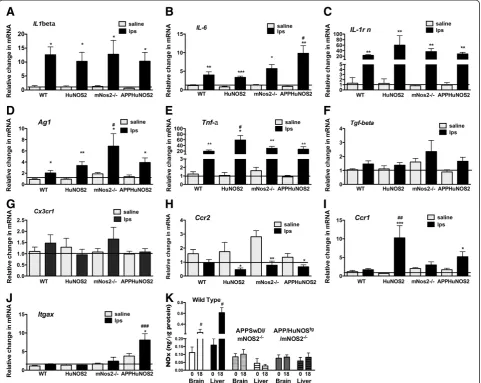
levels for specific chemokines, pro-inflammatory and anti-inflammatory cytokines were measured in HuNOS2tg/ mNos2−/−mice and compared to WT andmNos2−/−mice
at 24 hrs after LPS injection. We also measured the same genes in brain lysates from the HuNOS2tg/APPSwDI/ mNos2−/− to understand if brain Aβ production and
accumulation altered cytokine mRNA levels when the HuNOS2 gene is expressed. All mice were injected with 10 mg/kg LPS or saline and brain lysates prepared in the same manner as described previously. Gene expression levels are presented in Figure 5 as the average (±sem) fold changes observed under untreated and LPS- treated con-ditions. As shown, pro-inflammatory (Il-1β; TNFα, IL-6) and anti-inflammatory (Ag1, IL-rn) mRNA levels signifi-cantly increased with LPS- treatment in each of the mouse strains examined (Figure 5 A-E). Genotype specific differ-ences were also observed. Significantly greater responses were observed in APPhuNOS2 mice forIl-6, inmNos2−/−
mice forAg1and in HuNOS2tg/mNos2−/−mice forTnfα. Tgfβfailed to show a response to LPS in any of the mouse strains (Figure 5F). Chemokine gene expression pat-terns were dependent on the specific chemokine.Cx3cr1 mRNA expression (Figure 5G) was not significantly altered by treatment with LPS in any of the mouse strains. ForCcr2,LPS- treatment reduced levels of mRNA expression in brain lysates from HuNOS2tg/mNos2−/−, APPHuNOS2 and mNos2−/− mice but not in WT mice (Figure 5H). However, increased LPS-mediated expres-sion ofCcr1was found only in the strains that expressed HuNOS2tg/mNos2−/−
described previously in brain and liver lysates from HuNOS2tg/APPSwDI/mNos2−/− and APPSwDI/mNos2−/−
mice using WT as the positive control. No significant changes in NOx levels were observed for mice from either of the APP strains (Figure 5K).
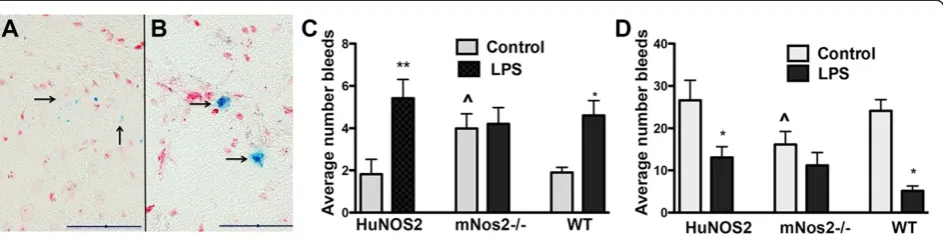
The observed changes in brain gene expression between WT, HuNOS2tg/mNos2−/− and mNos2−/− mice suggested that strain-dependent physiological differences may also be found. LPS treatment is well known to affect the brain /blood interface by increasing small hemorrhages resulting in brain accumulation of red blood cells and hemosiderin,
a break down product of heme iron [50-52]. Since the blood brain barrier integrity is regulated, in part, by NO-dependent metalloprotease (MMP) activity [52,53] we compared the average number of brain microbleeds per section (±sem) in WT,HuNOS2tg/mNos2−/−andmNos2−/− mice. Microbleeds were assessed using Prussian blue histo-chemistry as previously described [51,52] and categorized as“small” (Figure 6A) or“large”(Figure 6B). As shown in Figure 6C, LPS-treatment initiated a significant increase in large microbleeds compared to saline-treated (control) brains in both HuNOS2tg/mNos2−/− and mNos2−/− mice. Figure 5Changes in immune gene expression levels in LPS-simulatedHuNOS2tg/mNos2−/−; APPSwDI+/−/Hu NOS2tg+/+/mNos2−/−;mNos2−/−,
and WT mice.Brain lysates were prepared from saline-injected (gray bars) and LPS-injected (black bars) mice from each of the 4 different strains at 24 hrs. Saline-injected mice from each strain served as the corresponding 0 hrs time point. Average fold changes (±sem) for each gene were determined using the average WT saline-injected value as comparator. n = 5–6 mice per group. PanelsA-F- cytokine genes; Panels G-I-chemokine genes -J- gene marker of activated microglia- integrin alpha10 (CD11c). Statistical significance was determined using two-way ANOVA with genotype as the between strain factor and treatment as the within strain factor (GraphPad Software, San Diego CA). Significance was set at p≤0.05. *p <0.05; **p < 0.01; ***p <0.001; #p <0.05; ##p <0.01; ###p <0.001. K- APP mutations that increase Aβ production and amyloid deposition do not increase brain NOx levels. Brain lysates were prepared from saline injected and LPS injectedAPPSwDI/mNos2−/−andAPPSwDI+/−/ Hu NOS2tg+/+/mNos2−/−mice (see methods for details on mouse strains). NOx brain lysate levels in LPS-stimulated WT mice serve as the positive
Mice lackingNos2, however, showed a significant increase in untreated control brain bleeds when compared to un-treated HuNOS2tg/mNos2−/− and mNos2−/− brains. The average untreated value frommNos2−/−brains was not dif-ferent compared to LPS-treatedmNos2−/−brains. A similar pattern was observed for small bleeds in terms of the strain differences. However, the number of small bleeds was sig-nificantly lower with LPS treatment (Figure 6D).
Discussion
NO and superoxide anion are primary redox molecules that establish and regulate tissue redox balance through direct and indirect mechanisms of action. Both NO and superoxide anion are also central components of immun-ity with regulatory and defensive roles. Thus, it is likely that species differences in production or consumption of either NO or superoxide anion will have evolutionary sig-nificance. As a reactive molecule that interacts with mul-tiple proteins and has a relatively long diffusion distance, NO is particularly well suited to impact cellular pathways. The outcome of these reactions is now well known to be dependent on the level of NO [34,42,48,54,55]. Thus, un-derstanding how and when NO levels change in a tissue is not only critical to deciphering redox regulated mecha-nisms but also is critical to unraveling immune processes and immune pathology.
The discovery of miRNA-939 mediated regulation of human iNOS protein translation by Guo et al. [29] has provided a realistic mechanism to explain a long term conundrum: Why is iNOS mediated production of NO different between human and rodent? Our data support their finding and further directly show that these differ-ences in NO production impact the redox, immune and physiological signature of the brain. This was accom-plished by reconstituting human NOS2 into a mouse Nos2 knockout model, thus providing a useful tool to study NOS2/NO related responses that are relevant to
human disease in an in vivo as well as in vitro setting. Our data from HuNOS2tg/mNos2−/− mice clearly show the presence of the binding site for miRNA-939 in the 3′UTR region of theHuNOS2gene and the presence of a miRNA-939 homolog in the brain, thus recreating a more human-like condition. While C57Bl/6 mice express miRNA-939, they lack the binding site in the gene and the additional regulatory complexity found in the human NOS2gene promoter. Geller and colleagues [25,30] have also described unique promoter sites in the human gene that involve non-cytokine based regulatory elements and elicit basal production of NO by NOS2. This difference in NO regulation implies a more varied and complex pro-duction of NO in human tissues.
The inability to readily measure nitrite and nitrate levels as a surrogate marker of NO production in human im-mune cells has provided an increased level of difficulty in charting NO’s involvement in specific pathways. As shown in this study, LPS-mediated stimulation of human NOS2 in vivo does not result in measureable increases in brain lysate levels of nitrite and nitrate, the commonly used in-dicators of NO production. Nitrate and nitrite are clearly not the only reaction product of NO, however, and other reactive nitrogen species are produced as a result of human NOS2 activation during an immune response [39-41]. The directed gene array forHuNOS2tg/mNos2−/− mice was designed to provide additional insight into the spectrum of pathways that may be differentially acti-vated by human NOS2 vs mouse Nos2. We specifically chose redox based genes to profile because of NO’s inher-ent redox activity and the role of redox-based regula-tion in inflammaregula-tion. In addiregula-tion, neurodegenerative diseases of aging such as Alzheimer’s disease have oxida-tive stress as a primary component [56-58]. A similar di-rected array approach has recently been used to delineate redox genes that are changed in humans with Multiple Sclerosis [59].
Overall, our array results show that LPS induction in mice expressing reconstituted huNOS2 produced a sta-tistically significantly different pattern of redox gene ex-pression than WT mice. The exact inter-relationships between NOS2 expression levels and specific gene ex-pression levels such as cystathione b synthase (Cbs) and glutathione peroxidase 3 (Gpx3) are not precisely de-fined here. For some genes such asCbs, however, direct connections to NO are known. For example, the enzym-atic activity of Cbs protein is reduced when NO binds to the heme site of the protein, thereby altering the transul-furation pathway and the production of either hydrogen sulfide (H2S) or glutathione (GSH) [60]. These data coupled with the increased expression of glutathione peroxidase-3 and glutathione reductase in only LPS-treated WT mice imply a regulatory cross talk between glutathione, H2S and high levels of NO which may not be observed in either themNos2−/−orHuNOS2tg/mNos2−/−strains where NO generated via NOS2 is low.
Two other important and specific points can be gleaned from our data set. First, re-constitution of the human NOS2gene restores gene expression changes that occur as a result of mNos2depletion. For example, genes such as Lpo andAg1 are elevated only inmNos−/−mice. In mice expressing human NOS2 mRNA, both Lpo and Ag1 ex-pression levels are restored to the WT equivalent. These data support the functionality of the HuNOS2 gene in the mNos−/−mouse background. Secondly, the humanNOS2
gene shows unique characteristics that are not found in ei-ther WT or mice lackingmNos2. For example, three key genes associated with disease, that is, heme-oxygenase 1 (Ho1), TNFα and Ccr1 are upregulated in HuNOS2tg/ mNos2−/−mice brain compared to either WT ormNos−/−
mice. These changes are likely to impact both the re-sponse to hypoxia and the rere-sponse of the brain to im-mune challenge. The presence of human NOS2 also mitigates the apparently “leaky” cerebral vessels found in mNos2−/−mice. Increased constitutive levels of both large
and small microglia bleeds were observed in knock-out mice. Although LPS altered the number of hemorrhage sites in WT and HuNOS2tg/mNos2−/−mice in a complex manner, addition of the human NOS2 gene prevented these changes under normal, non-LPS simulated levels, thus mimicking WT mice.
Differences in NO production and its complex action in the brain’s redox environment clearly contribute to the frequently conflicting data and disparate views of NO’s role in disease, particularly when mouse models are used. For neurodegenerative disease, NO is commonly viewed as a contributor to neuronal death in the brain through its ability to interact with superoxide ion to form reactive oxygen species that kill the cell [61,62]. A good example of this is the expression of iNOS in neurons in APP mouse models of AD and in patients with AD. Cortical neurons
from the APPSw (Tg2576) mouse model of AD show iNOS immunoreactivity around amyloid deposits and in neurons associated with intracellular Aβ[63]. While foot-prints of oxidation are found in this micro-environment, the primary event that generates reactive oxygen species may actually be the loss of NO’s role as a superoxide scav-enger to reduce oxidative stress [42,64]. Local oxidants such as reactive iron can interact with NO, leading to the formation of nitrotyrosine and reducing local NO levels [65]. In mouse brain where NO levels are likely to be high, the impact of the loss of NO in the environment will be different than in human brain where the inherent levels of NO generated by iNOS are likely to be restricted by the complexity of the NOS2 gene promoter and by miRNA regulation of translation. Rodrigo et al. [63] clearly show that increased expression of iNOS in APPSw mice is ac-companied by increased Aβ and oxidative outcomes, but these are not accompanied by neuronal death. APPSw Tg2576 mice do not show neuronal loss [66]. In contrast, the removal of mNos2as shown in the APPSw/NOS2−/− mice and the APPSwDI/NOS2−/− mice recreate a NO – poor micro-environment and do demonstrate neuronal death. We also have recently shown that reconstitution of human NOS2into mice expressing mutated human APP and that lack mNos2also proceed to neuronal loss [67], further suggesting a critical role of NO levels. Fernandez-Vizarra [68] has carefully examined the expression of nNOS and iNOS at different stages of AD in neurons from humans with AD. Interestingly, their data demon-strated an increasing level of expression of nNOS followed by increasing ecotopic expression of iNOS in cortical neu-rons. They also observed that the increased expression of NOS enzymes with progression of AD pathology was fre-quently accompanied by nitrotyrosine immunoreactivity but was only rarely associated with signs of neuronal death. They concluded that the presence of NO was pro-tective until“oxidative”events became a dominant cellular pathology. The inherently different regulation of NO levels produced by human iNOS during immune activa-tion as we show herein and/or the consumpactiva-tion of argin-ine, the sole substrate of iNOS are likely to be additional factors that lead to the worsening pathology in humans with AD. Thus the levels of NO and its perspective chem-ical biology in the microenvironment is an important de-terminant of outcome.
derived from gene networks analysis of autopsied brain samples from humans with AD provide important in-sights. Their studies clearly show a dominant contri-bution of microglial/immune genes to multiple clinical co-variants found in patients with AD. However, NO me-diated network associations with AD pathology are min-imal. It is likely, then, that consideration of differences between human and mouseNOS2and the impact this has on the brain’s redox environment may be useful in study-ing human disease includstudy-ing AD.
Methods
Animals
All animal experiments were performed in accordance with protocols approved by the Institutional Animal Care and Use committee at Duke University Medical Center under the NIH Guide for the Utilization and Care of Vertebrate Animals Used in Testing, Research and Training.
Mice strains: HuNOS2tg+/+/mNos2−/−mice
The HuNOS2tg+/+/mNos2−/− strain was developed and characterized by Vitek et al. as described [45].
APPSwDI+/−/Hu NOS2tg+/+/mNos2−/−mice
HomozygousAPPSwDI/mNos2−/−(CerebroVascular amyloid-Nos2−/− or CVN-AD) mice were produced by crossing mice expressing the vasculotropic Swedish K760N/M671L, Dutch E693Q and Iowa D694N human APP muta-tions under control of the Thy-1 promoter withmNos2−/− (B6 129P2NOS2tau1Lau/J) mice [45]. These mice were then crossed to HuNOS2tg+/+/mNos2−/− mice to generate the APPSwDI+/−/Hu NOS2tg+/+/mNos2−/−strain.
Control mice
mNos2−/− (B6 129P2NOS2tau1Lau
/J) and C57Bl/6 WT mice were purchased from Jackson Laboratory, Bar Harbor ME and produced through the barrier breeding colonies at Duke University. All mice were genotyped in a stand-ard fashion.
LPS treatment
Mice between the ages of 36–40 weeks of age (mixed genders) were iv injected with 10 mg/kg LPS or saline (0.9% NaCl) via the tail vein. Mixed genders were used in the analyses and gender based-differences were not inves-tigated. Mice were allowed to recover on heated pads and then were humanely euthanized at 7 and 24 hrs after the injection with a lethal mixture of ketamine/xylazine. Each mouse was intracardially perfused with approximately 25 mls of phosphate buffered saline (PBS). Hemispheres from perfused brains and 2–3 lobes from each liver were then rapidly removed, immediately frozen in liquid nitrogen and the cryo-preserved tissue was pulverized under liquid nitrogen for use in the assays. The remaining hemispheres
were fixed in 4% paraformaldehyde and passed through sucrose gradients for sectioning on a freezing microtome.
Prussian blue staining
Sagittal sections (25 microns) were cut from fixed brain, mounted and air-dried on slides for staining using the Perls protocol. After rehydration, sections were reacted with acidic potassium ferrocynanide (2 gm/100 mls) for 30 mins. Sections were then counterstained with neutral red. The number of microbleeds was counted at 20 × magnification for 4 complete brain sections/mouse lo-cated between 0.6-2.04 mm lateral to the bregma for a minimum of 4 mice per strain. Microbleeds were identi-fied as bright blue spots and were separated into two categories; large (>20 microns) and small (<20 microns) (see Figure 6).
NOx assay
For the NOx assay 40 mg of frozen pulverized brain or liver tissue from each brain were boiled in 250 μl PBS buffer for 10 min. After centrifugation to pellet, total ni-trite and nitrate (NOx) content of the supernatants were measured using a Sievers Nitric Oxide Analyzer under reduction by vanadium (III) chloride (VCl3) in 1 N HCl, heated to 95°C [69]. NOx levels were normalized to total protein content of the supernatants as determined by BCA assays.
qRT-PCR
Total RNA was extracted from approximately 40 mg of frozen pulverized brain tissue, which was homogenized using a Bullet Blender with RNase free 0.5 mm zirco-nium oxide beads (Next Advance) in TRIzol reagent (Life Technologies). cDNA was produced using the cDNA High Capacity kit (Life Technologies) according to the manufacturer’s instructions. Real-time PCR was performed using TaqMan Gene Expression assays (Life Technologies) also according to the manufacturer’s instructions and as previously described [70]. Data were normalized to ei-ther 18 s or ß-actin. Specific miRNA was reverse tran-scribed using the TaqMan MicroRNA Reverse Transcription Kit (Life Technologies) and the specific RT primer sup-plied with each TaqMan miRNA assay. Quantitative PCR was then run using the BioRad CFX96 Touch Real Time PCR detection system. Average fold change values (RQ) were determined by 2(−ΔΔCt)method using saline injection as the comparator for individual strain samples [47].
MicroRNA assay (Assay name- hsa-mir-939) from Life Technologies.
Statistical analysis
Data are presented as average values ± SEM. Where ap-propriate, significant changes within strain were deter-mined using student’s t-test or one-way ANOVA while statistical significance between strains and treatments was determined using two-way ANOVA (GraphPad Software, San Diego CA). Significance was set at p≤0.05.
Competing interests
Other- Michael P. Vitek is an employee of Duke University and is the CEO of Cognosci, Inc., Research Triangle Park, North Carolina. Carol A. Colton has spousal-based, non-financial competing interest with Cognosci, Inc. and with Oncotide, Inc. Vitek and Colton conflict of interest is managed by the Duke Committee on Conflict of Interest. Remaining authors (Wink, Ridnour, Hoos, Wilson, Jansen, Everhart) have no competing interests.
Authors’contributions
MH carried out the molecular genetic studies and the measurement of NOx activity; DW provided guidance on the chemical biology of NO and provided interpretation of results; LR provided interpretation of results and assisted with production of the manuscript; JW carried out the animal
experimentation procedures; MJ carried out molecular gene analysis experiments; AE performed all histochemical studies; MV provided guidance on the molecular biological and mouse genetics; CC initiated and supervised the experimental aspects of the project including data analysis and production of the manuscript. All authors read and approved the final manuscript.
Author details
1
Department of Neurosurgery, Stonybrook Health Sciences, Stony Brook, NY 11794, USA.2Department of Neurology, Duke University Medical Center,
Durham, NC 27710, USA.3Radiation Biology Branch, National Cancer Institute, National Institutes of Health, Bethesda, MD 20892, USA.
Received: 15 May 2014 Accepted: 10 October 2014 Published: 17 November 2014
References
1. Galasko D, Bell J, Mancuso JY, Kupiec JW, Sabbagh MN, van Dyck C, Thomas RG, Aisen PS:Clinical trial of an inhibitor of RAGE-abeta interactions in alzheimer disease.Neurology2014,82:1536–1542.
2. Salloway S, Sperling R, Fox NC, Blennow K, Klunk W, Raskind M, Sabbagh M, Honig LS, Porsteinsson AP, Ferris S, Reichert M, Ketter N, Nejadnik B, Guenzler V, Miloslavsky M, Wang D, Lu Y, Lull J, Tudor IC, Liu E, Grundman M, Yuen E, Black R, Brashear HR, Bapineuzumab 301 and 303 clinical trial investigators:Two phase 3 trials of bapineuzumab in mild-to-moderate Alzheimer’s disease.N Engl J Med2014,370:322–333.
3. Becker RE, Greig NH, Giacobini E:Why do so many drugs for alzheimer’s disease fail in development? Time for new methods and new practices?
J Alzheimers Dis2008,15:303–325.
4. Schor NF:What the halted phase III gamma-secretase inhibitor trial may (or may not) be telling us.Ann Neurol2011,69:237–239.
5. Finch CE, Marchalonis JJ:Evolutionary perspectives on amyloid and inflammatory features of Alzheimer disease.Neurobiol Aging1996,
17:809–815.
6. Griffin WS, Sheng JG, Royston MC, Gentleman SM, McKenzie JE, Graham DI, Roberts GW, Mrak RE:Glial-neuronal interactions in alzheimer’s disease: the potential role of a‘cytokine cycle’in disease progression.Brain Pathol 1998,8:65–72.
7. Mrak RE, Griffin WS:Glia and their cytokines in progression of neurodegeneration.Neurobiol Aging2005,26:349–354. 8. Eikelenboom P, van Exel E, Hoozemans JJ, Veerhuis R, Rozemuller AJ,
van Gool WA:Neuroinflammation - an early event in both the history and pathogenesis of alzheimer’s disease.Neurodegener Dis 2010,7:38–41.
9. Akiyama H, McGeer PL:Brain microglia constitutively express beta-2 integrins.J Neuroimmunol1990,30:81–93.
10. McGeer PL, Itagaki S, Tago H, McGeer EG:Reactive microglia in patients with senile dementia of the alzheimer type are positive for the histocompatibility glycoprotein HLA-DR.Neurosci Lett1987,
79:195–200.
11. Jones L, Holmans PA, Hamshere ML, Harold D, Moskvina V, Ivanov D, Pocklington A, Abraham R, Hollingworth P, Sims R, Gerrish A, Pahwa JS, Jones N, Stretton A, Morgan AR, Lovestone S, Powell J, Proitsi P, Lupton MK, Brayne C, Rubinsztein DC, Gill M, Lawlor N, Lynch A, Morgan K, Brown KS, Passmore PA, Craig D, McGuinness B, Todd S,et al:
Genetic evidence implicates the immune system and cholesterol metabolism in the aetiology of alzheimer’s disease.PLoS One2010,
5:e13950.
12. Kamboh MI, Demirci FY, Wang X, Minster RL, Carrasquillo MM, Pankratz VS, Younkin SG, Saykin AJ, for the Alzheimer’s Disease Neuroimaging Initiative, Jun G, Baldwin C, Logue MW, Buros J, Farrer L, Pericak-Vance MA, Haines JL, Sweet RA, Ganguli M, Feingold E, DeKosky ST, Lopez OL, Barmada MM:
Genome-wide association study of alzheimer’s disease.Transl Psychiatry 2012,2:e117.
13. Morgan K:The three new pathways leading to alzheimer’s disease.
Neuropathol Appl Neurobiol2011,37:353–357.
14. Colton CA, Brown CM, Vitek MP:Sex steroids, APOE genotype and the innate immune system.Neurobiol Aging2005,26:363–372.
15. Crehan H, Holton P, Wray S, Pocock J, Guerreiro R, Hardy J:Complement receptor 1 (CR1) and alzheimer’s disease.Immunobiology2012,
217:244–250.
16. Bertram L, Lange C, Mullin K, Parkinson M, Hsiao M, Hogan MF, Schjeide BM, Hooli B, Divito J, Ionita I, Jiang H, Laird N, Moscarillo T, Ohlsen KL, Elliott K, Wang X, Hu-Lince D, Ryder M, Murphy A, Wagner SL, Blacker D, Becker KD, Tanzi RE:Genome-wide association analysis reveals putative alzheimer’s disease susceptibility loci in addition to APOE.Am J Hum Genet2008,
83:623–632.
17. Zhang B, Gaiteri C, Bodea LG, Wang Z, McElwee J, Podtelezhnikov AA, Zhang C, Xie T, Tran L, Dobrin R, Fluder E, Clurman B, Melquest S, Narayanan M, Suver C, Shah H, Mahajan M, Gillis T, Mysore J, MacDonald M, Lamb JR, Bennett DA, Molony C, Stone DJ, Gudnason V, Myers AJ, Schadt EE, Neumann H, Zhu J, Emilsson V:Integrated systems approach identifies genetic nodes and networks in late-onset alzheimer’s disease.Cell2013,
153:707–720.
18. Guerreiro R, Hardy J:TREM2 and neurodegenerative disease.N Engl J Med 2013,369:1569–1570.
19. Seok J, Warren HS, Cuenca AG, Mindrinos MN, Baker HV, Xu W, Richards DR, McDonald-Smith GP, Gao H, Hennessy L, Finnerty CC, Lopez CM, Honari S, Moore EE, Minei JP, Cushieri J, Bankey PE, Johnson JL, Sperry J, Nathens AB, Billiar TR, West MA, Jeschke MG, Klein PH, Gamelli RL, Gibran NS, Brownstein BH, Miller-Graziano C, Calvano ES, Mason PH, Cobb JP,et al:
Genomic responses in mouse models poorly mimic human inflammatory diseases.Proc Natl Acad Sci U S A2013,110:3507–3512.
20. Takao K, Miyakawa T:Genomic responses in mouse models greatly mimic human inflammatory diseases.Proc Natl Acad Sci U S A2014, Aug 4, E pub ahead of print.
21. Mestas J, Hughes CC:Of mice and not men: differences between mouse and human immunology.J Immunol2004,172:2731–2738.
22. Colton CA:Induction of nitric oxide in cultured microglia: evidence for a cytoprotective role.Adv Neuroimmunol1995,5:491–503.
23. Colton C, Wilt S, Gilbert D, Chernyshev O, Snell J, Dubois-Dalcq M:Species differences in the generation of reactive oxygen species by microglia.
Mol Chem Neuropathol1996,28:15–20.
24. Weinberg JB, Misukonis MA, Shami PJ, Mason SN, Sauls DL, Dittman WA, Wood ER, Smith GK, McDonald B, Bachus KE, Haney AF, Granger DL:
Human mononuclear phagocyte inducible nitric oxide synthase (iNOS): analysis of iNOS mRNA, iNOS protein, biopterin, and nitric oxide production by blood monocytes and peritoneal macrophages.
Blood1995,86:1184–1195.
25. Taylor BS, de Vera ME, Ganster RW, Wang Q, Shapiro RA, Morris SM Jr, Billiar TR, Geller DA:Multiple NF-kappaB enhancer elements regulate cytokine induction of the human inducible nitric oxide synthase gene.J Biol Chem1998,273:15148–15156.
27. Haley PJ:Species differences in the structure and function of the immune system.Toxicology2003,188:49–71.
28. Ganster RW, Taylor BS, Shao L, Geller DA:Complex regulation of human inducible nitric oxide synthase gene transcription by Stat 1 and NF-kappa B.Proc Natl Acad Sci U S A2001,98:8638–8643.
29. Guo Z, Shao L, Zheng L, Du Q, Li P, John B, Geller DA:miRNA-939 regulates human inducible nitric oxide synthase posttranscriptional gene expression in human hepatocytes.Proc Natl Acad Sci U S A2012,
109:5826–5831.
30. Du Q, Park KS, Guo Z, He P, Nagashima M, Shao L, Sahai R, Geller DA, Hussain SP:Regulation of human nitric oxide synthase 2 expression by Wnt beta-catenin signaling.Cancer Res2006,66:7024–7031.
31. Guo Z, Shao L, Du Q, Park KS, Geller DA:Identification of a classic cytokine-induced enhancer upstream in the human iNOS promoter.
FASEB J2007,21:535–542.
32. Kleinert H, Wallerath T, Fritz G, Ihrig-Biedert I, Rodriguez-Pascual F, Geller DA, Forstermann U:Cytokine induction of NO synthase II in human DLD-1 cells: roles of the JAK-STAT, AP-1 and NF-kappaB-signaling pathways.
Br J Pharmacol1998,125:193–201.
33. Kobzik L:Translating NO biology into clinical advances: still searching for the right dictionary?Am J Respir Cell Mol Biol2009,41:9–13.
34. Wink DA, Hines HB, Cheng RY, Switzer CH, Flores-Santana W, Vitek MP, Ridnour LA, Colton CA:Nitric oxide and redox mechanisms in the immune response.J Leukoc Biol2011,89:873–891.
35. Colton CA, Wilcock DM, Wink DA, Davis J, Van Nostrand WE, Vitek MP:
The effects of NOS2 gene deletion on mice expressing mutated human AbetaPP.J Alzheimers Dis2008,15:571–587.
36. Hsiao K, Chapman P, Nilsen S, Eckman C, Harigaya Y, Younkin S, Yang F, Cole G:Correlative memory deficits, abeta elevation, and amyloid plaques in transgenic mice.Science1996,274:99–102.
37. Sullivan PM, Mezdour H, Quarfordt SH, Maeda N:Type III hyperlipoproteinemia and spontaneous atherosclerosis in mice resulting from gene replacement of mouse apoe with human apoe*2.J Clin Invest1998,102:130–135. 38. Geller DA, Billiar TR:Molecular biology of nitric oxide synthases.
Cancer Metastasis Rev1998,17:7–23.
39. Fukuto JM, Cisneros CJ, Kinkade RL:A comparison of the chemistry associated with the biological signaling and actions of nitroxyl (HNO) and nitric oxide (NO).J Inorg Biochem2013,118:201–208.
40. Ridnour LA, Thomas DD, Mancardi D, Espey MG, Miranda KM, Paolocci N, Feelisch M, Fukuto J, Wink DA:The chemistry of nitrosative stress induced by nitric oxide and reactive nitrogen oxide species. Putting perspective on stressful biological situations.Biol Chem2004,
385:1–10.
41. Toledo JC Jr, Augusto O:Connecting the chemical and biological properties of nitric oxide.Chem Res Toxicol2012,25:975–989.
42. Thomas DD, Ridnour LA, Isenberg JS, Flores-Santana W, Switzer CH, Donzelli S, Hussain P, Vecoli C, Paolocci N, Ambs S, Colton CA, Harris CC, Roberts DD, Wink DA:The chemical biology of nitric oxide: implications in cellular signaling.Free Radic Biol Med2008,45:18–31.
43. Wink DA, Miranda KM, Espey MG, Pluta RM, Hewett SJ, Colton C, Vitek M, Feelisch M, Grisham MB:Mechanisms of the antioxidant effects of nitric oxide.Antioxid Redox Signal2001,3:203–213.
44. Thomas DD, Ridnour LA, Espey MG, Donzelli S, Ambs S, Hussain SP, Harris CC, DeGraff W, Roberts DD, Mitchell JB, Wink DA:Superoxide fluxes limit nitric oxide-induced signaling.J Biol Chem2006,281:25984–25993. 45. Vitek MP, Brown C, Xu Q, Dawson H, Mitsuda N, Colton CA:
Characterization of NO and cytokine production in immune-activated microglia and peritoneal macrophages derived from a mouse model expressing the human NOS2 gene on a mouse NOS2 knockout background.Antioxid Redox Signal2006,8:893–901.
46. Combet S, Balligand JL, Lameire N, Goffin E, Devuyst O:A specific method for measurement of nitric oxide synthase enzymatic activity in peritoneal biopsies.Kidney Int2000,57:332–338.
47. Livak KJ, Schmittgen TD:Analysis of relative gene expression data using real-time quantitative PCR and the 2(−delta delta C(T)) method.
Methods2001,25:402–408.
48. Ambs S, Glynn SA:Candidate pathways linking inducible nitric oxide synthase to a basal-like transcription pattern and tumor progression in human breast cancer.Cell Cycle2011,10:619–624.
49. Ambs S, Merriam WG, Ogunfusika MO, Bennett WP, Ishibe N, Hussain SP, Tzeng EE, Geller DA, Billiar TR, Harris CC:p53 and vascular endothelial
growth factor regulate tumor growth of NOS2-expressing human carcinoma cells.Nat Med1998,4:1371–1376.
50. Liu S, Grigoryan MM, Vasilevko V, Sumbria RK, Paganini-Hill A, Cribbs DH, Fisher MJ:Comparative analysis of H&E and prussian blue staining in a mouse model of cerebral microbleeds.J Histochem Cytochem2014, July 25. E published ahead of print.
51. Wilcock DM, Morgan D, Gordon MN, Taylor TL, Ridnour LA, Wink DA, Colton CA:Activation of matrix metalloproteinases following anti-abeta immunotherapy; implications for microhemorrhage occurrence.
J Neuroinflammation2011,8:115.
52. Wilcock DM, Rojiani A, Rosenthal A, Subbarao S, Freeman MJ, Gordon MN, Morgan D:Passive immunotherapy against abeta in aged APP-transgenic mice reverses cognitive deficits and depletes parenchymal amyloid deposits in spite of increased vascular amyloid and microhemorrhage.
J Neuroinflammation2004,1:24.
53. Yang Y, Estrada EY, Thompson JF, Liu W, Rosenberg GA:Matrix metalloproteinase-mediated disruption of tight junction proteins in cerebral vessels is reversed by synthetic matrix metalloproteinase inhibitor in focal ischemia in rat.J Cereb Blood Flow Metab2007,
27:697–709.
54. Ridnour LA, Thomas DD, Switzer C, Flores-Santana W, Isenberg JS, Ambs S, Roberts DD, Wink DA:Molecular mechanisms for discrete nitric oxide levels in cancer.Nitric Oxide2008,19:73–76.
55. Bogdan C:Nitric oxide and the immune response.Nat Immunol2001,
2:907–916.
56. Markesbery WR:Oxidative stress hypothesis in alzheimer’s disease.
Free Radic Biol Med1997,23:134–147.
57. Floyd RA:Antioxidants, oxidative stress, and degenerative neurological disorders.Proc Soc Exp Biol Med1999,222:236–245.
58. Smith MA, Nunomura A, Zhu X, Takeda A, Perry G:Metabolic, metallic, and mitotic sources of oxidative stress in alzheimer disease.Antioxid Redox Signal2000,2:413–420.
59. Fischer MT, Sharma R, Lim JL, Haider L, Frischer JM, Drexhage J, Mahad D, Bradl M, van Horssen J, Lassmann H:NADPH oxidase expression in active multiple sclerosis lesions in relation to oxidative tissue damage and mitochondrial injury.Brain2012,
135:886–899.
60. Gherasim C, Yadav PK, Kabil O, Niu WN, Banerjee R:Nitrite reductase activity and inhibition of H(2)S biogenesis by human cystathionine ss-synthase.PLoS One2014,9:e85544.
61. Haas J, Storch-Hagenlocher B, Biessmann A, Wildemann B:Inducible nitric oxide synthase and argininosuccinate synthetase: co-induction in brain tissue of patients with alzheimer’s dementia and following stimulation with beta-amyloid 1–42in vitro.Neurosci Lett2002,
322:121–125.
62. Malinski T:Nitric oxide and nitroxidative stress in alzheimer’s disease.
J Alzheimers Dis2007,11:207–218.
63. Rodrigo J, Fernandez-Vizarra P, Castro-Blanco S, Bentura ML, Nieto M, Gomez-Isla T, Martinez-Murillo R, MartInez A, Serrano J, Fernandez AP:
Nitric oxide in the cerebral cortex of amyloid-precursor protein (SW) Tg2576 transgenic mice.Neuroscience2004,128:73–89.
64. Ridnour L, Dhanapal S, Hoos M, Wilson J, Lee J, Cheng R, Brueggemann E, Hines H, Wilcock D, Vitek M, Wink DA, Colton CA:Nitric oxide-mediated regulation of beta-amyloid clearance via alterations of MMP-9/TIMP-1.
J Neurochem2012,234:736–749.
65. Thomas DD, Espey MG, Pociask DA, Ridnour LA, Donzelli S, Wink DA:
Asbestos redirects nitric oxide signaling through rapid catalytic conversion to nitrite.Cancer Res2006,66:11600–11604.
66. Radde R, Duma C, Goedert M, Jucker M:The value of incomplete mouse models of alzheimer’s disease.Eur J Nucl Med Mol Imaging 2008,35(Suppl 1):S70–S74.
67. Colton CA, Wilson JG, Everhart A, Wilcock DM, Puolivali J, Heikkinen T, Oksman J, Jaaskelainen O, Lehtimaki K, Laitinen T, Vartiainen N, Vitek MP:
mNos2 deletion and human NOS2 replacement in alzheimer disease models.J Neuropathol Exp Neurol2014,73:752–769.
68. Fernandez-Vizarra P, Fernandez AP, Castro-Blanco S, Encinas JM, Serrano J, Bentura ML, Munoz P, Martinez-Murillo R, Rodrigo J:Expression of nitric oxide system in clinically evaluated cases of alzheimer’s disease.
Neurobiol Dis2004,15:287–305.
reduction with chemiluminescence detection.Anal Chem1989,
61:2715–2718.
70. Wilcock DM, Lewis MR, Van Nostrand WE, Davis J, Previti ML, Gharkholonarehe N, Vitek MP, Colton CA:Progression of amyloid pathology to alzheimer’s disease pathology in an amyloid precursor protein transgenic mouse model by removal of nitric oxide synthase 2.J Neurosci2008,28:1537–1545.
doi:10.1186/1750-1326-9-50
Cite this article as:Hooset al.:The impact of human and mouse differences in NOS2 gene expression on the brain’s redox and immune environment.Molecular Neurodegeneration20149:50.
Submit your next manuscript to BioMed Central and take full advantage of:
• Convenient online submission
• Thorough peer review
• No space constraints or color figure charges
• Immediate publication on acceptance
• Inclusion in PubMed, CAS, Scopus and Google Scholar
• Research which is freely available for redistribution