C L I N I C A L R E S E A R C H A R T I C L E
Open Access
Effect of sex and polymorphisms of CYP2B6
and UGT1A9 on the difference between
the target-controlled infusion predicted
and measured plasma propofol
concentration
Ai Fujita
1,2, Kengo Hayamizu
1,3, Tatsuya Yoshihara
1,4*, Masayoshi Zaitsu
5,6, Fumie Shiraishi
1, Hisatomi Arima
7,
Kazumasa Matsuo
8,9, Kanako Shiokawa
8, Hidekazu Setoguchi
3,8and Toshiyuki Sasaguri
1Abstract
Introduction:To examine whether sex and polymorphisms of cytochrome P450 (CYP) 2B6 and UDP-glucuronosyltransferase (UGT) 1A9 affect the difference between predicted and measured plasma propofol concentration during continuous infusion by target-controlled infusion.
Results:Blood samples of 69 patients (48 men and 21 women) were obtained at 4 h after initial propofol infusion. Percentage performance error (PE) was calculated to assess the difference between measured and predicted propofol concentration. Regression coefficients (β) and 95% confidence intervals (CI) of sex and the polymorphisms of CYP2B6 and UGT1A9 for PE were, separately and mutually, estimated with linear regression. Covariates included age and body mass index in the minimal adjusted model, and additionally included clinical factors (mean blood pressure, heart rate, volume of intravenous fluid, surgical site, surgical position, and pneumoperitoneum) in the full
adjusted model. PE was higher in men than in women (28.7% versus 10.5%,p =0.015). Female sex was inversely
associated with PE: the minimal adjustedβ=−8.84 (95% CI,−16.26 to−1.43); however, the fully adjustedβwith clinical factors became not significant. The average of PE did not differ between polymorphisms of CYP2B6 and
UGT1A9, andβof CYP2B6 516G>T polymorphisms mutually adjusted with female sex was not significant. Mean
blood pressure, heart rate, and volume of intravenous fluid were independently associated with PE in the full adjusted model.
Conclusions:Under 4 h anesthesia with propofol target-controlled infusion in our population, sex differences appeared to exist in the propofol concentration, which might be largely mediated by clinical factors, such as hemodynamic status.
Trial registration:UMIN-CTR UMIN000009015, Registered 1 October 2012
Keywords:Propofol, Target-controlled infusion, Polymorphism, Sex difference, Mean blood pressure, Heart rate, Volume of intravenous fluid
* Correspondence:[email protected] 1
Department of Clinical Pharmacology, Faculty of Medical Sciences, Kyushu University, Maidashi 3-1-1, Higashi-ku, Fukuoka 812-8582, Japan
4Clinical Research Center, Fukuoka Mirai Hospital, Kashiiteriha 3-5-1,
Higashi-ku, Fukuoka 813-0017, Japan
Full list of author information is available at the end of the article
Background
Propofol (2,6-diisopropyl-phenol) is commonly used in induction and maintenance of general anesthesia due to its rapid onset, relatively short emergence time, and favorable safety profile. The target-controlled infusion (TCI) system is widely used to administer propofol. Diprifusor™is a TCI system that automatically regulates propofol dose using a pharmacokinetic model to achieve a target blood concentration [1]. Body weight is used as an input parameter for Diprifusor™. Predicted plasma propofol concentration (Cp) and measured plasma pro-pofol concentration (Cm) were found to be correlated, in spite of the slightly greater values of Cm compared to Cp [1–4]. If Cm is higher than Cp, arousal delay may occur; if Cm is lower than Cp, it may lead to intraopera-tive body movement and awakening during surgery, which may result in poor prognosis for the patient.
Regarding the pharmacokinetics of propofol, sex has been reported to influence propofol metabolism and the effect of propofol, in addition to age, height, and weight [5–15]: for example, propofol metabolism in women is faster than that in men, and women awake faster than men. For clinical factors, hemodynamic state might also affect the accuracy of the TCI system [16], because the clearance of propofol depends on the hepatic blood flow [17–19].
In addition, genetic polymorphisms of the propofol metabolism enzymes have been shown to affect propofol blood concentration. The biotransformation of propofol is greatly dependent on liver metabolism [17–19], and
cytochrome P450 (CYP) 2B6 and uridine diphosphate (UDP)-glucuronosyltransferase (UGT) 1A9, the main enzymes involved in propofol metabolism, are respon-sible for the hydroxylation and glucuronidation of pro-pofol [20–22]. Single-nucleotide polymorphisms (SNPs) in CYP2B6 and UGT1A9 might contribute to the inter-individual variability in the rate of formation of propofol metabolites [21–23], while several studies re-ported no significant effect of these SNPs on propofol metabolism [7,8,10,24].
Although previous studies investigated the contribu-tion of sex and polymorphisms of propofol metabolizing enzymes on propofol blood concentration under single intravenous bolus or short-term propofol infusion [7, 8,
10–16], the influence of those factors on the accuracy of Diprifusor™ during long-term propofol infusion remains unclear.
Herein, we examined whether sex and polymorphisms of CYP2B6 and UGT1A9 affect the difference between the predicted concentration and actual plasma propofol concentration in the perioperative period with continu-ous propofol infusion of 4 h.
Methods
Main outcome and patient selection
The main outcome of the study was the difference between Cp and Cm around the maintenance concentra-tion of propofol in surgery, which was evaluated using percentage performance error (PE) as follows: PE (%) = (Cm - Cp)/Cp × 100.
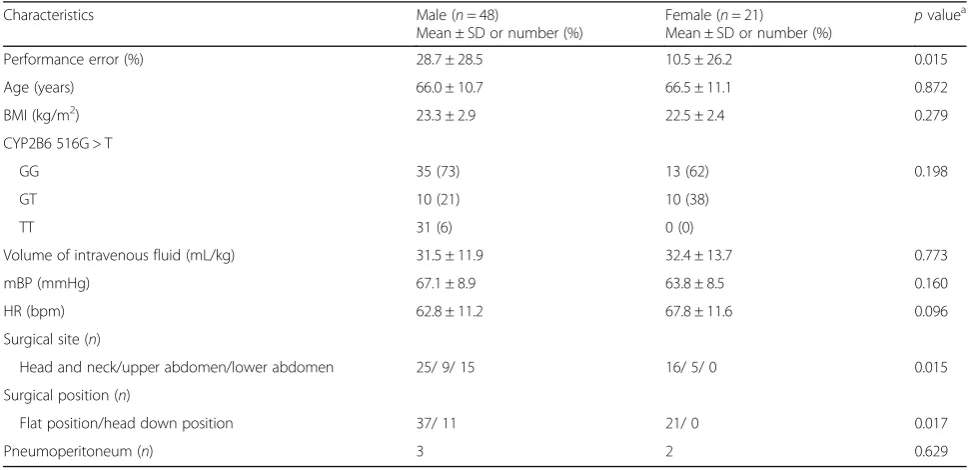
Table 1Baseline characteristics and clinical factors of the study subjects stratified by sex
Characteristics Male (n= 48)
Mean ± SD or number (%)
Female (n= 21)
Mean ± SD or number (%)
pvaluea Performance error (%) 28.7 ± 28.5 10.5 ± 26.2 0.015 Age (years) 66.0 ± 10.7 66.5 ± 11.1 0.872 BMI (kg/m2) 23.3 ± 2.9 22.5 ± 2.4 0.279
CYP2B6 516G > T
GG 35 (73) 13 (62) 0.198
GT 10 (21) 10 (38)
TT 31 (6) 0 (0)
Volume of intravenous fluid (mL/kg) 31.5 ± 11.9 32.4 ± 13.7 0.773 mBP (mmHg) 67.1 ± 8.9 63.8 ± 8.5 0.160 HR (bpm) 62.8 ± 11.2 67.8 ± 11.6 0.096 Surgical site (n)
Head and neck/upper abdomen/lower abdomen 25/ 9/ 15 16/ 5/ 0 0.015 Surgical position (n)
Flat position/head down position 37/ 11 21/ 0 0.017 Pneumoperitoneum (n) 3 2 0.629
a
ttest or chi-square test
We included patients aged ≥20 years, underwent anesthesia (expected anesthesia time≥4 h) in spine and lat-eral positions by administration of propofol by TCI, and monitored with direct arterial blood pressure. We excluded those with anemia (hemoglobin < 10 g/dl), liver dysfunction (Child-Pugh B or C), renal dysfunction (eGFR < 30 ml/min/ 1.73m2), American Society of Anesthesiologists-physical status (ASA-PS) class III/IV, hepatic or renal surgery, and psychoneurotic disorders or psychiatric pharmacotherapy.
Of 70 eligible patients, we excluded one outlier of 39-year-old woman with a great discrepancy in Cp and Cm (PE = 267.9%) due to a possible technical error; 69 patients (48 men and 21 women) comprised the study subject. A prior analysis included the excluded patient showed the similar trend (data not shown).
Measurement of propofol concentration and clinical parameters
Anesthesia was induced and maintained with continuous infusion of remifentanil and propofol. A propofol TCI sys-tem (TE-371, TERUMO, Tokyo, Japan) was used to administer propofol. The infusion rates of propofol and remifentanil were adjusted by the anesthesiologists in charge according to the patients’condition. Direct arterial blood pressure, heart rate (HR), ECG, SpO2, central core temperature, and end tidal CO2were recorded throughout all operations. Bispectral index (BIS, QE-910P, Nihon Kohden, Tokyo, Japan) were applied unless it did not dis-turb the procedure of the surgeries.
Blood samples were collected from the radial artery at 4 h after initial propofol infusion after matching pre-dicted blood concentration and effect-site concentration displayed on the TCI devices. When the duration of pro-pofol infusion was < 4 h, the sample was collected before changing the target blood concentration. Mean blood pressure (mBP) and HR were recorded at the time of sample collection. Total volume of intravenous fluid was measured from initial propofol infusion to blood sample collection. Blood samples were used for gene poly-morphism analysis and measurement of plasma propofol concentration. Although the time of blood pressure be-fore blood sample collection might affect the concentra-tion of propofol, a prior analysis using blood pressure of 10 min before blood sampling showed the same results (data not shown).
The plasma concentration of propofol was determined by a modified method of a previous report [25] by a commercial laboratory, BML, Inc. (Tokyo, Japan), using a reverse phase high-performance liquid chromatog-raphy system (Hitachi High-Technologies Corporation, Tokyo, Japan, and Shimadzu Corporation, Kyoto, Japan) with a Hypersil C18 reversed-phase column (3 μm par-ticle size, 100 × 5.0 mm I.D.). The excitation and emis-sion wavelength were 276 and 310 nm, respectively.
Blood samples were centrifuged (1150gfor 10 min) and stored at 4 °C. A calibration graph was created by plot-ting the ratios of the areas for propofol to those for thymol (internal standard) from 0.2 to 5 μg/ml. The limit of quantitation was 0.1μg/ml.
a
c
Performance error (%)
Male Female
-50 0 50 100 150
p = 0.015
Cm (µg/mL)
Cp (µg/mL)
1.0 1.5 2.0 2.5 3.0 3.5 4.0
1 2 3 4 5 6
1.0 1.5 2.0 2.5 3.0
1 2 3 4
Cm (µg/mL)
Cp (µg/mL)
b
Genotyping
Genomic DNA was extracted from peripheral blood with a DNA isolation kit (GenTLE; Takara Bio, Ohtsu, Japan). Genotyping of CYP2B6 499 C > G (rs3826711), 785 A > G (rs2279343), 1375 A > G, and 1459 C > T (rs3211371) was performed by polymerase chain reaction with restriction fragment length polymorphism method. CYP2B6 516 G > T (rs3745274), UGT1A9 i399C > T (rs2741049), and 766 G > A (rs58597806) SNPs were identified by validated TaqMan SNP Genotyping Assays (assay ID: C_78 17765_60, C_34816143_20, and C_9096281_10, respect-ively) (Life Technologies, Carlsbad, California, USA) using an ABI 7500 Real-Time PCR system (Life Technologies) and TaqMan®Universal Master Mix II with UNG (Life Technologies) according to the manufacturer’s instruction. CYP2B6 and UGT1A9 genotypes were determined by an investigator blinded to individual information. The ob-served allelic frequencies conformed to Hardy-Weinberg equilibrium (data not shown).
Statistical analysis
To assess the contribution of sex and polymorphisms for PE separately, crude regression coefficients (β) and 95% confidence intervals (CI) of female sex and CYP2B6 516G > T polymorphisms were, respectively, estimated with linear regression (model 1). In addition, we minim-ally adjusted for baseline characteristics (age and BMI) in model 2 and fully adjusted for baseline characteristics (age and BMI) and clinical factors (mBP, HR, volume of intravenous fluid, surgical site, head down position, pneumoperitoneum) in model 3. Those covariates were adjusted as mediators for the association; other clinical factors, such as BIS scores and body temperature, were not included for covariates because those did not affect sex differences of PE in a prior analysis (Additional file1: Table S1).
In mutual adjusted models, we included explanatory variables of female sex and CYP2B6 516G > T polymor-phisms simultaneously (model 4). Additionally, we min-imally adjusted for baseline characteristics (model 5) and fully adjusted for baseline characteristics and clinical fac-tors (model 6). In the mutual adjusted models, due to the lack of female patients with CYP2B6 516TT poly-morphisms, we excluded three male patients with CYP2B6 516TT polymorphisms.
Alpha was set at 0.05, and allpvalues were two-sided. Data were analyzed using JMP Pro 11.0.0 (SAS Institute Inc., Tokyo, Japan).
Results
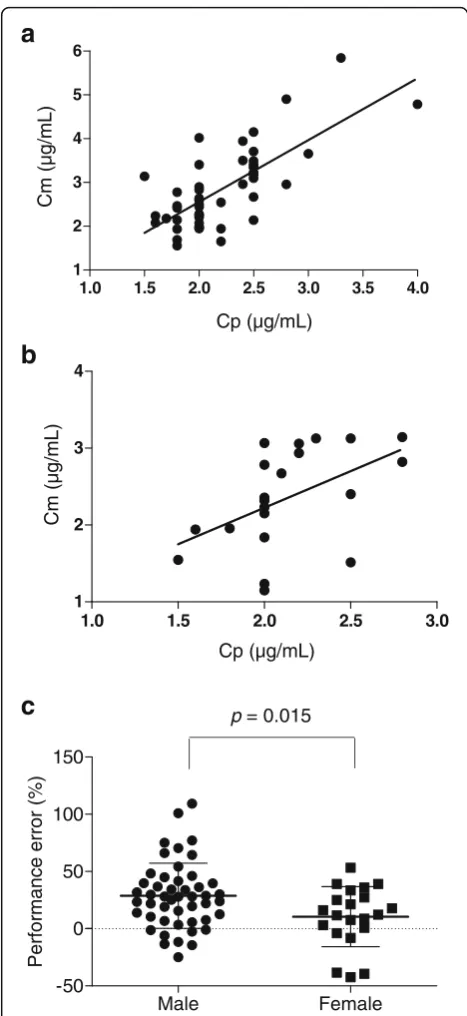
The baseline characteristics and clinical factors did not differ between men and women (Table 1). Cp and Cm were statistically correlated: the correlation coefficients were, respectively, 0.73 in men (p< 0.001, Fig. 1a) and
0.50 in women (p< 0.001, Fig.1b). The average of PE in men was significantly higher than that in women (28.7% versus 10.5%,p= 0.015, Table1and Fig.1c).
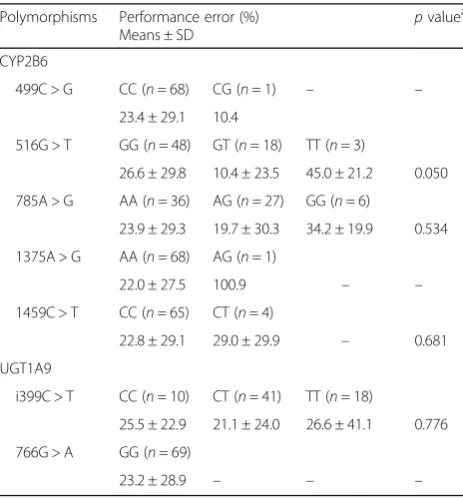
The results of CYP2B6 and UGT1A9 SNPs analyses are shown in Table 2 and Additional file 2: Table S2. Although the allele frequencies for any polymorphisms did not statistically differ between men and women (Additional file2: Table S2), the average of PE tended to differ between CYP2B6 516G > T polymorphisms (p= 0.050, Table2).
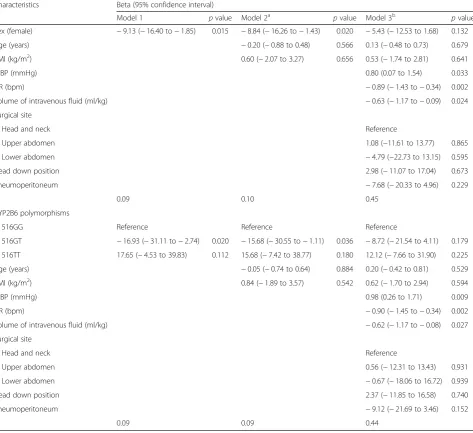
In regression analysis, female sex was inversely associ-ated with PE (Table 3): the minimal adjusted β=−8.84 (95% CI, −16.26 to −1.43). However, the association was substantially attenuated and became not significant on the full-adjustment with clinical factors (model 3, Table 3). Likewise, compared with CYP2B6 516GG, CYP2B6 516G > T polymorphisms was inversely associ-ated with PE in the crude and minimally adjusted models (Table3). However, the association was substan-tially attenuated and became not significant on the full-adjustment with clinical factors (model 3, Table 3). CYP2B6 516TT polymorphisms were not associated with PE.
In the mutual model, βof female sex was significant, butβof CYP2B6 516G > T polymorphisms was not sig-nificant (model 4, Table 4). The association of female sex was marginally significant on the minimal adjust-ment with baseline characteristics (model 5, Table 4); however, the association was substantially attenuated and became not significant in the full-adjusted model
Table 2Mean values and standard deviation of performance error stratified by polymorphisms
Polymorphisms Performance error (%)
Means ± SD p valuea CYP2B6
499C > G CC (n= 68) CG (n= 1) – – 23.4 ± 29.1 10.4
516G > T GG (n= 48) GT (n= 18) TT (n= 3)
26.6 ± 29.8 10.4 ± 23.5 45.0 ± 21.2 0.050 785A > G AA (n= 36) AG (n= 27) GG (n= 6)
23.9 ± 29.3 19.7 ± 30.3 34.2 ± 19.9 0.534 1375A > G AA (n= 68) AG (n= 1)
22.0 ± 27.5 100.9 – – 1459C > T CC (n= 65) CT (n= 4)
22.8 ± 29.1 29.0 ± 29.9 – 0.681 UGT1A9
i399C > T CC (n= 10) CT (n= 41) TT (n= 18)
25.5 ± 22.9 21.1 ± 24.0 26.6 ± 41.1 0.776 766G > A GG (n= 69)
23.2 ± 28.9 – – –
a
with clinical factors (model 6, Table4). The clinical fac-tors, mBP, HR, and volume of intravenous fluid were independently associated with PE (model 3 in Table 3
and model 6 in Table4).
Discussion
This is the first study to investigate PE associated with sex and polymorphisms of CYP2B6 and UGT1A9, with clinical factors, after long-term propofol infusion. We found that PE in women was closer to 0 than that in men, which might indicate that the propofol TCI system is more accurate in women than in men.
A number of reports have suggested that the plasma concentration of propofol decreases more rapidly in women than in men, and that women tend to recover faster from propofol anesthesia than men [7–9, 11–15]. Loryan et al. suggested this sex difference was due to the fact that women’s livers have 1.9-fold greater CYP2B6 protein levels than men [7]. In this study, the mean PE in the perioperative period was significantly lower in women than in men, which might be caused by the sex difference of propofol pharmacokinetics.
The genetic background of propofol-metabolizing en-zymes, CYP2B6 and UGT1A9, may vary propofol metabol-ite levels [20–22]; however, the association is controversial.
Table 3Regression coefficients of sex and CYP2B6 516G > T polymorphisms for performance errors estimated with linear regression, adjusted for background characteristics and clinical factors
Characteristics Beta (95% confidence interval)
Model 1 pvalue Model 2a pvalue Model 3b pvalue
Sex (female) −9.13 (−16.40 to−1.85) 0.015 −8.84 (−16.26 to−1.43) 0.020 −5.43 (−12.53 to 1.68) 0.132 Age (years) −0.20 (−0.88 to 0.48) 0.566 0.13 (−0.48 to 0.73) 0.679 BMI (kg/m2) 0.60 (−2.07 to 3.27) 0.656 0.53 (−1.74 to 2.81) 0.641 mBP (mmHg) 0.80 (0.07 to 1.54) 0.033 HR (bpm) −0.89 (−1.43 to−0.34) 0.002 Volume of intravenous fluid (ml/kg) −0.63 (−1.17 to−0.09) 0.024 Surgical site
Head and neck Reference
Upper abdomen 1.08 (−11.61 to 13.77) 0.865 Lower abdomen −4.79 (−22.73 to 13.15) 0.595 Head down position 2.98 (−11.07 to 17.04) 0.673 Pneumoperitoneum −7.68 (−20.33 to 4.96) 0.229
R2
0.09 0.10 0.45
CYP2B6 polymorphisms
516GG Reference Reference Reference
516GT −16.93 (−31.11 to−2.74) 0.020 −15.68 (−30.55 to−1.11) 0.036 −8.72 (−21.54 to 4.11) 0.179 516TT 17.65 (−4.53 to 39.83) 0.112 15.68 (−7.42 to 38.77) 0.180 12.12 (−7.66 to 31.90) 0.225 Age (years) −0.05 (−0.74 to 0.64) 0.884 0.20 (−0.42 to 0.81) 0.529 BMI (kg/m2) 0.84 (−1.89 to 3.57) 0.542 0.62 (−1.70 to 2.94) 0.594 mBP (mmHg) 0.98 (0.26 to 1.71) 0.009 HR (bpm) −0.90 (−1.45 to−0.34) 0.002 Volume of intravenous fluid (ml/kg) −0.62 (−1.17 to−0.08) 0.027 Surgical site
Head and neck Reference
Upper abdomen 0.56 (−12.31 to 13.43) 0.931 Lower abdomen −0.67 (−18.06 to 16.72) 0.939 Head down position 2.37 (−11.85 to 16.58) 0.740 Pneumoperitoneum −9.12 (−21.69 to 3.46) 0.152
R2
0.09 0.09 0.44
a
Adjusted for age and BMI (model 2)
b
Additional adjustment for mBP, HR, volume of intravenous infusion, surgical site, head down position, and pneumoperitoneum (Model 3)
Several studies have reported the effects of SNPs in CYP2B6 and UGT1A9 on propofol metabolism [7, 20,
21, 23, 24, 26], for example, Takahashi et al. reported that D256N polymorphism in UGT1A9 lowers en-zyme activity in an in vitro study, suggesting carriers of D256N might be at risk of suffering adverse effects of propofol [21]; Kansaku et al. found that SNPs CYP2B6 G516T and UGT1A9 I399C > T determined the pharmacokinetics and pharmacodynamics of pro-pofol [23]; and Mastrogianni et al. reported a strong trend towards the association of the CYP2B6 G516T variant with high blood propofol concentrations after a single bolus dose [26]. In contrast, other studies re-ported no significant effects of these SNPs on propo-fol metabolism [7, 8, 10, 24], which partially concur with our study.
In our study, it should be noted that clinical factors of hemodynamic status (HR and mBP), which could influence the hepatic blood flow, may substantially mediate the sex difference of PE. A higher tendency of HR in women (Table 1, p= 0.096) might partly ex-plain the mediation in our study, given the fact that propofol is mostly metabolized in the liver, and the hepatic clearance of propofol depends on the hepatic blood flow [17–19]. Volume of intravenous fluid was inversely associated with PE, which could be ex-plained by the decreased concentration of propofol due to increased plasma volume and the increased propofol metabolism rate due to increased hepatic blood flow.
This study had some limitations. First, we collected only one sample for each subject. More samples are usu-ally collected for the external evaluation of TCI system. Second, more hemodynamic information, such as car-diac output, which can enhance liver blood flow is re-quired. We only have the data of blood pressure and HR at the time of sample collection. Third, the target concentration of propofol was determined by the anesthesiologist in charge according to the patients’ con-dition because this was an observational study. Fourth, blood laboratory test was not conducted at the time of sample collection; therefore, serum albumin or hemoglobin values were not obtained. Lastly, due to the small sample size with insufficient statistical power, we could not fully assess CYP2B6 and UGT1A9 polymor-phisms, in relation to sex and clinical factors. Further studies with a large number of patients are needed to clarify the influence of CYP2B6 and UGT1A9 polymor-phisms on the accuracy of propofol TCI system.
Conclusions
The accuracy of estimated propofol concentration by Diprifusor™TCI system appeared to differ between men and women in our population. The PE in men was higher than in women which might be mainly caused by hemodynamic status. Although this study did not show significant influence of CYP2B6 and UGT1A9 polymor-phisms, further studies are expected to elucidate the effect of those polymorphisms.
Table 4Regression coefficients estimated with linear regression, mutually adjusted for sex and CYP2B6 516G > T polymorphisms
Characteristicsa Beta (95% confidence interval)
Model 4b pvalue Model 5c pvalue Model 6c pvalue Sex (female) −7.50 (−14.89 to−0.12) 0.047 −7.26 (−14.81 to 0.29) 0.059 −4.50 (−12.02 to 3.02) 0.236 CYP2B6 516GT −6.80 (−14.52 to 0.93) 0.084 −6.86 (−14.81 to 1.08) 0.089 −2.08 (−9.20 to 5.04) 0.560 Age (years) 0.02 (−0.70 to 0.74) 0.946 0.17 (−0.49 to 0.82) 0.614 BMI (kg/m2) 0.78 (−1.97 to 3.53) 0.574 0.44 (−1.96 to 2.85) 0.713
mBP (mmHg) 0.85 (0.08 to 1.63) 0.032 HR (bpm) −0.88 (−1.46 to−0.30) 0.004 Volume of intravenous fluid (ml/kg) −0.58 (−1.14 to−0.02) 0.043 Surgical site
Head and neck Reference
Upper abdomen 1.36 (−11.77 to 14.49) 0.836 Lower abdomen −4.06 (−22.58 to 14.46) 0.662 Head down position 2.82 (−11.62 to 17.26) 0.697 Pneumoperitoneum −7.60 (−20.59 to 5.40) 0.246
R2 0.12 0.13 0.44
a
Due to the lack of women with CYP2B6 516TT in the data set, analyzed subjects were restricted to those with CYP2B6 516GG (n= 48) and CYP2B6 516GT (n= 18)
b
Linear regression, mutually adjusted for sex and CYP2B6 516G > T polymorphisms (model 4)
c
Additional adjustment for age and BMI (model 5); age, BMI, mBP, HR, volume of intravenous infusion, surgical site, head down position, and pneumoperitoneum (model 6)
Additional files
Additional file 1:Table S1.Other background characteristics of the study subjects stratified by sex. (DOCX 15 kb)
Additional file 2:Table S2.Genetic polymorphisms of CYP2B6 and UGT1A9 by stratified sex. (DOCX 14 kb)
Abbreviations
ALT:Alanine amino transferase; ASA-PS: American Society of
Anesthesiologists-physical status; BIS: Bispectral index; BMI: Body mass index; CI: Confidence interval; Cm: Measured plasma propofol concentration; Cp: Predicted plasma propofol concentration; CYP2B6: Cytochrome P450 2B6; eGFR: Estimated glomerular filtration rate; HR: Heart rate; mBP: Mean blood pressure; PE: Performance error; SNPs: Single-nucleotide polymorphisms; TCI: Target-controlled infusion; UGT1A9: Uridine diphosphate (UDP)-glucuronosyltransferase 1A9
Acknowledgements
We thank Editage (www.editage.jp) for editing a draft of this manuscript.
Availability of data and materials
The datasets generated and analyzed during the current study are not publicly available due to the Japanese Ethical Guidelines for Medical and Health Research, but might be available from the corresponding author on reasonable request.
Authors’contributions
TY, KH, HS, and TS conceived and designed the study and wrote the protocol. AF, TY, KM, KS, and HS recruited participants, obtained informed consent, and acquired the data and blood samples. FS determined participants’genotype. AF, TY, KH, HA, MZ, and TS analyzed and interpreted the data. AF, TY, and MZ drafted the manuscript, and all authors approved the final version.
Ethics approval and consent to participate
Ethical approval for this prospective observational study was provided by the Independent Ethics Committee of Kyushu Medical Center, Fukuoka, Japan (approval number 12-55), and registered in the UMIN Clinical Trial Registration (Registration number UMIN000009015). The study was conducted in compliance with the Declaration of Helsinki, Ethical Guidelines for Clinical Research, Japan, 2008, and Ethical Guidelines for Human Genome/Gene Analysis Research, Japan, 2008. Patients were recruited from October 2012 to September 2013, and written informed consent was obtained from all patients.
Consent for publication
Not applicable
Competing interests
The authors declare that they have no competing interests.
Publisher’s Note
Springer Nature remains neutral with regard to jurisdictional claims in published maps and institutional affiliations.
Author details
1
Department of Clinical Pharmacology, Faculty of Medical Sciences, Kyushu University, Maidashi 3-1-1, Higashi-ku, Fukuoka 812-8582, Japan.2Department
of Anesthesiology, Chihaya Hospital, Chihaya 2-30-1, Higashi-ku, Fukuoka, Japan.3Department of Anesthesiology and Critical Care Medicine, Faculty of
Medical Sciences, Kyushu University, Maidashi 3-1-1, Higashi-ku, Fukuoka 812-8582, Japan.4Clinical Research Center, Fukuoka Mirai Hospital,
Kashiiteriha 3-5-1, Higashi-ku, Fukuoka 813-0017, Japan.5Department of
Social and Behavioral Sciences, Harvard T.H. Chan School of Public Health, 677 Huntington Ave, Boston, MA 02115, USA.6Department of Public Health, Graduate School of Medicine, The University of Tokyo, Hongo 7-3-1, Bunkyo-ku, Tokyo 113-0033, Japan.7Department of Preventive Medicine and
Public Health, Faculty of Medicine, Fukuoka University, Nanakuma 8-19-1, Jonan-ku, Fukuoka 814-0180, Japan.8Department of Anesthesiology, Kyushu Medical Center, Jigyohama 1-8-1, Chuo-ku, Fukuoka 810-8563, Japan.
9Yamamoto Memorial Hospital, Hachiyagarami 88-4, Niricho, Imari, Saga
848-0031, Japan.
Received: 25 April 2018 Accepted: 3 August 2018
References
1. Glen JB. The development of“Diprifusor”: a TCI system for propofol. Anaesthesia. 1998;53(Suppl 1):13–21.
2. Swinhoe CF, Peacock JE, Glen JB, Reilly CS. Evaluation of the predictive performance of a“Diprifusor”TCI system. Anaesthesia. 1998;53(Suppl 1):61–7. 3. Kazama T, Ikeda K, Numata K, Kugimiya T, Kikuchi T, Yogosawa T, Abe H,
Mori K, Murakawa M, Yoshiya I, Haruna M, Koh S, Matsumoto H, Yuge O, Hidaka S, Toyooka H. Assessment of use of“Diprifusor”target controlled infusion (TCI) of 1% Diprivan (ICI 35,868) [in Japanese]. Anesth Resus. 1998; 34:121–39.
4. Li Y, Xu J, Yang J, Tian J, Xu J. Predictive performance of“Diprifusor”TCI system in patients during upper abdominal surgery under propofol/fentanyl anesthesia. J Zhejiang Univ Sci B. 2005;6:43–8.
5. Kirkpatrick T, Cockshott ID, Douglas EJ, Nimmo WS. Pharmacokinetics of propofol (diprivan) in elderly patients. Br J of Anaesth. 1988;60:146–50. 6. Schnider TW, Minto CF, Gambus PL, Andresen C, Goodale DB, Shafer SL,
Youngs EJ. The influence of method of administration and covariates on the pharmacokinetics of propofol in adult volunteers. Anesthesiology. 1998; 88:1170–82.
7. Loryan I, Lindqvist M, Johansson I, Hiratsuka M, Van Der Heiden I, Van Schaik RH, Jakobsson J, Ingelman-Sundberg M. Influence of sex on propofol metabolism, a pilot study: implications for propofol anesthesia. Eur J Clin Pharmacol. 2012;68:397–406.
8. Choong E, Loryan I, Lindqvist M, Nordling A, El Bouazzaoui S, van Schaik RH, Johansson J, Jakobsson J, Ingelman-Sundberg M. Sex difference in formation of propofol metabolites: a replication study. Basic Clin Pharmacol Toxicol. 2013;113:126–31.
9. Kodaka M, Suzuki T, Maeyama A, Koyama K, Miyao H. Gender differences between predicted and measured propofol CP50 for loss of consciousness. J Clin Anesth. 2006;18:486–9.
10. Kanaya A, Sato T, Fuse N, Yamaguchi H, Mano N, Yamauchi M. Impact of clinical factors and UGT1A9 and CYP2B6 genotype on inter-individual differences in propofol pharmacokinetics. J Anesth. 2018;32:236–43. 11. Gan TJ, Glass PS, Sigl J, Sebel P, Payne F, Rosow C, Embree P. Women
emerge from general anesthesia with propofol/alfentanil/nitrous oxide faster than men. Anesthesiology. 1999;90:1283–7.
12. Hoymork SC, Raeder J. Why do women wake up faster than men from propofol anaesthesia? Br J of Anaesth. 2005;95:627–33.
13. Wilhelm W, Buchinger H, Biedler A, Altmann S, Larsen R, Kreuer S. Influence of gender on propofol consumption and recovery times. Anaesthesist. 2005; 54:567–74.
14. Haensch K, Schultz A, Krauss T, Grouven U, Schultz B. Women need more propofol than men during EEG-monitored total intravenous anaesthesia. Biomed Tech (Berl). 2009;54:76–82.
15. Campesi I, Fois M, Franconi F. Sex and gender aspects in anesthetics and pain medication. Handb Exp Pharmacol. 2012;214:265–78.
16. Takizawa D, Hiraoka H, Nakamura K, Yamamoto K, Horiuchi R. Influence of the prone position on propofol pharmacokinetics. Anaesthesia. 2004;59: 1250–1.
17. Servin F, Desmonts JM, Haberer JP, Cockshott ID, Plummer GF, Farinotti R. Pharmacokinetics and protein binding of propofol in patients with cirrhosis. Anesthesiology. 1988;69:887–91.
18. Servin F, Cockshott ID, Farinotti R, Haberer JP, Winckler C, Desmonts JM. Pharmacokinetics of propofol infusions in patients with cirrhosis. Br J of Anaesth. 1990;65:177–83.
19. Servin F, Farinotti R, Haberer JP, Desmonts JM. Propofol infusion for maintenance of anesthesia in morbidly obese patients receiving nitrous oxide. A clinical and pharmacokinetic study. Anesthesiology. 1993;78:657–65. 20. Court MH, Duan SX, Hesse LM, Venkatakrishnan K, Greenblatt DJ. Cytochrome
P-450 2B6 is responsible for interindividual variability of propofol hydroxylation by human liver microsomes. Anesthesiology. 2001;94:110–9.
21. Takahashi H, Maruo Y, Mori A, Iwai M, Sato H, Takeuchi Y. Effect of D256N and Y483D on propofol glucuronidation by human uridine 5′-diphosphate glucuronosyltransferase (UGT1A9). Basic Clin Pharmacol Toxicol. 2008;103: 131–6.
23. Kansaku F, Kumai T, Sasaki K, Yokozuka M, Shimizu M, Tateda T, Murayama N, Kobayashi S, Yamazaki H. Individual differences in pharmacokinetics and pharmacodynamics of anesthetic agent propofol with regard to CYP2B6 and UGT1A9 genotype and patient age. Drug Metab Pharmacokinet. 2011; 26:532–7.
24. Iohom G, Ni Chonghaile M, O’Brien JK, Cunningham AJ, Fitzgerald DF, Shields DC. An investigation of potential genetic determinants of propofol requirements and recovery from anaesthesia. Eur J Anaesthesiol. 2007;24:912–9.
25. Plummer GF. Improved method for the determination of propofol in blood by high-performance liquid chromatography with fluorescence detection. J Chromatogr. 1987;421:171–6.