DOI 10.1007/s12544-015-0173-5
ORIGINAL PAPER
Advanced Train Location Simulator (ATLAS)
for developing, testing and validating
on-board railway location systems
Jon Goya1 ·Leticia Zamora-Cadenas1·Saioa Arrizabalaga1·Alfonso Braz´alez1· Juan Mel´endez1·Jaizki Mendizabal1
Received: 29 October 2014 / Accepted: 11 June 2015 / Published online: 28 June 2015 © The Author(s) 2015. This article is published with open access at Springerlink.com
Abstract Purpose This article focuses on a novel
Advanced Train LocAtion Simulator (ATLAS) for on-board railway location using wireless communication technolo-gies, such as satellite navigation and location based systems. ATLAS allows the creation of multiple simulation environ-ments providing a versatile tool for testing and assessing new train location services. This enhancement reduces the number of tests performed in real scenarios and trains, reducing the cost and development time of new location sys-tems as well as assessing the performance level for given tracks.
Methods The simulation platform is based on modular blocks, where each block can be replaced or improved. The
This work was supported by the European Community’s Framework Program FP7/2007-2013 in the frame of EATS project under the grant agreement nr. 31419.
This work has been possible thanks to the support of the computing infrastructure of the i2BASQUE academic network. Jon Goya
Leticia Zamora-Cadenas [email protected] Saioa Arrizabalaga [email protected] Alfonso Braz´alez [email protected] Juan Mel´endez [email protected] Jaizki Mendizabal [email protected]
1 CEIT and Tecnun, University of Navarra, Manuel
de Lardiz´abal 15, 20018 San Sebasti´an, Spain
platform uses Monte Carlo Simulation to generate results with statistical significance. This implementation allows the modification of the development platform to cover multiple requirements, such as, ranging errors in the input param-eters or including other positioning technologies. In this paper, the generated input parameter errors have been taken from the results of the field tests realized by the 3GPP ensuring the validity of the used parameter errors. How-ever, these could be easily adapted by the user to particular characterized environments.
Results Case studies for the validation of ATLAS will be also introduced, including preliminary results related to the use of Global System for Mobile communications in Rail-way (GSM-R) and Universal Mobile Telecommunications System (UMTS) technologies for positioning. The valida-tion stage provides a way to test the platform funcvalida-tionalities and verify its flexibility.
Conclusions The versatility of the platform to perform simulations using same configuration parameters for dif-ferent case studies can be highlighted. Furthermore, first conclusions are drawn from the obtained results. The char-acterization of the infrastructure for the simulation and the performance improvement of the location systems in the tunnels (e.g., by including Inertial Measurement Unit (IMU)) are necessary to achieve accuracy levels that can be valid for ETCS level 3.
Keywords Railway·Location·Positioning·Simulation· GNSS·GSM-R·UMTS·Wireless communications
1 Introduction
infrastructures. The heavily congested tracks are being used below their maximum capability, thereby producing minor operation delays and other disturbances that affect to the transport service quality. The latest advances to solve this problem include the use of new on-board location systems that should increase the capability of the rail transportation and hence, its efficiency, decreasing infrastructure the costs. The main drawback detected in the use of on-board location systems in the railway industry is the inability of providing a real time train position in every point of the tracks. Satellite based systems, the most widespread tech-nologies to position globally, suffer from coverage problems mainly in urban environments. The environment orography is also an issue that affects to the availability of the satellite signals, e.g., canyons and tunnels.
A number of European research projects have dealt with this issue of increasing availability and reaching required accuracy and safety levels in on-board location systems for railway sector. For example, projects such as 3InSat [1], SATLOC [47], LOCOPROL [36], GRAIL [20], GRAIL II [19] and EATS [12], propose the use Global Navigation Satellite Systems (GNSS) along with other technologies such as Global System for Mobile communications (GSM), Universal Mobile Telecommunications System (UMTS) or Inertial Measurement Unit (IMU) for locating the trains at any point along the tracks. Particularly, the LOCO-PROL [36] project reduces the positioning problem to the corresponding point in the track, thereby reducing the 3-dimensional position to only 1-dimension, a unique fea-ture of the railway. The EATS [12] project proposes an on-board Smart Train Positioning System (STPS) based on the combination of different techniques proved use-ful for other industrial sectors with the aim of reaching ETCS level 3 requirements [10, 26, 32]: multi-antenna assembly to reduce multi-path effects and the combina-tion of informacombina-tion sources such as GNSS, UMTS and GSM-Railway (GSM-R) which will provide full cover-age on the tracks even in harsh environments. In general, the on-board hybridization of technologies will be a step forward towards European Train Control System (ETCS) level 3 minimizing track-side costs and maximizing track capacity.
Recently, UNISIG consortium [54] has provided some open issues and recommendations for the future steps of the new location systems. The proposed steps include the defi-nition of the requirements for the on-board GNSS systems, the description of a system to qualify railway lines in regards to GNSS application, and the performance of larger test campaigns [55]. Analyzing the guidelines, and having into account the slow development and expensive cost for field testing in the case of the railway sector, the development of a simulation platform is an essential tool to accomplish with all the objectives and to reduce the design time and cost.
According to the state-of-art of simulation platforms, to our knowledge there has not been reported any simulation platform for on-board location systems in the railway sec-tor. In this work, an Advanced Train LocAtion Simulator (ATLAS) for positioning systems is presented. ATLAS is a powerful configurable and modular framework to test differ-ent location systems in railway and to compare all of them under the same conditions of itinerary, coverage, etc. This modular platform allows the design of different receivers architectures, the use of several positioning technologies, the implementation of different data fusion strategies and the simulation of specific environments.
The rest of this article is organized as follows. Section2
highlights the main technical and scientific challenges of a test platform for railway location systems. Section3 anal-yses the main parameters that affect the location systems in railway sector. Section4explains the aim of the ATLAS platform and its design. Section5describes the main config-uration options of the ATLAS tool and Section6the ATLAS platform core. Section 7presents the case studies for the simulation platform validation. Finally, some conclusions and lines for future research are drawn in Section8.
2 Technical problems in simulators for railway location systems
The aim of a railway location simulation platform is testing and comparing a broad range of location system strategies in railway sector, while reducing the design time and cost. Since field testing implies high costs in railway environ-ment, this objective can only be achieved by using powerful simulation platforms. Moreover, considering the high num-ber of configurations and possibilities to be compared, the following characteristics should also be fulfilled by such a simulation platform:
– High configurability: every function block should be highly configurable.
– Reusability: output of one function block should be reusable by different posterior function block.
– Modularity and Extensibility: different functional blocks should be implemented in a modular fashion (with known interfaces to connect the different blocks), so that new functionalities are easily introduced by substituting one functional block with a new one. There are several railway simulators focused on differ-ent areas of the railway operational aspects as signaling, railway network, logistics or timetable assessments [3,34,
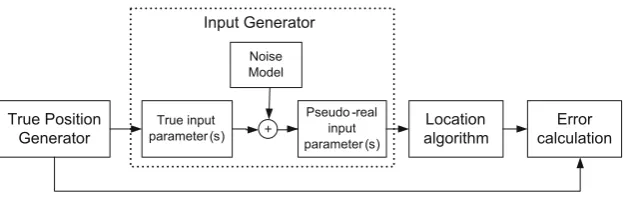
realistic graphical interfaces and visualizations are a key aspect of the platforms. Moreover, they incorporate oper-ational procedures with the track side. They might offer realistic train models and routes, but the only information related to location is the traveled distance. Finally, there are a few tools useful for location systems in railways such as PEDRISSAT [37], in order to provide information about the availability of satellites in a specific route based on the images captured with a camera on the train. None of the railway-related simulators is entirely focused on testing location services on railways. Moreover, it could be initially thought that non-railway simulators could also be useful for this purpose. That is why the use of generic —not rail-way specific— location simulators has been also taken into consideration. Actually, a variety of test platforms for loca-tion systems have been analyzed [7,11,49,51,52]. They have been implemented ad-hoc with the aim of designing, testing and analyzing the performance of several location algorithms. Moreover, they all share the common architec-ture shown in Fig.1that contains the following functional blocks:
– True position generator: the node(s) kinematic is repro-duced, based on a trajectory and/or speed. It is the base information for the Input Generator.
– Input Generator: based on a true position, this mod-ule generates the true input parameters that are used by the location algorithm being developed. A noise error is added to the true values so that pseudo-real inputs are used for the location algorithm.
– Location algorithm: with the pseudo-real input parame-ters (or with inputs coming from field testing) is able to estimate the position of the node(s).
– Error calculation: The output of the location algorithm is compared with the true position, in order to assess the error of the algorithm.
Regarding the test platforms analyzed, none of the true position generators is suitable for the railway location sys-tem. The platforms presented from [7,51,52] simulate only one node in a fixed trajectory and are not configurable. Ref-erence [11] only offers one vehicle simulation, although it allows to configure some parameters. In contrast, sev-eral nodes are desirable to be simulated simultaneously in an advanced railway location system, as it is expected to hybridize their estimations due to the advantage that pro-vides the fusion of different input information. Moreover, these nodes will be located on the roof of the train, so, the kinematic of the train and the exact placement of the nodes on the roof should have to be taken into account by the true position generator. Reference [49] is the only one that offers true positions for several nodes (Peer to Peer, P2P, topologies), but their kinematic is not applicable to the railway environment.
With regard to Input Generator, it must generate the input parameters used by the algorithms that are going to be tested. Ideally, this block should be easily update-able, so that output of the previous True Position Generator could be used by different Input Generators (to test differ-ent family of algorithms while keeping the rest of function blocks unaltered). However, in literature fixed parameters are always generated: in [11] true positions, pitch, yaw, roll and accelerations; in [51], the pilot signal transmitted by a base station to a mobile station through the 3GPP WCDMA FDD downlink; in [52], GPS pseudo-ranges and Angle of Arrival (AoA), Time of Arrival (TOA) and Time Difference of Arrival (TDOA) parameters; in [7], TOA and TDOA and in [49], pseudo-ranges for each P2P node. In all of them, the noise error applied is also fixed, although it seems to be in general configurable, which is a highly desirable character-istic. Only in [49] it is mentioned that the output of the Input Generator can be reused later on by several location algo-rithms. However, this is the only reusable functional block of this test platform. The reusability of all the outputs of all the function blocks would be valuable.
Regarding the algorithms, four scheme or algorithms are compared in [7,49,52], by using statistical measurements of the errors, including Root Mean Square Error (RMSE) values. Reference [11] is more focused on the use of loca-tion estimaloca-tions for crash detecloca-tion, instead of comparing the performance infrastructure information should be taken into account, but also parameters that could affect the loca-tion system performance, which will be analyzed in detail in the following section.
3 Error sources in railway location systems
Fig. 1 Functional block diagram of location system platforms
errors of the ATLAS platform. Figure2shows the four main causes of error in the estimation of a position: the informa-tion sources, the method used to estimate the posiinforma-tion, the environment and the hardware [6,8,24,53,57,58].
3.1 Information Sources
The positioning estimation error is affected directly by the number and quality of the information sources that have been used for the estimation. These sources can rely on sev-eral technologies, but additional considerations need to be made.
Firstly, the transmission rate of each technology. Depend-ing on the strategy followed by the position estimator, some of the received ranges can be obsolete by the time they are used. Moreover, the clock synchronization can cause an offset in the detection of the signal and add extra error, especially in time related positioning algorithms.
Furthermore, the intrinsic accuracy associated with the technology itself makes the position error to range from a few meters in the case of the GNSS, to several hundred, e.g., GSM-R. The use of stand-alone or hybrid technolo-gies for positioning can improve or deteriorate the position estimates. Finally, the number and the distribution of the
receivers, referred in this work as receivers architecture, can help in the positioning using some geometrical constraints.
3.2 Method
The method used in the position estimation contributes to the positioning error in several ways. Firstly, the data con-sistency, related with the validity or integrity of the received information, can present outliers or errors. When these data are used as input of a positioning algorithm, the calculated positions reflect these wrong data and deteriorate the accu-racy of the system. Hence, an appropriate filtering of the input data is necessary prior to be used. Moreover, the time when these data are received and processed is also criti-cal. Using information from pastime instants can lead us to erroneous position estimates.
Another concept related with the method is the selected data fusion strategy. The use of one approach or another has its advantages and drawbacks. Hence, its selection should be carefully studied.
Finally, some positioning algorithms, especially those employed for data fusion, need to set-up the initial con-ditions and performance parameters to work properly. An incorrect selection can increase the resulting error instead
Fig. 3 Advanced train location simulator platform overview
of reducing it. For example, in a weighted algorithm, if the technologies with less mean error have more weight in the position estimation the final result will show a reduction of the positioning error.
3.3 Environment
The environment of the location system may have also a great impact in the error. Even for the same information sources and estimation algorithms.
The infrastructure refers to the number of base transceivers stations (BTSs) or satellites in line-of-sight with the receiver as well as track-side objects, such as the balises. The position estimate can be more or less accurate depending on the number and the geo-localization of these elements [59].
The features of the terrain or the orography may also limit the coverage of the different technologies. There are areas where the reception of the signals is difficult or can be blocked, e.g., canyons and tunnels.
Even when signals are available, environmental features have an impact on the accuracy of the position estimate,
due to the different phenomena that affect to radio propaga-tion. These can be related to the propagation of the signal: GPS traveling through the ionosphere or the attenuation pro-duced by the weather for example. Moreover, this group includes the multipath and interferences that also affect the signal propagation and deteriorate the ranging estimates, and hence the positioning.
Finally, it is worthy to mention that in the case of on-board train location systems, the environment is a changing parameter. The train will move from cities to open areas, where existing infrastructure will be different. This will have an impact on coverage and accuracy.
3.4 Hardware
The hardware failures have been also considered in this Ishikawa analysis as a source of error. Any failure in any of the pieces of the location system, e.g., breakdown of receivers, can cause significant problems when used in a real system. These effects are usually studied with a hazard and operability study (HAZOPS) [9,27]. However, as the objec-tive of this paper is to present the ATLAS platform from the
positioning point of view, this branch will not be analyzed in depth.
Once the main features that affect to the positioning error have been identified, the design of the ATLAS platform will be introduced.
4 ATLAS Platform Design
The ATLAS platform is a modular, flexible and easy to use tool. It reduces the design time and the cost of developing an on-board location system for railway. These features gives the possibility to adapt the platform to new technologies and test specific data fusion strategies for on-board positioning. The aim of this simulation platform is to test on-board location systems in a realistic environment. Moreover, ATLAS allows analyzing the performance of an existing on-board location system in new tracks or different environments.
The simulation platform architecture, shown in Fig.3, is divided in two main functionalities: the ATLAS Config-uration and the ATLAS Core. These two main parts are described in depth in Sections5and6respectively.
The technical evaluation of the problem can be done from different two points of view. First, the minimum RAM (Ran-dom Memory Access) requirements and second, the total simulation time.
RAM requirements have to be analyzed based on a cer-tain problem and evaluating the parameters that affect to it. The following problem is described as an example:
– Track total distance: 224 km – Simulation Step: 1.0 sec
– Speed Profile: Average speed aprox. 70 m/s – Number iterations: 100
The described items set a lower bound to the hard-ware RAM requirements. A change of any of these fac-tors affects directly to the needed requirements for the simulation.
For example, in this case the performance analysis mod-ule has to manage simultaneously 100 files (given by the number of iterations) of 1 MB of size each, which is depen-dent of the track distance, speed profile and simulation step.
In total, for 1 algorithm, 3 algorithm configurations, 1 error configuration, 8 coaches and a receiver per coach, 2400 files need to be analyzed, in groups of 100 files as described.
In relation to the total simulation time, two kinds of factors can be identified as the main contributors. First, the ones that are related with the case studies, such as the number of algorithms, algorithm configurations, error configurations, number of coaches and number of receivers
per coach. Others are related with the hardware directly, number of cores, processor speed, etc.
Nevertheless, the simulation platform is implemented using parallel programming techniques so it can take advan-tage of a scalable distributed computing.
Running the described simulation in a hardware with only 4 cores at 3.20 GHz and 8 GB of RAM needed about 10 hours.
5 Advanced train location simulator configuration
To attain ATLAS platform objectives, all the elements affecting the on-board location system must be config-urable. This configuration is usually a cumbersome and complicated task. Therefore, in ATLAS, the configuration will be independent for each functional block. Further-more, they can be used as standalone modules. Specially the following concepts have been taken into account to be configured: train model, track layout, errors, costs and time synchronization.
5.1 Train model
The train model does not only include train specifications, in addition to this it includes information related to the receivers installed in the train. Firstly, a specific physical train model is selected using the available information of trains that operate in railway nowadays, e.g., “High Speed Train Velaro E” [48]. The number of coaches as well as their dimensions and positioning of bogies are configurable. Sec-ondly, the user distributes antenna receivers in each train coach and selects a technology for each of them, e.g., GPS, UMTS, etc. The placement of these receivers can follow a geometrical distribution which can be reused in more than one coach. So, for example, a triangle distribution can be designed placing an antenna receiver at each of the ver-tices’s of the triangle. Finally, once these two steps are finished, the train is stored in the database and ready to be used in the tests.
5.2 Track layout
environment is also included with the track layout informa-tion. The errors associated to them are explained in the next section.
5.3 Errors
Different sources of error are present in the on-board loca-tion systems. The Ishikawa diagram in Secloca-tion 3 helped to detect the most significant ones related to the position-ing error. Note that the hardware failures considered in Section3.4are out of the scope of this work and will not be analyzed. To model all these errors, different performance zones have been defined in which the introduced error fol-lows a statistical distribution with specific characteristics. The four defined environments are:
– Rural or open sky: without any signal blocked and less than 5% signal affected.
– Suburban: some blocked signal, and the signal affected with medium Multipath/Non Line Of Sight (NLOS). – Urban: lots of signal blocked, and signal affected with
large Multipath/NLOS.
– Tunnel: signal blocked for some technologies, and signal affected with large Multipath/NLOS.
A specific route or the particular travel time can change the behavior of the on-board positioning system as the affected signals can change. To avoid this situation and to represent the performance zones in a more reliable way, it will be possible to define several error distributions for each of the defined environments.
The error distribution will be defined for each informa-tion source in each of the environments (Rural, Suburban, Urban and Tunnel). Moreover, as the Ishikawa diagram shows, the method used in the positioning estimation con-tributes also to the positioning error, so, the positioning algorithm to be used will also be configurable.
5.4 On-board location system costs
For on-board location systems in railway environment, the implementation cost is an important factor. Thus, a trade-off between cost, accuracy and safety specifications must be achieved. Two groups are identified: the hardware cost and the installation cost. The former is bounded by a range of prices. The latter by the number of receivers installed and their distance to the central computer.
5.5 Time synchronization
As mentioned in3.1, signal timing and synchronization are important parameters because of their influence in the posi-tioning error. Related with the ATLAS platform, there is an additional reason to manage these parameters properly.
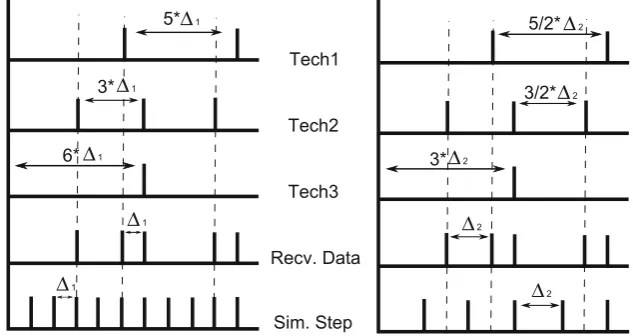
Figure 4 presents a synchronization diagram. The first three lines are related to the technologies used during the simulation (Tech1, Tech2 and Tech3). As shown in the figure, each technology is considered to have a fixed fre-quency for the data generation. The aim is to overlap the data obtained (Received Data) and determine the mini-mum simulation frequency that the platform can support () without any data loss. The value is calculated analyz-ing the received data and findanalyz-ing the minimum common multiple of the frequencies of the used technologies. This value is the maximum simulation step to avoid the data loss mentioned and test different estimator working frequen-cies. The result of the calculation generates the Simulation Step frequency line. Any sub-multiple frequency of () can be a simulation step valid to avoid data loss during simulation.
As the left side of Fig.4shows, the kinematic data of the train generated during submultiple ofcan be used with-out any data loss if the ATLAS position estimator works in a frequency multiple of the ATLAS simulation time step.
In the right side of the Fig.4, the result of having a wrong () value is presented, where the dotted line represents the loss of data.
It is necessary to foresee different estimator working frequencies to fulfill position data retrieving time require-ments. This option avoids realizing other simulation and reduces the time cost.
6 Advanced train location simulator core
The ATLAS Core is in charge of processing all the nec-essary configured data, simulating the train movement in the track, generating the necessary inputs for the algo-rithms, calculating the positioning estimates and analyzing its performance. The ATLAS Core has a differentiated and updateable module for each of the functional blocks that were identified in Section 2, which will be described next.
6.1 ATLAS route simulator
6.2 ATLAS input generator
The ATLAS Input Generator uses the data from the Route Simulator and generates the input sources with configured errors for the algorithms to be tested in the Position Esti-mator. This module first calculates the real ranging values for each defined parameter and then introduces a pseudo-random error to emulate a real situation. The error is intro-duced according to the performance zones already defined in Section5.3.
6.3 ATLAS position estimator
The Position Estimator is the module responsible for test-ing different location algorithms. It may receive the rangtest-ing estimates from either GNSS, BTSs from Wireless Commu-nication Technologies (WCT), or other sensors (e.g., IMU, balises, etc.) for positioning, that were generated previously by the Input Generator.
The ATLAS Position Estimator can integrate multi-sensor and multi-temporal data using Bayesian inference. Both particle and Kalman filters are proposed in the liter-ature as solutions to the problem of estimating a position using the measurement(s) received [7,10,22,38]. The mod-ularity of the ATLAS platform allows evaluating different positioning strategies and algorithms, selecting the most adequate configuration.
6.4 ATLAS performance analyzer
This last module allows the user to compare and contrast the behavior of each positioning configuration carried out, and thus to select the most favorable or convenient.
The position distance error, defined as the Euclidean dis-tance between the real position calculated in Section 6.1
and the estimated one at each time instant along the tra-jectory, is statistically analyzed. The most common met-rics for positioning error analysis, such as the RMSE and Cumulative Distribution Function (CDF) are selected. RMSE is a measure of the square root of the devia-tion of the estimated posidevia-tion about the true posidevia-tion, so it combines both the variance and the bias. CDF is the probability of having a distance error in positioning lower than a certain value. With this metrics, each configura-tion of the ATLAS platform can be compared under the same conditions and the most suitable one can be chosen (see Section7.2.4).
To calculate the performance metrics of a given loca-tion system in a new track or train, Monte Carlo methods (or Monte Carlo experiments) can be performed. These are a broad class of computational algorithms that rely on repeated random sampling to obtain numerical results; typ-ically one runs simulations/measures many times over in
order to obtain the distribution of an unknown probabilistic entity [33,43,45].
Furthermore, cost analysis is performed because of the need to reach a trade-off between accuracy and the location system implementation cost for the railway sector.
From the description of the ATLAS platform, it can be clearly seen that it fulfills the objectives presented in the Section2for a simulation platform for railway location sys-tems. ATLAS platform provides numerous possibilities to test different on-board location systems from several points of view, as it can handle changes on every module showed in Fig.3.
Its configurability is present for example in changes in the track layout or infrastructure, modification of antenna distributions, etc. The modularity and extensibility of the platform allows the addition of new technologies, different data fusion approaches, etc. The number of possibilities that the platform presents is not fixed and allows mitigating the different error influences in the on-board location systems. The other feature the platform presents is the reusability. The platform is capable of taking advantage of the gener-ated intermediate data to permit the use of this information by posterior modules, without the need of repeating the full simulation and thus, reducing the total simulation time between changes.
7 ATLAS case study: EATS
ATLAS platform is under continuous development to create new modules and adapt the platform to the latest tech-nologies and positioning systems. The aim of the platform is to cover the lack of simulation platforms for on-board positioning systems, development of new data fusion strate-gies and test algorithms allowing faster improvements in this area. Moreover, it has been conceived to overcome the technical challenges that were identified in Section 2. Nowadays, the platform is operative to test certain location systems.
ATLAS has been tested under ETCS Advanced Test-ing and Smart Train PositionTest-ing System (EATS) project [12]. EATS proposes a leap in the train positioning system by means of the Smart Train Positioning System (STPS). Therefore, EATS research will be specifically focused on increasing the availability of the positioning system.
Figure 5 illustrates the location strategy employed by STPS. EATS proposes the introduction of new positioning techniques joined to the use of different positioning tech-nologies (e.g., GNSS) to increase the availability of the signal and the reduction of the positioning error.
Fig. 5 EATS STPS location estimation strategy. [2]
to this, positioning algorithms and different technologies used for positioning can be tested to allow the compar-ison of their performance and suitability for the railway sector.
In the EATS project to compute the position of a train, two main data fusion strategies are considered and one is applied for the preliminary case studies. Both approaches are discussed in the first subsection.
At present, simulations realized in EATS projects thanks to the platform allowed to verify the feasibility of includ-ing WCT such as UMTS and GSM-R for positioninclud-ing as shown in the Section 7.2, presenting some preliminary results.
7.1 Data Fusion Strategies
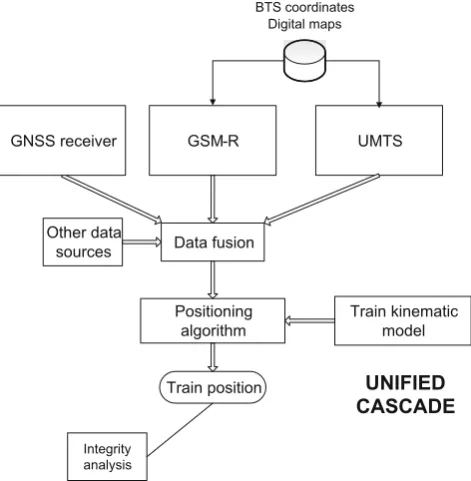
There are two main approaches in the literature when using data fusion strategies [7,22,38]. The first strategy consid-ered is the unified cascade shown in Fig. 6. This option fuses all the available raw data and produces a final position-ing estimate [7]. This option is fast but quite complex since combining data at different rates and from diverse sources requires more complex computation. However, the benefit is that no information is lost, and low probability errors in location is obtained.
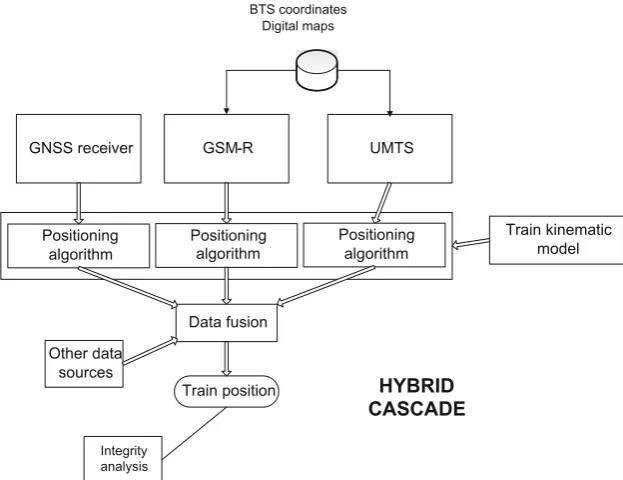
The hybrid cascade strategy shown in Fig.7calculates partial positions with the data from each considered tech-nology. Afterwards, a data fusion algorithm processes this
information to produce the final estimate. With this strat-egy a final estimate is obtained when each of the positioning modules produces a partial position. An advanced inte-gration of this option is to position only with GNSS and switch to another technology when this one is unavailable or
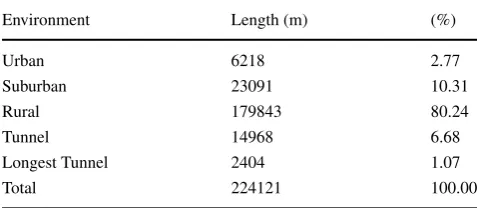
Table 1 Track specification Madrid - Calatayud (Spain)
Environment Length (m) (%)
Urban 6218 2.77
Suburban 23091 10.31
Rural 179843 80.24
Tunnel 14968 6.68
Longest Tunnel 2404 1.07
Total 224121 100.00
deteriorated [10,22]. This data fusion is more time consum-ing and needs extra hardware for calculation of the partial positions. Thus, it is more costly.
For the preliminary use case the unified cascade approach is implemented for GSM-R and UMTS technologies. This data fusion strategy is the one used by EATS to obtain the individual positioning of a coach.
7.2 Preliminary case studies and results
ATLAS platform has been successfully implemented within the EATS project to verify the feasibility of using WCT in railway environments. The four modules introduced in Section 6 have been developed to test the GSM-R and UMTS technologies for the unified cascade data fusion strategy. It is important to underline that the Route Gen-erator, Input Generator and the Performance Analyzer are independent of the selected positioning algorithm and the data fusion approach. In case another algorithm or data fusion strategy is chosen, the updates would only be done in the Position Estimator itself; Route Genera-tor and Performance Analyzer modules could be reused without any changes, and Input Generator would be mod-ified only if the Position Estimator needed different input parameters.
The main window of the Graphical User Interface (GUI) of the ATLAS platform offers an overall view of all the mod-ules. Moreover, it includes a dedicated user interface for the configuration of the different function blocks, that will be
Table 2 Track specification Noorderkenpen - Antwerpen Luchtbal (Belgium)
Environment Length (m) (%)
Urban 1250 4.46
Suburban 6197.2 22.11
Rural 15521.5 55.39
Tunnel 5056 18.04
Longest Tunnel 4409.7 15.73
Total 28024.7 100.00
Table 3 Train technical data
Characteristic Value Units
Max. Speed 350 km/h
Train Length 200 m
Number of cars 8
Length of end car body 25.535 m
Length of intermediate car body 24.175 m
Height of cars 3.890 m
Width of cars 2.950 m
described next. Once each module is configured, it is exe-cuted and the results are stored so that they could be reused later on by different subsequent modules.
7.2.1 Route generator
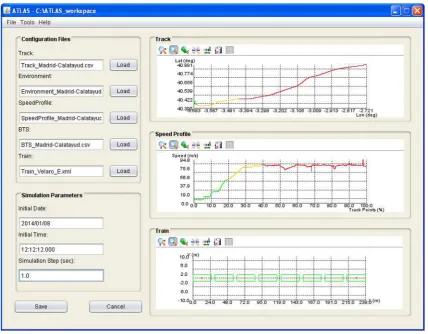
Two different scenarios have been used: Madrid-Calatayud high velocity line in Spain and Noorderkenpen - Antwerpen Luchtbal in Belgium. In Fig.8the user interface for the case study in Spain is shown. Next, the configuration information of the Route Generator for both case studies is described: – Track information: Madrid-Calatayud high Velocity
Line in Spain and Noorderkenpen - Antwerpen Lucht-bal in Belgium. The two scenarios used are detailed in Table1(Spain) and Table2(Belgium).
– Environment: For each point of the track, information related to the environment (urban, suburban, rural and tunnel) is introduced. Environment is defined based on the range of observed BTS in each point of the trajec-tory.This information is depicted together with the track by using a color code (green for urban, yellow for sub-urban, red for rural and orange for tunnel) [Fig.8]. The percentages of the environments are shown in Tables1
and2.
– Speed Profile: The speed profile has been obtained using a GPS receiver in a field-test for Spain case study and with processed odometer information for Belgium. The field test data had some blank areas due to the tun-nels, so interpolation was applied to specify the speed in the intermediate points. The environment color code is also applied to the speed profile.
Fig. 7 Data fusion strategies: Hybrid Cascade
– Train: “High Speed Trainset Velaro E” [48] train has been modeled with the characteristics show in Table3. Furthermore, one UMTS receiver and another GSM-R receiver have been placed in the center of each coach. The Route Generator, based on the information provided and the simulation parameters specified in the user inter-face, obtains the true position for every receiver in the train, with a frequency of a second, along all the trajectory. This information is saved, so that it could be used by different Input Generator modules.
7.2.2 Input generator
In the Input Generator configuration user interface, both the parameters to be generated and the errors to be introduced need to be defined.
In this case, the error values have been taken from the field test campaigns of the 3GPP, which provides a reliable manner to generate the input parameters close to the reality. Additionally, user could configure the values to adapt the generator to a previously characterized environment.
For the case studies of Spain and Belgium the following observables are going to be used: for GSM-R, the Timing Advance (TA) and the Enhanced Observed Time Difference (E-OTD); and for UMTS, the Round Trip Time (RTT) and Observed Time Difference of Arrival (OTDOA).
The observables in this section can be divided in two main groups.
On the one hand, TA and RTT observables, which are based on the time that is taken by a signal to travel from a BTS to a Mobile Station (MS), known as the Time of Arrival
(TOA). The distance traveled from the BTS to the MS can generally be expressed as in Eq.1.
di,T OA=
(x−xi)2+(y−yi)2+(z−zi)2+υi,T OA (1) Let (x,y,z) denote the position of the MS, and (xi,yi,zi) be the position of theithBTS [60].
υi,T OA∼N(0, σi,T OA) (2)
The TOA is a generic way of calling all the parameters related with the Time Of Arrival. For GSM-R, the parameter related with the TOA is known as TA (Time of Arrival). In the same way, for UMTS the parameter related with the TOA is known as RTT (Round Trip Time). The standard deviation value for each of the technologies is going to be described separately.
For the TA parameter only the measurement error is taken into account due to the fact that the synchronization errors are solved with the time slot guard period [13]. As result, in the Eq.3, error is based on the TA measurement the error and the quantization error, where(Tb)is the chip duration, for GSM-R is 48/13μs andχvaries from [0,1] depending on the MS speed [60].
σi,T A,GSMR = Tb·c 2
1 6
1+χ 4
2
+χ
4
2
(3)
A standard deviation of 50 m for the RTT observable is presented for the simulation in [14].
Fig. 8 User Interface for the configuration of Route Generator module for the case study in Spain
On the other hand, the OTDOA and the E-OTD observ-ables are based on time differences of arrival (TDOA) between the reference BTS and the neighbor BTS. The dis-tance between the reference BTS, the neighbor BTS and the MS is defined in Eq.5.
di,T DOA =
(x−xi)2+(y−yi)2+(z−zi)2
−(x−xo)2+(y−yo)2+(z−zo)2
+υi,T DOA (5)
where, the reference BTS position is defined as(xo, yo, zo), the neighbor BTS position as (xi, yi, zi) and (x, y, z) defines the MS position.
υi,T DOA∼N(0, σi,T DOA) (6)
The same way as for the TOA in the case of the TDOA the standard deviation values of each technology are going to be defined separately. A standard deviation of the noise error can be defined for the E-OTD using the Eq.7. The range error is bounded depending on: a certain frequency source stability parameter (T I ERMS), percentile associated with the maximum range error (e.g. whenT I ERMS has a Gaussian distributionCp(67 %)=1.0), reporting periodT
and speed of light in vacuumc[15].
σi,EOT D=√2·Cp·c·T ·T I ERMS≤rmax (7) In case of the OTDOA the SFN-SFN observed time, where SFN is the System Frame Numbers, is used to mea-sure the OTDOA and hence for position determination. The accuracy provided by the OTDOA is 0.5 chip error [50,61]. The chip duration T band the speed of light care used in Eq. 8 to convert the OTDOA chip accuracy value into a measurement error.
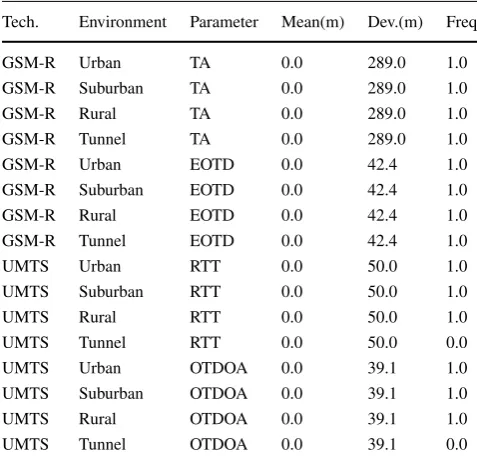
σi,OT DOA,U MT S =T b·c·chipaccuracy (8) The frequency of the generation is configured in the user interface with the values shown in the Table4.
Once all the information has been defined, the Input Generator generates estimated parameters according to the environment. These parameters for the case studies are gen-erated with a frequency of 1 Hz, in the true position points of the corresponding receivers (calculated previously by the Route Generator) at each time epoch. If the value is set to 0 Hz the Input Generator module does not generate a value for that parameter.
Table 4 Input Generator configuration
Tech. Environment Parameter Mean(m) Dev.(m) Freq
GSM-R Urban TA 0.0 289.0 1.0
GSM-R Suburban TA 0.0 289.0 1.0
GSM-R Rural TA 0.0 289.0 1.0
GSM-R Tunnel TA 0.0 289.0 1.0
GSM-R Urban EOTD 0.0 42.4 1.0
GSM-R Suburban EOTD 0.0 42.4 1.0
GSM-R Rural EOTD 0.0 42.4 1.0
GSM-R Tunnel EOTD 0.0 42.4 1.0
UMTS Urban RTT 0.0 50.0 1.0
UMTS Suburban RTT 0.0 50.0 1.0
UMTS Rural RTT 0.0 50.0 1.0
UMTS Tunnel RTT 0.0 50.0 0.0
UMTS Urban OTDOA 0.0 39.1 1.0
UMTS Suburban OTDOA 0.0 39.1 1.0
UMTS Rural OTDOA 0.0 39.1 1.0
UMTS Tunnel OTDOA 0.0 39.1 0.0
Finally, it is worthy to highlight that all the parame-ters are user-specified simulation inputs and could be easily changed for other case studies.
7.2.3 Position estimator
Kalman Filters are adaptive filters that have been widely used for many engineering applications [21,25]. Extended Kalman Filter (EKF), approximates the state distribution by a Gaussian random variable. Then, this state is propagated analytically through the first-order linearization of the non-linear system. This approximation can introduce errors that in general lead to a non-optimal performance of this filter and in some cases to diverge from the true solution. To solve these problems, there are in the literature a wide range of methods that try to minimize the error [4,39,41,44].
The Unscented Kalman Filter (UKF) tries to approximate the state distribution using a reduced set of sample points that capture the true mean and covariance of the Gaus-sian random variables. This algorithm captures the posterior mean and covariance accurately to the third order Taylor series expansion for any nonlinearity [29,56].
Nonlinearities are present on the behavior of the GSM-R and UMTS observable because of the environment influ-ences (signal shadowing, No Line of Sight (NLoS),) and propagation laws. Furthermore, as the location-based ser-vices that they offer are limited, and in the case of the GSM-R technology, it was not conceived to support this kind of services. Due to all these reasons, the use of UKF is better suited than EKF [30,35].
Three different algorithms configurations have been developed based on the UKF algorithm and configured in
ATLAS Position Estimator to be executed: UMTS position estimator using RTT and OTDOA parameters; GSM-R position estimator using TA and E-OTD parameters; and a hybrid approach using RTT, OTDOA, TA and E-OTD parameters.
The UKF includes two steps. First, the prediction step, where the state model is updated based on mathematical laws. Second, the correction step, where the states after the prediction step are modified based on the obtained measure-ments. These models and steps are going to be described next.
State model The position of a element is denoted in the fol-lowing asx(i,t ) y(i,t ) z(i,t ) , whereiindicates the number of the element andtthe time instant.
Let us define(i,t ) as the state vector of our system at time stept. It is of length 6, which will be denotedP, and contains the target element position to be estimated, as well as the first derivatives of the position:
(i,t )=x(i,t) x(i,t)˙ y(i,t) y(i,t)˙ z(i,t) z(i,t)˙ (9)
Measurement model ρ(i,t ) is the observation vector and contains the entry parameters of the Kalman filter at time stept. In our case, it contains the noise observations from theielement to theN BTS:
ρ(i,t )=ρ(i,1,t ) ρ(i,2,t ) · · ·ρ(i,N,t) (10) The observations can be a combination of RSS, AOA, TOA or TDOA measurements and are calculated using only geometric approaches by translating the observation to a distance parameter and solving linear equations. Thus, the length of this vector will be in general greater than the number of BTS.
Prediction step A discrete constant acceleration model has been used to describe the transition of(i,t )from one time step to the next one. Using this motion model, in the pre-diction state, a predicted (i,t ) for the actual time step on basis of the estimated(i,t −1)of the previous time instance can be determined. In the same way, the error covari-ance matrixP(i,t )is predicted based on previous covariance matrixP(i,t−1).
In this case both matrix(i,t )andP(i,t )are augmented, denoted by (a), with the state mean and covariance of the process noise Q and the covariance of the measurement noiseR.
(a)(i,t−1) = (i,t−1) Q(i,t ) R(i,t )
(11)
P(a)(i,t−1) =
⎡
⎣P(i,t0−1) Q(i,t )0 00
0 0 R(i,t )
⎤
A set ofLsigma points (χ(a)(l)) are derived from the aug-mented state and covariance whereLis the dimension of the state.
χ(a)(l) = (a)(i,t−1) (13)
χ(a)(l) = (a)(i,t−1)+
(L+λ)P(a)(i,t−1)
(l)
l = 1, . . . , L (14)
χ(a)(l) = (a)(i,t−1)+
(L−λ)P(a)(i,t−1)
(l)
l = L+1, . . . ,2L (15)
λ = α2(L+κ)−L (16)
For calculation of the sigma points Cholesky decom-position is used over (L+λ)P(a)(i,t−1). From the square root of the resultant diagonal matrix, defined as
(L+λ)P(a)(i,t−1)
(l)
, thelthcolumn is used to generate the sigma points (see Eq.18–20).
λis the resultant value of the variablesαandκ that con-trol the spread of the sigma points.αis usually set to a small positive value andκ to zero.β is related to the distribution of the state. For a Gaussian distribution,β=2.
The UKF generally requires a reduced number of sigma/sample points in comparison with other methods such as the Particle Filters where the number of random points used to have a reasonable performance are higher.
Then, the sigma points are propagated through the tran-sition functionf ()
χ(a)(l) = f χ(l)(a) l=0, . . . ,2L (17)
Using these sigma points, the predicted state and covari-ance matrix are calculated:
(i,t ) =
2L
l=0
W(s)(l)χ(a)(l) (18)
P(i,t ) =
2L
l=0 W(c)(l)
χ(a)(l) −(i,t ) χ(a)(l) −(i,t )
T (19)
where
W(s)(0) = λ
L+λ (20)
W(c)(0) = λ
L+λ+(1−α 2+
β) (21)
W(s)(l) = W(c)(l) = 1
2(L+λ) l=1, . . . ,2L (22) TheW(s)(l) andW(c)(l) are weight factors that are calculated for each sigma point and allows computing the predicted state and covariance matrix (see Eq.18 and Eq.19). The (s)is for the predicted state weight factors and(c)for the covariance matrix weights.
The corresponding predicted sigma pointsγ(a)(l) can be calculated via the non-linearN–dimensional distance func-tionh():
γ(a)(l) = h
χ(a)(l) l=0, . . . ,2L (23)
Then, this predicted sigma points are weighted and recombined to produce the predicted observation vector
ρ(i,t )= 2L
l=0
W(s)(l)γ(a)(l) (24)
Correction step The task of the correction state is to obtain an updated state estimate(i,t ) using the predicted state estimate(i,t ), the Kalman gain matrixK(i,t )and the observation vectorρ(i,t ):
(i,t )=(i,t ) +K(i,t )ρ(i,t )−ρ(i,t ) (25) The Kalman gain matrixK(i,t )is obtained as:
K(i,t )=Pρ(i,t)ρ(i,t)P(i,t)ρ(i,t) (26)
wherePρ(i,t)ρ(i,t) the predicted measurement covariance and
P(i,t)ρ(i,t)is the state-measurement cross-covariance matrix
Pρ(i,t)ρ(i,t) =
2L
l=0
W(c)(l)γ(a)(l) −ρ(i,t )
γ(a)(l) −ρ(i,t )
T (27)
P(i,t)ρ(i,t) =
2L
l=0
W(c)(l)χ(a)(l) −(i,t ) γ(a)(l) −ρ(i,t )
T (28)
The final step is to obtain the estimation of the error covariance,
P(i,t )=P(i,t )−K(i,t )Pρ(i,t)ρ(i,t)KT(i,t ) (29)
After the configuration, ATLAS Position Estimator exe-cutes the different algorithm configurations using the same input sets that were created by the Input Generator. The first algorithm configuration uses only GSM-R signals, the sec-ond one uses UMTS signals and the third one uses both technologies signal inputs.
The output of the three algorithm configurations gener-ated in the Position Estimator are saved to be used them later on by the Performance Analyzer.
7.2.4 Performance analyzer
The Performance Analyzer allows the end user to compare the results obtained from the Position Estimator.
Fig. 9 ATLAS Performance Analysis for WCT Madrid - Calatayud (Spain)
Distance error The distance errorderror, is defined as the difference in absolute value of the estimated position from the true position (see Eq.30):
derror =xˆ−x 2+yˆ−y 2+zˆ−z 2 (30) wherex,ˆ y,ˆ zˆare the estimated position andx, y, zthe true positions along the trajectory.
Mean distance error The mean distance error of the esti-mated positions is given by Eq.31. It represents the arith-metic mean of the distance error for every member of the population, in this case, the estimated positions:
μx= 1 NMC
NMC
n=1
ˆ
x (31)
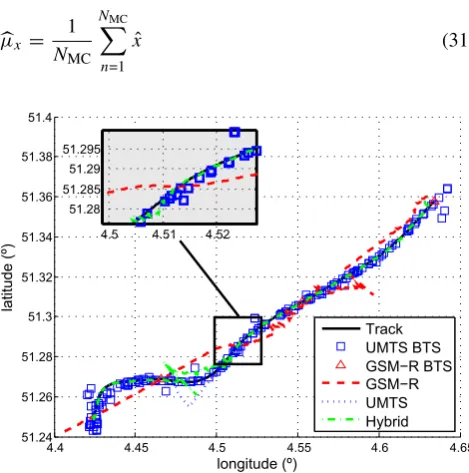
Fig. 10 ATLAS Performance Analysis for WCT Noorderkenpen -Antwerpen Luchtbal (Belgium)
Standard deviation The standard deviation of the distance error of the estimated positions is given by Eq.32:
σx =
1
NMC NMC
n=1
ˆ
x−μx (32)
whereNMCis the number of iterations.
Root Mean Square position error The root mean square
error (RMSE) accuracy is a measure of the square root of the deviation of the estimated position about the true position, so it combines both the variance and the bias. For a two dimensional space, the RMSE is given by Eq.33
RMSE=
Exˆ−x 2+yˆ−y 2 (33)
whereEis the expectation operator.
Cumulative distribution function The Cumulative Distri-bution Function (CDF) of the positioning shows the proba-bility of a having a distance error in positioning of less than a certain value (see Eq.34):
P(x)=
x
0
p (x) dx (34)
wherep(x)is the density function of the distance position error, andxthe selected value of the distance error.
The most basic performance analysis configuration per-mits the selection of the output files to be analyzed. In this case, the outputs of the two location approaches used in the receivers of the head coach are selected.
Once configured, ATLAS platform compares automati-cally the output of the algorithms with the corresponding original true position information (which was created by the Route Generator). In this example, Figs. 9 and 10
shows the results of the comparisons of the simulations, where the GSM-R and UMTS BTSs are also depicted. Figures 9 and 10 presents the true position information (Track), GSM-R position estimator output, UMTS position estimator output and the hybrid position estimator output. A zoom is also depicted in the figure area. It can be seen in the obtained results that the hybrid approach attains the best results.
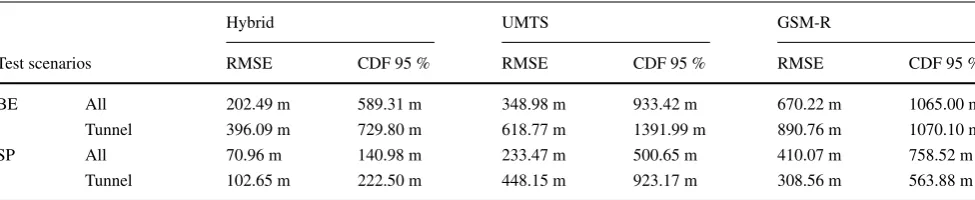
Table5compares quantitatively the performance of the three positioning methods and the two scenarios by using the RMSE (see Eq.33) and the value of the distance error in 95 % of the situations (CDF 95 %)(see Eq.34).
The ATLAS platform generates the results of all the simulation and of every particular environment.
Table 5 Performance analysis results
Hybrid UMTS GSM-R
Test scenarios RMSE CDF 95 % RMSE CDF 95 % RMSE CDF 95 %
BE All 202.49 m 589.31 m 348.98 m 933.42 m 670.22 m 1065.00 m
Tunnel 396.09 m 729.80 m 618.77 m 1391.99 m 890.76 m 1070.10 m
SP All 70.96 m 140.98 m 233.47 m 500.65 m 410.07 m 758.52 m
Tunnel 102.65 m 222.50 m 448.15 m 923.17 m 308.56 m 563.88 m
obtained for the application of the statistical met-rics to the realized iterations to obtain representative results.
As shown in both case studies, hybridization perfor-mance results are the best and provide the best alterna-tive to try to reach ETCS level 3 position and integrity requirements.
Additionally, ATLAS simulation platform can gener-ate a performance analysis of the particular characterized environments. As an example, the tunnel environment is included, where UMTS input parameters do not exist because the frequency for the its observables was set to zero in the tunnel environment. However, surprisingly UMTS alone offers even better RMSE results than GSM-R alone in the tunnel environment in the Belgium use case. In order to explain this behavior, it has to be taken into account that the UKF algorithm applied in the simulation contains a predic-tion state and can provide a posipredic-tion even if there is not any available signal and have better RMSE performance results in UMTS than in GSM-R. However, it is necessary to point out that in that the prediction steps could improve the loca-tion system under small signal lost periods, but afterwards it can not ensure the provided position integrity. This is the reason why the GSM-R in considered better in tunnels even if the performance results are worse.
From these results of the preliminary cases stud-ies, we can confirm that the hybridization of the data information sources provides a better positioning algorithm. It is important to remark that the presented approach of location system does not try be an alterna-tive for the traditional more accurate GNSS+INS approach. The aim of this location method is to be a complementary solution able to increase the availability in low coverage areas. The GNSS+INS approach presents a better perfor-mance than the WCT technological one, but in low coverage areas where GNSS signal is blocked during long peri-ods GNS+INS solution is not recommended due to the accumulative error provided by the INS. The presented complementary method tries to use the GSM-R and UMTS infrastructure to provide additional information sources in
these areas. This way the availability will be increased allowing the on-board locat ion system to provide a position along the trajectory and fulfilling the requirements to reach ETCS level 3.
8 Conclusion
ATLAS, the simulator platform described in this paper pro-vides a novel approach for evaluating the impact of the emerging new on-board location systems on railway sec-tor. The simulation platform provides a tool to analyze and compare different location systems working additionally as a benchmark due to the capability of reproducing the same simulation conditions. The modularity of the platform facil-itates the addition of more complex modules and testing of on-board hybrid location systems.
ATLAS platform provides a tool that reduces the cost of implementation of an on-board location system by decreas-ing the needed number of field testdecreas-ing. Moreover, it allows the evaluation of an existing location system into a new track, offering valuable information to the railway opera-tors.
Partial conclusions about each of the ATLAS modules can be drawn:
– Route generator: The characterization of the whole case study have a direct effect in the obtained results. Nowadays, due to the infrastructure operators confiden-tiality, the crucial point is to obtain the GSM-R BTS geo-location.
– Input Generator: The generation of realistic observables is a must. The error values used during the simulation of the case studies are taken from the 3GPP speci-fications. This way it can be ensured the validity of the obtained results. Additionally, user can character-ize the environments using particular field test values, providing flexibility to the on-board location system analysis.
cases. It should minimize the effect of the singular error points using a set of constraints to improve overall performance. Additionally, other position information sources (e.g. IMUs) can be used to improve tunnel environment performance as long as the measurement integrity can be ensured.
– Performance Analyzer: It allows the analysis of the case studies and further analysis of the singular points, as differentiated analysis based on the environment can be performed. The evaluation of the side effects of certain characterization can be detected. However, it seems rea-sonable to keep on developing more tools to facilitate the discussion of the results.
Summarizing, the next step and future work in the ATLAS platform, is first to enhance the WCT positioning estimators, such as the errors inside the tunnel providing a better characterization, and second to implement both data fusion strategies into ATLAS platform and obtain results to determine which of the approaches is more suitable to reach European Train Control System (ETCS) level 3 requirements for on-board location systems.
Open Access This article is distributed under the terms of the Cre-ative Commons Attribution License which permits any use, distribu-tion, and reproduction in any medium, provided the original author(s) and the source are credited.
References
1. 3INSAT Consortium: 3INSAT - Train Integrated Safety Satel-lite System. Available online:http://iap.esa.int/projects/transport/ 3insat
2. Arrizabalaga S, Mendizabal J, Pinte S, S´anchez J, Gonzalez J, Bauer J, Themistokleous M, Lowe D (2014) Development of an advanced testing system and smart train positioning system for ETCS applications. TRA2014
3. Baohua M, Wenzheng J, Shaokuan C, Jianfeng L (2007) A computer-aided multi-train simulator for rail traffic. In: Vehicu-lar Electronics and Safety, 2007. ICVES. IEEE Int. Conf. on, pp. 108–112
4. Bar-Shalom Y, Li XR, Kirubarajan T (2001) Estima-tion with ApplicaEstima-tions to Tracking and NavigaEstima-tion, vol 9. doi:10.1002/0471221279
5. Bing T, Hu S, Zhigeng P, Meiyu Z (2004) Multi-channel train visual simulation system based on pc cluster. In: Proceedings of the 2004 ACM SIGGRAPH Int. Conf. on Virtual Reality Contin-uum and Its Applications in Industry. ACM, New York, NY, USA, pp 448–454. doi:10.1145/1044588.1044686
6. Chen A, Chavory A, Escher AC, Macabiau C (2009) Comparisons of multipath modeling strategies for the estimation of GPS posi-tioning error. In: Antennas and Propagation, 2009. EuCAP 2009. 3rd European Conf. on, pp. 2300–2304
7. Cheng-Tse C, ans Po-Hsuan T, Kai-Ten F (2012) Hybrid unified Kalman tracking algorithms for heterogeneous wireless location systems. IEEE Trans Intell Trans Syst 61(1):702–715
8. CSIR Fourth Paradigm Institute (2012) GPS error sources. Avail-able online: http://www.cmmacs.ernet.in/cmmacs/pdf/gpserrors. pdf
9. Daramola O, Stlhane T, Moser T, Biffl S (2011) A conceptual framework for semantic case-based safety analysis. In: Emerg-ing Technologies & Factory Automation (ETFA), 2011 IEEE 16th Conf. on, pp 1–8
10. De Angelis G, Baruffa G, Cacopardi S (2013) GNSS/cellular hybrid positioning system for mobile users in urban scenarios. IEEE Trans Intell Trans Syst 14(1):313–321
11. Dedes G, Grejner-Brzezinska D, Guenther D, Heydinger G, Mouskos K, Byungkyu P, Toth C (2011) Integrated GNSS/INU, vehicle dynamics, and microscopic traffic flow simulator for auto-motive safety. In: Intelligent Transportation Systems (ITSC), 2011 14th International IEEE Conference on, pp. 840–845
12. EATS Consortium (2012) EATS - ETCS Advanced Testing and Smart Train Positioning System. Available online: http://www. eats-eu.org/
13. European Telecommunications Standards Institute (ETSI) 3GPP TR 45.050 version 12.1.0 Release 12 0, 170–224
14. European Telecommunications Standards Institute (ETSI) (2010) 3GPP TR 25.907 version 9.0.1 Release 9 1
15. (2011) 3GPP TS 45.010 version 10.1.0 Release 10. European Telecommunications Standards Institute 0, 0–033
16. European Telecommunications Standards Institute (ETSI) (2012) 3GPP TS 44.035 version 11.0.0 Release 11 - Digital cellu-lar telecommunications system (Phase 2+); Location Services (LCS);Broadcast network assistance for Enhanced Observed Time Difference (E-OTD) positioning methods and Global Positioning System (GPS). Available online:http://www.etsi.org/deliver/etsi ts/144000 144099/144035/11.00.00 60/ts 144035v110000p.pdf 17. European Telecommunications Standards Institute (ETSI) (2012)
3GPP TS 45.010 version 11.1.0 Release 11 - Digital cellular telecommunications system (Phase 2+); Radio subsystem syn-chronization. Available online:http://www.etsi.org/deliver/etsi ts/ 145000 145099/145010/11.01.00 60/ts 145010v110100p.pdf 18. European Telecommunications Standards Institute (ETSI) (2013)
3GPP TS 25.331 version 11.7.0 Release 11 - Universal Mobile Telecommunications System (UMTS); Radio Resource Control (RRC); Protocol specification. Available online: http://www. etsi.org/deliver/etsi ts/125300 125399/125331/11.07.00 60/ ts 125331v110700p.pdf
19. GRAIL-2 (2008) Consortium: GRAIL-2 project. Available online: http://grail2.ineco.es/Grail2/
20. GRAIL (2008) Consortium: GRAIL project: Final activity report. Available online:http://www.grail-project.com
21. He Z, Gao M, Wang C, Wang L, Liu Y (2013) Adaptive state of charge estimation for Li-ion batteries based on an unscented kalman filter with an enhanced battery model. Energies 6(8):4134–4151. doi:10.3390/en6084134
22. Henghui L, Sheng Z, Yuhan D, Xiaokang L (2010) A wi-Fi/GPS integrated system for urban vehicle positioning. In: Intelligent Transportation Systems (ITSC), 2010 13th Intl. IEEE Conf. on, pp. 1663–1668
23. Ho T, Mao B, Yuan Z, Liu H, Fung Y (2002) Computer simula-tion and modeling in railway applicasimula-tions. Comput Phys Commun 143(1):1–10
24. Hu G, Dong Y (2012) A novel static calibration method for antenna position error based on CDGPS. In: Automatic Con-trol and Artificial Intelligence (ACAI 2012), Intl. Conf. on, pp. 243–247
25. Hu Xs, Sun Fc, Cheng Xm (2011) Recursive calibration for a lithium iron phosphate battery for electric vehicles using extended kalman filtering. J Zhejiang Univ Sci A 12(11):818–825. doi:10.1631/jzus.A1100141
27. Jong-Gyu H, Hyung-Jeong J, Dong-Hee K (2010) Hazard analysis of train control system using HAZOP-KR methods. In: Electrical Machines and Systems (ICEMS), 2010 Intl. Conf. on, pp. 1971–1975
28. Juan Masana Robert (2003) INECO-TIFSA: Las Redes GSM-R en Espa˜na - Situacin Actual. Available online:http://es.scribd.com/ doc/47463173/INECO-TIFSA-Juan-Masana
29. Julier S, Uhlmann J (2004) Unscented Filtering and Nonlinear Estimation. Proc IEEE 92(3):401–422. doi:10.1109/JPROC.2003.823141. http://ieeexplore.ieee.org/ lpdocs/epic03/wrapper.htm?arnumber=1271397
30. Julier S, Uhlmann J, Durrant-Whyte H (1995) A new approach for filtering nonlinear systems. In: American Control Con-ference, Proceedings of the 1995, vol 3, pp 1628–1632. doi:10.1109/ACC.1995.529783
31. Jun HK, Choi SK (2006) Development of a multi-train operation simulator with interactive human computer interfaces. In: Hybrid Information Technology, 2006. ICHIT ’06. Int Conf on, vol 1, pp 237–243
32. Kastell K (2012) Novel mobility models and localization techniques to enhance location-based services in transportation systems. In: Transparent Optical Networks (ICTON), 2012 14th Intl Conf on, pp 1–5
33. Kay SM (1993) Fundamentals of Statistical Signal Processing. Estimation Theory. Prentice Hall
34. Lee SG, Han SH, Han YJ (2006) Development of train communi-cation network simulator for tilting train. In: SICE-ICASE, 2006. International Joint Conference, pp 714–717. ID: 1
35. Liu C, Shui P, Li S (2011) Unscented extended kalman fil-ter for target tracking. J Syst Eng Electron 22(2):188–192. doi:10.3969/j.issn.1004-4132.2011.02.002
36. LOCOPROL Consortium (2006) LOCOPROL: LOw COst satel-lite based train location system for signaling and train PROtection for low density railway Lines. Available online:http://www.uic. org/cdrom/2006/wcrr2006/pdf/799.pdf
37. Marais J (2005) Satellite propagation analysis in a masking envi-ronment for GNSS applications. In: Proceedings of ETC 2005, Transport policy and operations - Ectri young researchers’ seminar 38. Michel HB (2007) Multi-sensor data fusion: an introduction.
Springer, Berlin
39. Muthukrishnan K, Hazas M (2009) Position estimation from UWB pseudorange and angle-of-arrival: A compar-ison of non-linear regression and Kalman filtering. Lect Notes Comput Sci (including subseries Lect Notes Artif Intell and Lecture Notes Bioinforma) 5561 LNCS:222–239. doi:10.1007/978-3-642-01721-6 14
40. Nash A, Huerlimann D (2004) Railroad simulation using open-track. Comput Railway Six 15:45–54
41. Negenborn R (2003) Robot localization and kalman filters. Thesis number: INF/SCR-03-09
42. Oh S, Kim M, Lee K, Kim Y (2013) Train control simulator design for korean radio-based train control system. In: Electrical Machines and Systems (ICEMS), 2013 Int Conf on, pp 1334–1337 43. Papoulis A (1991) Probability, random variables, and stochastic
processes. McGraw–Hill
44. Per¨al¨a T (2010) Robust Kalman-type filtering in positioning applications. In: Kalman Filter (May), pp 271–288.http://www. intechopen.com/source/pdfs/10893/InTech-Robust\kalman\ type\filtering\in\positioning\applications.pdf
45. Rubinstein RY (1981) Simulation and the Monte Carlo method. Wiley Interscience
46. Ryland H (2005) Operations - the value of training simulators [railway signaller training]. In: Safety Assurance, 2005. The IEE Seminar on (Ref. No. 2005/11081), p. 16 pp
47. SATLOC (2012) Consortium: SATLOC. Available online:http:// satloc.uic.org/Project-summary
48. Siemens (2012) High speed trainset velaro E. Available online:http://www.siemens.com/press/pool/de/materials/industry/ imo/velaro e en.pdf
49. Sottile F, Caceres MA, Spirito MA (2011) A simulation tool for hybrid-cooperative positioning. In: Localization and GNSS (ICL-GNSS), 2011 Intl Conf on, pp 64–70
50. Tao S (2012) Mobile phone based vehicle positioning and tracking and its application in urban traffic state estimation
51. Tao S, Rodriguez S, Rusu A (2010) UMTS mobile positioning simulator for vehicle location. In: Wireless, Mobile and Mul-timedia Networks (ICWMNN 2010), IET 3rd Int Conf on, pp 344–347
52. Tseng PH, Feng KT (2009) Hybrid network/satellite-based loca-tion estimaloca-tion and tracking systems for wireless networks. IEEE Trans Veh Technol 58(9):5174–5189
53. U-blox (2007) GPS essentials of satellite naviga-tion. Available online: http://zogg-jm.ch/Dateien/ GPS Compendium(GPS-X-02007).pdf
54. UNISIG Consortium (2012) Factsheet 8: UNISIG. Available online: http://www.ertms.net/facts-and-figures/ertms-factsheets. aspx
55. UNISIG Consortium (2012) Satellite Positioning UNISIG Work-ing Group - Current activities and next steps. Available online:http://ec.europa.eu/enterprise/newsroom/cf/ getdocument. cfm?doc id=8004
56. Wan Ea, Van Der Merwe R (2000) The unscented Kalman filter for nonlinear estimation, vol v.http://ieeexplore.ieee.org/xpls/abs all.jsp?arnumber=882463
57. Yonekawa M, Tanaka T (2006) Relations between positioning result and each error factor in GPS. In: SICE-ICASE, 2006. Intl Joint Conf on, pp 1361–1365
58. Yong-Won A (2012) GPS error sources and mitigation. Avail-able online: http://www.navleader.com/GGE2012 LectureNotes/ 23.Lecture110405 GGE2012 GPS07 GPSErrorSources byAhn 2pages.pdf
59. Zekavat SA, Buehrer M (2011) Handbook of position location: theory, practice and advances. John Wiley & Sons Inc
60. Zhang M, Knedlik S, Loffeld O (2010) Performance analysis of data fusion for ground target tracking using gsm networks. In: Thesis. Available online:http://d-nb.info/1013168895/34 61. Zhao Y (2002) Standardization of mobile phone