R E S E A R C H
Open Access
Collective thinking approach for improving
leak detection systems
Samer El-Zahab
*, Ahmed Asaad, Eslam Mohammed Abdelkader and Tarek Zayed
* Correspondence: [email protected] Department of Building, Civil, and Environmental Engineering, Concordia University, 1455 De Maisonneuve Boul W, Montreal, QC H3G 1M8, Canada
Abstract
Water mains, especially old pipelines, are consistently threatened by the formation of leaks. Leaks inherit increased direct and indirect costs and impacts on various levels such as the economic field and the environmental level. Recently, financially capable municipalities are testing acoustic early detection systems that utilize wireless noise loggers. Noise loggers would be distributed throughout the water network to detect any anomalies in the network. Loggers provide early detection via recording and analyzing acoustic signals within the network. The city of Montreal adopted one of the leak detection projects in this domain and had reported that the main issue that hinders the installed system is false alarms. False alarms consume municipality resources and funds inefficiently. Therefore, this paper aims to present a novel approach to utilize more than one data analysis and classification technique to ameliorate the leak identification process. In this research, acoustic leak signals were analyzed using Fourier Transform, and the multiple frequency bandwidths were determined. Three models were developed to identify the state of the leak using Naïve Bayes (NB), Deep Learning (DL), and Decision Tree (DT) Algorithms. Each of the developed models has an accuracy ranging between 84% to 89%. An aggregator approach was developed to cultivate the collective approaches developed into one single answer. Through aggregation, the accuracy of leak detection improved from 89% at its best to 100%. The design, implementation approach and results are displayed in this paper. Using this method helps municipalities minimize and alleviate the costs of uncertain leak verifications and efficiently allocate their resources.
Keywords:Leak detection, Water main monitoring, Noise loggers, Acoustic signal analysis, Asset management, Classification techniques
Introduction
The water and wastewater infrastructures in Canada are suffering from a decline in their overall state. It is estimated that 29% of the infrastructure within the whole network of Canada is in a fair condition or even lower. Additionally, a minimum reinvestment rate of 1.7% is required for sustaining the nonlinear potable water assets, but in fact, the actual reinvestment rate is 1.1% (Canadian Society of Civil Engineers, 2016). Another example lies in the United States of America, where the national GPA of the overall infrastructure system is valued at “D+,” and the GPA of the drinking water network on its own is estimated to have a value of“D,” which stands for a poor condition (ASCE, 2013). Regarding reinvestment, in the year 2010, the required fund-ing for the water infrastructure system was 91.2 billion USD, whereas the actual
investment for that year stood at 36.4 billion USD, therefore creating a shortage in funding of 54.8 billion USD (American Society of Civil Engineers, 2011).
The water infrastructure worldwide is riddled with leaks, which contribute to a variety of losses within the water network. Losses can be in the form of direct water dissipation, production energy losses, and losses in treatment costs. We rely on early detection systems to minimize the negative impact of leaks (Colombo & Karney, 2002). Based on what preceded, a need is identified to maximize the efficiency of leak detec-tion systems to act more efficiently regarding leak repairs. Therefore, this paper aims to (1) Identify current leak detection approaches, (2) Propose a leak detection system approach, and (3) Propose an aggregation approach to improve the accuracy of available leak detection systems.
The proposed model utilized genetic algorithm (GA) as a tool to define the max-imum and minmax-imum possible improvements for the model. The genetic algorithm is an evolutionary optimization tool developed by John Holland in 1975 (Kühn et al., 2013). The algorithm is based on Darwin’s principle of the survival of the fittest and natural process of the evolution through the reproduction (Elbeltagi et al., 2005). GA is utilized to solve the problems based on the genetic processes of the biological organisms. Genetic algorithm principles are based on the natural selection and the survival of the fittest where natural population is evolved in number of generations based on two main operators which are: crossover (either single-point crossover, two-point crossover, or uniform cross-over), and mutation (Heidari and Movaghar, 2011).
Background
With the growing threat of leaks, many researchers presented various models to detect and localize leaks. Current technologies vary between from real-time static systems to mobile sensor networks. An example of static sensor networks was presented by Chraim et al. (2016), who proposed a static leak detection system for pressurized gas networks that is comprised of multiple infrared propane detection sensors placed along the network of pipelines. For each 200 m2area of the network, 20 real-time sensors are required to monitor the pipelines efficiently and accurately. The accuracy of this model is estimated at 91%, where it was validated over three days with only seven false alarms. The pinpointing accuracy of this model is estimated to be within a 5-m range.
Another static model was proposed by Romano et al. (2017), where the author pre-sented a novel data analysis approach that utilizes static barometric sensors that are placed throughout the water network. The model determines the location of a leak within a district metered area (DMA) by using the statistical process control (SPC) method. The data is collected at night to minimize errors within the network; each data point represents 1 min of readings. The model was developed using 4 months of collected data and 132 simulated leak events. The leak sizes varied between 1% to 40% of the average flow within the network. The model presented an accuracy of 86% in pressure managed areas monitored by two sensors and a 67% in pressure managed area overseen by one sensor. The model had a low accuracy in gravity controlled areas, where the maximum accuracy attainable was 66%.
insertion of the sensors to the network so that they can cover as much of the network as possible. Another mobile model was suggested by Atef et al. (2016). The model utilizes a layover approach between ground penetrating radar (GPR) and infrared thermography (IR). The author collected data over the span of 2 years and the data pool was comprised of 115 IR image frames and 23 GPR image frames. The author started initially by scanning for the locations of the pipelines using the GPR, then using the infrared, a scan for leaks over the pipelines was performed, and finally, images from both devices were laid over each other to detect the exact location of the leaks using Green’s method. The most accurate results were collected when the height of the camera was 2 m, and the speed of the scanning vehicle was 1.65 m per second. The accuracy of this model ranged from 94.4% to 97.1%.
Methods
To develop the approach, the first step was to collect multiple sets of data and perform experiments. The main topic was leak detection, and thus two platforms were selected, acoustic signals and vibration signals. Acoustic signals were provided by the city of Montreal and were analyzed using Fourier transform and frequency spectrum to create detection baselines between the leak state and the no leak state. One month of leak data was collected via acoustic noise loggers and analyzed to form the acoustic leak database. On the level of accelerometers, multiple experiments were performed to collect vibration signal data. Eight hours of signal data were collected and analyzed according to the Martini approach (Martini et al., 2015). Using the analyzed and collected vibration signal data, the vibration signal database was constructed.
Figure 1 shows that a classifier was developed for each database using three different machine learning techniques with different algorithms. The techniques are namely: 1-Decision Tree, 2- Naïve Bayes, and 3- Deep Learning. Thus, acoustic noise loggers had three models with each technique as well as accelerometers. Each model was cross-validated with the test data set to check their accuracy. If the accuracy was above 85%, then the model would be accepted and used for further development. Otherwise, the model would be reassessed and redeveloped for further improvement.
The genetic algorithm operated on two instances to develop the envelope of improve-ment. Equation 1 displays the approach for determining the maximum possible accuracy using one varying model, whereirepresents the precision of the varying model and is be-ing changed between the values of 0 and 100 with an increment of 10% in each iteration. Then the genetic algorithm is asked to modify the model such that when it is aggregated with the two available models, it gives a higher accuracy than the initial model. The algo-rithm would run until all possible iterations are performed, and the maximum possible ac-curacy–accuracyTotal–after aggregation would be determined.
For i¼0:10:100
Maximize: accuracyTotal
Subject to: accuracyVariable¼i End
ð1Þ
aims to determine the worst possible scenario when aggregation is performed. There-fore, the output would be the minimum possible accuracyTotal of the aggregated model.
For i¼0:10:100
Maximize: accuracyTotal
Subject to: accuracyVariable¼i End
ð2Þ
To assess the impact of the aggregation approach, two good models with accuracy over 85% were used against a varying model with no specific accuracy. The varying model would be varied using the genetic algorithm between a 0% accuracy and a 100% accuracy. The minimum possible improvement and the maximum possible im-provement would be recorded as well to form the envelope of the classification
aggregator and identify, therefore, the advantages and disadvantages of aggregating multiple models.
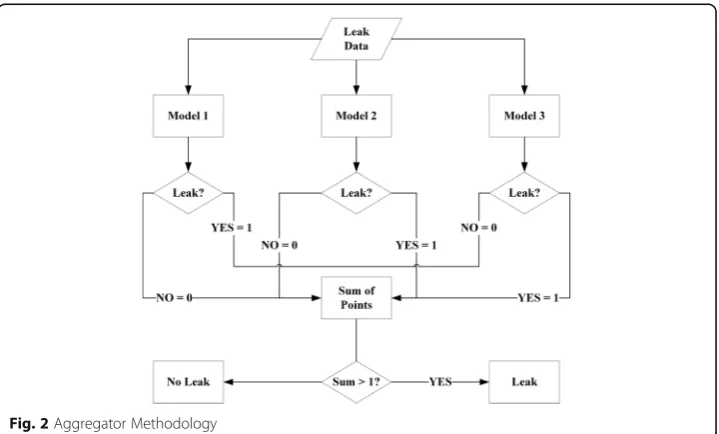
The architecture of the aggregator is simple and straightforward. The aggregator ex-pects an odd number of classifying models, ideally 3 or 5. The aggregator will then monitor each classifier and record their response to a given data set. The example shown in Fig. 2, the aggregator was identifying between leak states and non-leak states. If the classifier identified a leak, then one point would be recorded for the leak state. If the total recorded points for the leak state are two or three, then a leak is identified. On the other hand, if the sum of points was 0 or 1, the data point would be considered to represent a no leak state.
Results and discussion
The most important aspects of the leak detection approach in acoustic systems are the utilization of aggregation to minimize and even eliminate the existence of false alarms and misclassification of the data received from the sensors placed all over the down-town of the city of Montréal. Consequently, this section begins by displaying the results of aggregation and its potential impact on any binary classification problem.
The study was performed on three main levels. The first level had two accurate models with one model of varying accuracy. The second tier had one accurate model with two models of changing accuracy. Finally, the third level had three models of varying accuracies. The aim from the three stages is to explore the possible aspects of binary classification improvement through aggregation.
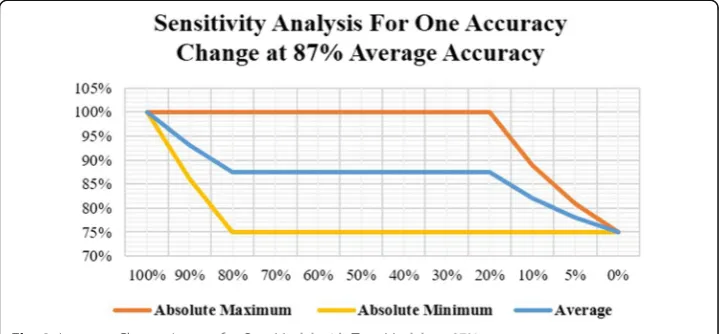
The first stage can be summarized in Figs. 3 and 4. Figure 3 shows the possible enve-lope of aggregation when aggregating two models with an average accuracy of 87%. The figure indicates that an overall accuracy of 100% is attainable with a model that is at least 20% accurate, yet this model must fit the specific missing gaps in the two other models which could be difficult to provide. Therefore, to achieve a good aggregation impact, the lowest recommended accuracy for the third model should be at least 80% beyond which the minimum possible outcome starts to decline, thus minimizing the
potential for error. The findings in Fig. 3 can be summarized by Eq. 3. The equation calculates the expected aggregated accuracy, Aagg, of two models with an average accur-acy of 87% when aggregated with a third model of accuraccur-acy Avar.
Aaggð2@87%Þ ¼0:7982þ0:1536Avar ð3Þ
Figure 4 studies the amplification impact of a varying model when aggregated with two models of average accuracy of 87%. The figure shows that a model less than 13% of accuracy will have a negative impact on the overall model, whereas having a model with over 85% accuracy will be more influential and beneficial for the overall model when aggregated.
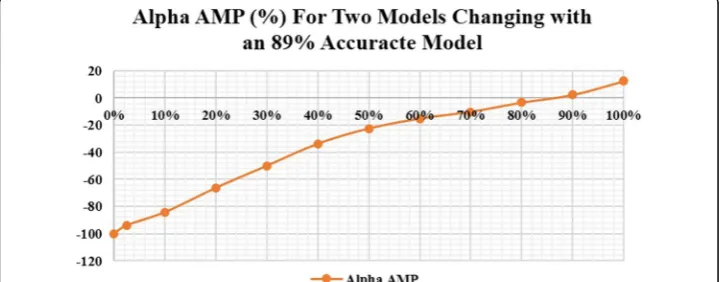
The second level includes studying the aspects and impacts of having one model with an accuracy of 89% aggregated with two stochastic models that have accuracies be-tween 0% and 100%. In Fig. 5, the envelope for aggregating one accurate model at 89% accuracy with two random models of the same accuracy is displayed. It is noticeable that the two random models have a varied potential, they can improve the model up to 100% accuracy with a 60% accuracy each, but also, they can destroy the model if they both carry a 0% accuracy for example. Therefore, it is highly recommended to utilize models with at least 60% accuracy to improve the accuracy of a model, yet the more ac-curate a model is, the more efficient the outcome of the aggregation would be.
Fig. 3Accuracy Change Impact for One Model with Two Models at 87%
Equation 4 presents a mathematical model that can predict the aggregated average of a model with 89% accuracy when aggregated with two models of accuracy Avar.
Aaggð1@89%Þ ¼0:2913þ0:9443Avar ð4Þ
Another aspect that was studied in this form of aggregation is αAMP. Figure 6 shows that the model does not benefit much from aggregation until the two models are at least 88% accurate with that the potential benefit above that value can reach 100%. It is paramount to keep in mind that since the model is 89% of the time accurate, it is chal-lenging to boost its accuracy with just any model and therefore the results of the figure present a valid point for this particular aggregation.
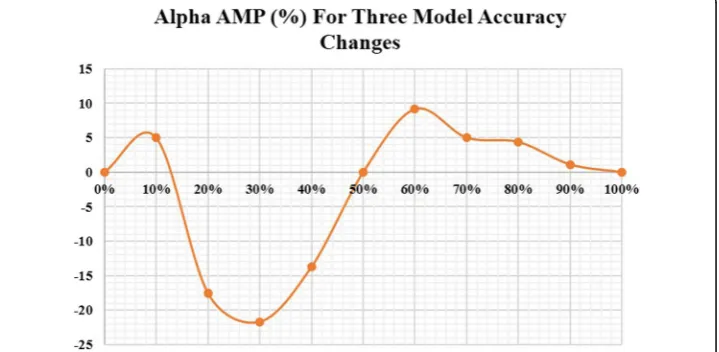
The last step in understanding the role and functioning of the aggregator approach is the utilization of three stochastic models and studying the possible interactions be-tween them. Figure 7 shows that using three random models of the same accuracy opens multiple possibilities regarding accuracy improvement. The figure also shows that 100% accurate models can be expected when using models of accuracy equal to 70% or more. The figure also shows that below 50% on average the accuracy of the model worsens when aggregated and thus it is not beneficial to conduct aggregation
Fig. 5Impact Envelope for Two Models Aggregated with an 89% Model
below a 50% accuracy. On the other hand, above a 50% accuracy, models would start to improve by aggregation, and therefore it would be a recommended approach. The rela-tionship shown in the figure can be illustrated by Equation 5 where the predicted prob-ability of an aggregated model using three random binary classification models of equal accuracies is a quadratic function of the accuracy of the models Avar.
Aaggð3 Random ModelsÞ ¼0:03066þ0:2234Avarþ0:7562A2var ð5Þ
Regarding amplification, the results of αAMP are displayed in Fig. 8. The figure con-firms the deduction found in Fig. 7, where no real benefit lies in aggregating models that are less than 50% accuracy. Additionally, it is noticeable that models of 60% accur-acy hold the highest rate of improvement with an added 9% if aggregated. On the other hand, models of accuracy 80% and above hold the highest value when improved by aggregation with the addition of an extra 5% accuracy on average and 2% for 90% accurate models.
The extent of the implementation of the aggregation model was tested in an acoustic leak detection and leak differentiation model. The model aimed to differentiate between leak states and no leak states, but more importantly to be able to identify between leak
Fig. 7Aggregation Impact Envelope of Three Changing Models
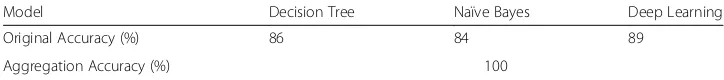
sounds and pump sounds successfully. Three binary classification models were devel-oped using three techniques Decision Tree (DT), Deep Learning (DL), and Naïve Bayes (NB). Each one of those models was presented with the same classification problem for an experimental data set of leak sounds and pump sounds. Table 1 shows the original accuracies of the models used in the development of the aggregation model. Decision Tree had an accuracy 0f 86%, Naïve Bayes had an accuracy of 84%, and finally, Deep Learning had an accuracy of 89%. After the collection of the results of each model against the testing data set, the results were aggregated to render the final decision to determine if the sound file represents a leak, a pump, or that the situation is normal within the network. The results of the aggregated values presented a 100% accuracy in detection, and all the results confirmed the inspection that was performed to identify the condition at the said loggers and their respective pipelines.
Conclusions
In this study, a novel approach was implemented to enhance the accuracy of leak detec-tion for models that utilize the data derived from acoustic signals and vibradetec-tion signals. Several experiments were performed to collect vibration signal data; these data were then analyzed using Martini approach to form the database of the classification. Sound signals were collected by the city of Montreal and were analyzed by Fourier Transform. Three classification techniques were applied to distinguish the leak from the non-leak state. Decision Tree, Naïve Bayes, and Deep Learning techniques which have accuracies of 86%, 84%, and 89% respectively were aggregated using the collective thinking ap-proach. The accuracy of the new augmented approach in detecting the leak versus the non-leak state has increased to 100% when testing the model on a random sample of real data points in the city of Montreal.
Additionally, an envelope of possible improvements was presented to explore the potential of the approach on all ends. The model presents a novel solution for leak detection companies where it can help them use the same data with multiple tech-niques to maximize the accuracy and efficiency of their available systems. This model can also help municipalities with leak detection sensors to make the most out of their installed systems.
Abbreviations
DL:Deep Learning; DMA: District Metered Area; DT: Decision Tree; GA: Genetic Algorithm; GPR: Ground Penetrating Radar; IR: Infrared; MINLP: Mixed Integer Nonlinear Programming; NB: Naïve Bayes; SPC: Statistical Process Control
Acknowledgements
The authors would like to acknowledge the support provided by the city of Montreal-Water services division for pro-viding experimental data and supporting the authors in conducting experiments and real-life validations.
Availability of data and materials
The data used in this research cannot be made publicly available now as it is the property of the city of Montreal and therefore the authors of this article have no rights to distribute the data until the project is finalized and permission is granted.
Table 1Aggregation Results of Leak Identification Model
Model Decision Tree Naïve Bayes Deep Learning
Original Accuracy (%) 86 84 89
Funding Not applicable.
Authors’contributions
Samer designed the experiments, collected the data, analyzed the data, developed the analysis software code, developed the aggregator code, conducted the envelope testing, and participated in the writing of the paper. Ahmed developed the models, analyzed the data, and assisted with the experiments. Eslam developed the models, analyzed the data, and participated in the writing of the paper. Tarek is the supervisor of the team, he gave directions on how to pursue the work, revised produced works, and provided corrections and improvements to the work. All the authors read and approved the final manuscript.
Competing interests
The authors declare that they have no competing interests.
Publisher’s Note
Springer Nature remains neutral with regard to jurisdictional claims in published maps and institutional affiliations.
Received: 2 October 2017 Accepted: 26 November 2017
References
American Society of Civil Engineers (2011) Failure to act: the economic impact of current investment trends in electricity infrastructure. American Society of Civil Engineers, Washington Retrieved from http://www.asce.org/ failuretoact/
ASCE (2013) Report card for America’s infrastructure. Am Soc Civil Eng https://doi.org/doi:10.1061/9780784478837 Atef A, Zayed T, Hawari A, Khader M, Moselhi O (2016) A multi-tier method using infrared photography and GPR to
detect and locate water leaks. Autom Constr 61:162–170
Canadian Society of Civil Engineers (2016) Canadian infrastructure report card: informing the future. Retrieved from Canada infrastructure.ca, Toronto
Chraim F, Erol YB, Pister K (2016) Wireless gas leak detection and localization. IEEE Transactions on Industrial Informatics 12(2):768–779
Colombo AF, Karney BW (2002) Energy and costs of leaky pipes: toward comprehensive picture. J Water Resour Plan Manag 128(6):441–450 http://ascelibrary.org/doi/abs/10.1061/(ASCE)0733-9496(2002)128:6(441)
Elbeltagi E, Hegazy T, Grierson D (2005) Comparison among five evolutionary-based optimization algorithms. Adv Eng Inform 19:43–53. Retrieved from. doi:10.1016/j.aei.2005.01.004
Gong W, Suresh MA, Smith L, Ostfeld A, Stoleru R, Rasekh A, Banks MK (2016) Mobile sensor networks for optimal leak and backflow detection and localization in municipal water networks. Environ Model Softw 80:306–321 Heidari E, Movaghar A (2011) An efficient method based on genetic algorithm to solve sensor network
optimization problem. International journal on applications of graph theory in wireless ad hoc networks and sensor networks 3:18–33
Kühn M, Severin T, Salzwedel H (2013) Variable mutation rate at genetic Algorithms : introduction of chromosome fitness in connection with multi-chromosome representation. Int J Comput Appl 72:31–38
Martini A, Troncossi M, Rivola A (2015) Automatic leak detection in buried plastic pipes of water supply networks by means of vibration measurements. Shock Vib 2015:1–13 Retrieved from https://doi.org/10.1155/2015/165304 Romano M, Woodward K, Kapelan Z (2017) Statistical process control based system for approximate location of pipe