K o h t a M i y a m o t o 9 S u s u m u Nakahara 9 S h i g e h i k o Suzuki
Effect of particle shape on linear expansion of particleboard
Received: July 25, 2000 / Accepted: June 15, 2001
Abstract Hinoki (Japanese cypress) strand with 0.6mm thickness was hammer-milled to prepare three types of par- ticles that had the same thickness but different lengths and widths, Screen analysis and image analysis were conducted to evaluate the shape and distribution of the particle dimen- sions. Laboratory-scale particleboards were fabricated at three density levels using these particles. To determine the true effect of particle shape on the linear expansion (LE) of the board, these boards exhibited almost the same tempera- ture behavior during pressing, the same density profile, and the same bending properties at each board density level. LE at 40~ and 90% relative humidity of the board was found to be affected by the particle shape. The board composed of small particles showed a larger LE at the same density level. It was considered that the out-of-plane orientation angle of the particles affected the LE of the boards. Thickness swell- ing and internal bond strength were also affected by the particle shape.
K e y w o r d s Linear expansion 9 Particleboard 9 Particle shape 9 Out-of-plane orientation of particle
Introduction
Linear expansion (LE) is one of the most important proper- ties of mat-formed panel products used as structural mate- rial. LE is known to be affected by various manufacturing parameters and the ambient moisture condition. The litera- ture on LE of wood-based panels can be classified into several groups1: the effect of board density, 2'3 resin con- tent, 4-5 species of raw material, 6'-I orientation of elements, 8'9
K. Miyamoto. S. Nakahara 9 S. Suzuki ( ~ )
Faculty of Agriculture, Shizuoka University, Shizuoka 422-8529, Japan
Tel. +81-54-238-4854; Fax +81-54-237-3028 e-mail: [email protected]
Part of this report was presented at the 50th annual meeting of the Japan Wood Research Society, Kyoto, April 2000
press conditions, l~ and chemical modification, i2'~3 A m o n g these manufacturing parameters, we reviewed the research on the effect of the geometry of furnish on the LE of the board.
Suchsland TM investigated the LE of commercial boards, but the dimensions of the element were not closely evaluated. Post ~s and Lehmann 16 reported that the LE of flakeboard decreased with increasing flake length. Work by Suda et al. 17 showed that the LE of particleboard increased with decreasing particle length and with increasing particle thickness. Shuler and Kelly ~8 reported that no significant difference in LE of flakeboard was found between flake lengths of i and 3 inches. Sekino et al. 1~ suggested that LE was related to the modulus of elasticity (MOE) of the board. Although some research has measured and discussed the effect of geometry on LE as noted above, the primary objec- tives of these studies were the effect of manufacturing parameters on the mechanical properties of the boards or on the dimensional stability in the thickness direction. There was a possibility that the boards had different structures, such as vertical density profiles, when the experimental boards were fabricated because the elements had widely different shapes and sizes. Because the behavior of LE was affected by many factors that related to each other, evaluat- ing the effect of the geometry on LE was sometimes difficult. In this study, we tried to prepare laboratory-scale boards with comparable structures and bending properties at the same density level so effects other than particle geometry could be eliminated when evaluating LE behavior. The objective of this study was to evaluate the effect of the shape of particles on LE of laboratory-made particleboards that had comparable bending properties and vertical den- sity profiles.
Materials and methods
i86
into the mat. One was placed at the middle of the central layer of the m a t and the other at the middle of the top surface of the mat.
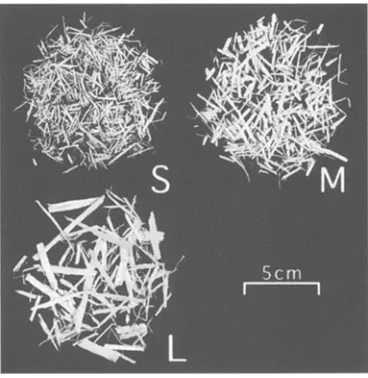
Fig. 1. Three types of particles prepared by hammer-milling hinoki strands. S, +6.5 mesh; M, -6.5 + t0.0 mesh; L, -10 mesh
0.38g/cm 3) strands of 0.6mm thickness. Three types of fur- nish were obtained by screening with removing dust: S, +6.5; M, - 6 . 5 + 10; L, - 1 0 mesh. Figure 1 shows the particles used for this research. A mixture of S, M, and L was also p r e p a r e d (F). Screen analysis was conducted on each particle type using five different sieves.
To measure the actual length and width of particles, an image analysis was conducted using particles deposited on the face of the scanner. The images of the particles were transferred to the c o m p u t e r and were binarized using a commercial application for image analysis (N1H Image, free software). Dimensions of each particle in the image were determined by approximating the shape of the particle to an ellipse. The major and minor axes of the ellipse were regarded as the actual length and width of the particle.
Board fabrication
The particles were dried to about 2.3% moisture content before the glue spreading. H o m o g e n e o u s boards were manufactured from four particle types at three board den- sity levels: 0.48, 0.60, and 0.72g/cm 3. Four replicate boards were made at each condition. Specifications of the board manufacturing were as follows.
Board size: 340mm long • wide • 10mm thick
Resin type: commercial liquid phenol-formaldehyde resin Resin content: 9% (solid basis)
Wax: not applied Press temperature: 180~ Press pressure: 3.0MPa Total press time: 7.5 min
Distance bars were used to control the final thickness of the board. The mat moisture content before pressing was about 13.5%. After pressing, the boards were conditioned at 25~ and 65% relative humidity (RH).
To measure the temperature change with time inside the mat during hot pressing, two thermocouples were inserted
LE measurement
Specimens of 50 • 300mm were conditioned for pretreat- ment in an air-circulation chamber at 60~ for 24h to reach a constant weight. The moisture content was approximately 2.0% after the drying treatment. The specimens were ex- posed at 40~ and 90% R H until practical equilibrium was reached. Three specimens were used for each condition. After reaching saturation in weight, specimens were succes- sively dried at 60~ in the air-circulation dryer to reach equilibrium. In this study, the practical equilibrium was defined as the state of time change in weight, neither gain- ing nor losing moisture of m o r e than 0.1wt% in a 24-h period. The length of the specimens was m e a s u r e d at certain intervals using the e q u i p m e n t specified in the A S T M standard. 2~ LE was calculated on the basis of the initial measurements dried at 60~ before the exposure.
Mechanical properties and TS measurement
The M O E and modulus of rupture (MOR) in bending and the internal bond strength (IB) were obtained according to the JIS standard. 2~ Five samples for the bending test and ten samples for the IB test were prepared.
A vacuum-pressure soak plus oven-drying (VPSD) was conducted to determine the thickness swelling (TS) of the boards. The VPSD treatment consisted of the vacuum for 30min, pressure soak for l h , and oven-drying at 60~ for 22 h. This treatment was repeated 10 times successively. Ten 50 • 50ram specimens were prepared for each condition. TS was measured after the 10-cycle treatment.
Density profile
Two 50 • 5 0 m m specimens were p r e p a r e d for each level. The vertical density profile of the board was mea- sured using a commercial density profiler with g a m m a ray densitometry.
Results and discussion
Particle shape
Table l. Screen analysis for four particle types Particle Weight ratio (%)
type
+5 ~ +10 +20 +30 +40 -40
S 0 14.2 67.7 11.2 5.5 1.4
M 1.8 92.1 5.8 0.2 0 0
L 64.2 33.9 1.8 0.1 0 0
F 11.2 55.7 26.5 4.3 1.8 0.6
S, +6.5 mesh; M, -6.5 + 10,0 mesh; L, -10 mesh; F, mixture of S, M, and L
+. on the sieve -, passes the sieve
0.05 0.15
0.10
2j;:
Particle type - - - - O S - - - - O M
L
... t7
v
0 20 40 60
Particle length (nun)
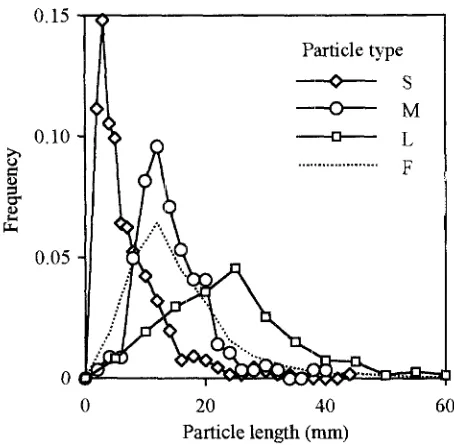
Fig. 2. Distribution of particle length as determined by the image analysis. F, mixture of S, M, and L mesh
An image analysis procedure was introduced to deter- mine the actual dimensions of the particles. The distribu- tions for four types of furnish are shown in Fig. 2. It was found that the peak and the shape of the distribution are quite different for these particles. The peaks were found at 3.0, 12, and 25 mm for S, M, and L, respectively. The peak of F was equal to that of M. The range of the distribution increased with increasing particle size.
The means and standard deviations of the length and width of the particles are listed in Table 2 for each particle type, as are the mat heights. The mat height, which provides information on particle characteristics, increased with in- creasing particle size. The mean values for length were 5.8, 13.3, and 21.4mm for S, M, and L, respectively. The mixed particle type (F) had a value similar to that of M, but the standard deviation of F was larger. The thickness of these particles was considered to be a constant of 0.6mm because they were prepared from strands with uniform thickness. Figure 2 also gives information on the distribution of the slenderness ratio, as the thickness was constant. Whereas the length strongly depended on the particle type, the dif- ferences in width were rather small. There were about 400 measurements, while was a large enough sample to obtain
Table 2. Length and width of particles as determined by image analysis Particle t y p e Length (mm) Width (mm) Mat height ~ (mm)
S 5.8 _+ 5.1 1.29 _+ 0.74 94
M 13.3 + 5.9 2.05 _+ 0.71 109
L 21.4 +_ 10.9 2.13 • 1.03 149 F 13.8 • 9.2 2.16 • 1.23 126 Lengths and widths are the mean _+ SD
Height was measured using air-dried particles without gluing
150
100
O
0~
50
.~
0.48 g/cm 7
.,.." .#..au
Particle typ e
~ S
S
~ U
m m m g
0 I I I I
0 100 200 300 400
Time (s)
Fig. 3. Temperature behavior at the center of the mat with time after press closure
results with certain accuracy, it was further revealed that the image analysis used in this study was a practical method for obtaining the dimensions of particles under the assump- tion that the particles were almost of the same thickness.
Comparison of temperature behavior, density profile, and bending properties of the fabricated boards
1.0
0.8
0.6
0.4
0.2
0 0
0.72 g/cm 3 ]
t6~q~I Q ~
"4*
cent
ck ess
/ii
:-- 1
,I, I I I ,
2 4 6 8 i0
Distance from surface (nun)
Fig. 4. Density profile of the particleboards
Table 3. MOE and M O R in bending of particleboard
Density (g/cm 3) Particle type MOR (MPa) MOE (GPa)
0.48 S 18.3 • 2.1 1.9 -+ 0.2 M 16.9 • 1.6 1.8 -+ 0.2 L 17.8 _+ 0.3 1.9 • 0.2 F 17.3 • 1.5 1.7 • 0.1
0.60 S 26.1 • 3.0 2.5 _+ 0.2
M 24.6 • 2.3 2.4 • 0.2
L 25.9 _+ 2.9 2.6 • 0.2
F 22.6 + 8.4 2.7 • 0.3
0.72 S 37.3 • 5.0 3.4 + 0.4
M 30.5 _+ 2.4 2.8 + 0.3
L 35.2 _+ 2.3 3.2 + 0.2
F 36.4 • 4.7 3.4 _+ 0.4
MOE, modulus of elasticity; MOR, modulus of rupture Results are the mean -+ SD
Figure 4 shows the density gradient across the board thickness. Despite the difference in particle sizes, no differ- ences in the density profiles were seen at the same density level. The M O E and M O R in b e n d i n g are s h o w n on Table 3. Except for the M board of 0.72g/cm 3, these mechanical properties were almost equal at same density level. Based on these results it was concluded that the boards fabricated in this study had almost the same tem- perature history during pressing, layer structure, and bend- ing properties.
Effect of particle shape on LE
Figure 5 shows the effect of particle shape on the LE at 40~ and 90% RH. From the results for S, M, and L type boards, it was found that the LE of particleboard decreases with increasing particle size for each density. This proved to be statistically significant. Comparing the mean values within the same density, LE at a density of 0.48, 0.60, and
0.40
0.35
0.30
0.25 []
T
00.20 i ,
S M
I
TTI
r
T,l
[]1
Density (g/cm 3) [] 0.72
0
0.60
0 0.48
! !
L F
Particle type
Fig. 5. Effect of particle shape on linear expansion (LE) of particle- board at 40~ and 90% relative humidity
0.72g/cm 3 decreased from 0.38% to 0.33%, from 0.34% to 0.31%, and from 0.32% to 0.30%, respectively. For the particles used in this study with mean lengths ranging from 5.8 to 21.4mm, as shown in Table 2, increasing the particle size from S to L reduced the LE of the board by about 10%- 15%. Results of LEs obtained by the drying operation after the hygroscopic moisturing condition also showed a similar tendency for the effect of particle size on LE. The LE per unit of moisture change (LE/MC) slightly decreased with increasing particle size for each board density. For 0.60g/cm 3 board, the values of LE/MC were 0.020, 0.018, and 0.017 (%/%) for S, M, and L boards, respectively.
Some different experimental results were reported con- cerning the effect of particle shape, and no clear conclusion has been drawn. Some research studies done on flakeboards did not agree about the effect of flake length, 24 but the length effect was shown to be less than 25 mm. Hiziroglu and Suchsland 2s reported that the effect of particle size by screen mesh on the LE of particleboard was insignificant. One of the reasons for the different views could be the difficulty evaluating LE, because LE has an extremely small dimensional change compared to TS. Many factors other than the particle shape could strongly affect the dimen- sional change of the board. The layer structure of the board or high thickness swelling can sometimes have a significant effect on LE measurements. 26
As mentioned in the above sections, the particleboards tested in this work had almost the same vertical density profile and the same history of temperature behavior during pressing for the same density boards. Thus, it was experi- mentally confirmed that the particle shape affected the LE of the board.
40
30
m 20
10
Density (g/cm 3)
[ ] 0.48
[ ] 0.60
[ ] 0.72
"T
:I:
i:i:
ii?i
." .2
i:i:
t
T
]-
iiii
T
T
iiii
S M L F
Particle type
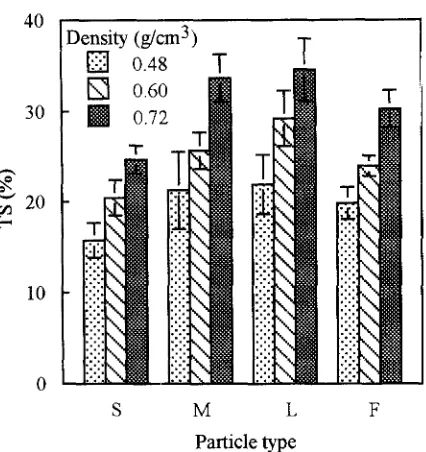
Fig. 6. Effect of particle shape on thickness swelling
(TS)
of the particleboard after vacuum-pressure soak and oven-dried exposure1
[]
!"
<>
[],t 1.
t5
u
o
[]
sb
a .
8
6
O
1"
1 )ensity (g/cm 3) O,
[] 0.72
0 0.60
O 0.48
0 ~ I ~ I
S M L F
Particle type
O
Fig. 7. Effect of particle shape on the internal bond
(IB)
strength of the particleboardparticle and its in-plane projection. Because the particles are not always deposited perfectly parallel to the plane of the board, particles inside the m a t have a certain angle to the board plane. The effect of the out-of-plane orientation of particles on the L E of p a r t i c l e b o a r d was evaluated by both theoretical and simulation analysisS The similar consideration employing the out-of-plane orientation angle can be applied to explain the results o b t a i n e d in this research. Assuming that the grain direction of wood coin- cides with the largest dimension of the particles, when the particles in the board have a larger out-of-plane orientation angle, the LE of the board is larger because the contribution of the transverse swelling c o m p o n e n t of wood increases along the plane direction. The larger the out-of-plane orien- tation angle becomes, the m o r e the LE of particleboard increases.
T h e particles M and F had almost the same m e a n length and width, as shown in Table 2, and the distribution ranges for these p a r a m e t e r s of F were larger than those of M. The distribution of the element length might affect the out-of-plane orientation angle distribution, but the difference in LE for M and F particles was not clear from this experiment. Further discussion is necessary on how the distribution of the particle size affects the b o a r d properties.
Properties in thickness direction of the boards
The TS and IB strength were m e a s u r e d to evaluate the properties in the thickness direction of the boards. Figure 6 shows the effects of particle shape on the TS of the board after VPSD treatment, The VPSD treatment consisted of 10-cycle repetitions of water soaking and drying. This treat- ment would give information on the dimensional stability in
the thickness direction that is inherent in mat-formed panel products. 2s TS after the t r e a t m e n t was affected by both density and particle type. It was found that TS increases with increasing particle size for each board density level. T h e r e is a significant difference among particle types at each density level. For 0.6g/cm 3 boards, the TS values for the board after treatment were 21%, 26%, and 30%, for S, M, and L, respectively. This result was contrary to the effect of the particle size on LE. The out-of-plane orientation angle of particles could explain this contrast. It was thought that particles with a larger out-of-plane orientation angle m a y contribute to reducing the TS of the board because of less dimensional change in the longitudinal direction of wood. A n o t h e r factors, such as bonding efficiency, entanglement, and total surface area of particles, must be considered for further discussion.
Conclusions
Using hinoki particles, particleboards were fabricated to evaluate the effect of the geometry on the LE of the boards. Particle shapes, LE, TS, and IB were determined. The results obtained can be summarized as follows.
1. The actual dimensions of the particles were measured by image analysis. The image analysis used in this study enabled us to determine the distribution of particle sizes under the assumption of constant thickness.
2. The laboratory-scale boards were made to have al- most the same t e m p e r a t u r e behavior during pressing and the same vertical density profile for evaluating the LE. It was revealed that the LE increased with decreasing particle size under the moisturing condition at 40~ and 90% RH. Properties in the thickness direction, TS and IB, were also affected by particle size.
Acknowledgments The authors thank Dr. Sobue and Mr. Ikeda, Shizuoka University, for their suggestions and help during this study.
References
1. Suzuki S (1998) Dimensional stability of wood-based panels (in Japanese). In: Textbook of wood-based board seminar. Wood Technological Association of Japan, Tokyo, pp 34-37
2. Vital BR, LehmannWF, Boone RS (1974) How species and board densities affect properties of exotic hardwood particleboards. For Prod J 24(12):37-45
3. Hse CY (1975) Properties of flakeboards from hardwoods growing on southern pine sites. For Prod J 25(3):48-53
4. Chow P (1979) Phenol adhesive bonded medium-density fibreboard from Ouercus rubra L. bark and sawdust. Wood Fiber Sci 11:92-98
5. Wu Q (1999) In-plane dimensional stability of oriented strand panel: effect of processing variables. Wood Fiber Sci 31:28-40 6. Chow P (1976) Properties of medium-density dry-formed
fiberboard from seven hardwood residues and bark. For Prod J 26(5):48-55
7. Kamdem DP, Sean ST (1994) The durability of phenolic-bonded particleboards made of decay-resistant black locust and nondu- rable aspen. For Prod J 44(2):65-68
8. Avramidis S, Smith LA (1989) The effect of resin content and face-to-core ratio on some properties of oriented strand board. Holzforschung 43:131-133
9. Canadido SL, Saito F, Suzuki S (1988) Effect of particle shape on the orthotropic properties of oriented strand board. Mokuzai Gakkaishi 34:21-27
10. Stevens RR, Woodson GE (1977) High-frequency and hot- platen curing of medium-density fiberboards. For Prod J 27(1): 46-50
11. Suchsland O, Woodson GE, McMillin CW (1983) Effect of hardboard process variables on fiberbonding. For Prod J 33(4): 58-64
12. Fujimoto H, Anazawa T, Yamagishi K (1989) The production of dimensionally stable particleboard: chemical treatment with maleic acid and glycerol mixture. In: Proceedings of the 23rd Washington State University international particleboard/ composite materials symposium, pp 95-114
13. Nicholls DL, Blankenhorn PR, Labosky P Jr (199i) The effects of mild chemical extractants on the dimensional stability of UF and PF bonded red oak flakeboard. Wood Fiber Sci 23:143-152 14. Suchsland O (1972) Linear hygroscopic expansion of selected com-
mercial particleboards. For Prod J 22(11):28-32
15. Post PW (1961) Relationship of flake size and resin content to mechanical and dimensional properties of flake board. For Prod J 11(1):34-37
16. Lehmann WF (1974) Properties of structural particleboards. For Prod J 24(1):19-26
17. Suda H, Kawai S, Sasaki H (1987) Production technology for low- density particleboard. III. Effect of particle geometry on board properties (in Japanese). Mokuzai Gakkaishi 33:376-384
18. Shuler CE, Kelly R A (1976) Effect of flake geometry on mechani- cal properties of eastern spruce flake-type particleboard. For Prod J 26(6):24-31
19. Sekino N, Suematsu A, Fujimoto K, Kitani Y, Wang Q (2000) Effect of manufacturing parameters on the linear expansion of densified wood composite panels. I. Effect of element size and press temperature (in Japanese). Mokuzai Gakkaishi 46:334-341 20. ASTM D 1037-87 (1987) Standard methods of evaluating the
properties of wood-base fiber and particle panel materials, linear variation with change in moisture content
21. Japanese Industrial Standard (1994) JIS A 5908-1994 particleboards
22. Bolton AJ, Humphrey PE, Kavvouras PK (1989) The hot pressing of dry-formed wood-based composites. Part III. Predicted vapour pressure and temperature variation with time, compared with ex- perimental data for laboratory boards. Holzforschung 43:265-274 23. Tomimura Y, Matsuda T, Suzuki I, Nagasawa S (1985)
Strandboards and waferboards from Japanese coniferous thinnings and used structural timbers (in Japanese). Mokuzai Gakkaishi 31:1047-1052
24. Kelly MW (1977) Critical literature review of relationships be- tween processing parameters and physical properties of particle- board. General technical report FPL-10
25. Hiziroglu S, Suchsland O (1993) Linear expansion and surface stability of particleboard. For Prod J 43(4):31-34
26. Suzuki S, Miyamoto K (1998) Effect of manufacturing parameters on the linear expansion and density profile of particleboard. J Wood Sci 44:444-450
27. Xu W, Suchsland O (1998) Influence of out-of-plane orientation of particles on linear expansion of particleboard: a simulation study. For Prod J 48(6):85-87