Volume 2010, Article ID 517861,13pages doi:10.1155/2010/517861
Research Article
Real-Time Multiview Recognition of Human Gestures by
Distributed Image Processing
Toshiyuki Kirishima,
1Yoshitsugu Manabe,
1Kosuke Sato,
2and Kunihiro Chihara
11Graduate School of Information Science, Nara Institute of Science and Technology, 8916-5 Takayama-cho, Ikoma-shi,
Nara 630-0101, Japan
2Graduate School of Engineering Science, Osaka University, 1-3 Machikaneyama-cho, Toyonaka-shi, Osaka 560-8531, Japan
Correspondence should be addressed to Toshiyuki Kirishima,[email protected]
Received 18 March 2009; Accepted 3 June 2009
Academic Editor: Ling Shao
Since a gesture involves a dynamic and complex motion, multiview observation and recognition are desirable. For the better representation of gestures, one needs to know, in the first place, from which views a gesture should be observed. Furthermore, it becomes increasingly important how the recognition results are integrated when larger numbers of camera views are considered. To investigate these problems, we propose a framework under which multiview recognition is carried out, and an integration scheme by which the recognition results are integrated online and in realtime. For performance evaluation, we use the ViHASi (Virtual Human Action Silhouette) public image database as a benchmark and our Japanese sign language (JSL) image database that contains 18 kinds of hand signs. By examining the recognition rates of each gesture for each view, we found gestures that exhibit view dependency and the gestures that do not. Also, we found that the view dependency itself could vary depending on the target gesture sets. By integrating the recognition results of different views, our swarm-based integration provides more robust and better recognition performance than individual fixed-view recognition agents.
Copyright © 2010 Toshiyuki Kirishima et al. This is an open access article distributed under the Creative Commons Attribution License, which permits unrestricted use, distribution, and reproduction in any medium, provided the original work is properly cited.
1. Introduction
For the symbiosis of humans and machines, various kinds of sensing devices will be either implicitly or explicitly embedded, networked, and cooperatively function in our future living environment [1–3]. To cover wider areas of interest, multiple cameras will have to be deployed. In general, gesture recognizing systems that function in real world must operate in real-time, including the time needed for event detection, tracking, and recognition. Since the number of cameras can be very large, distributed processings of incoming images at each camera node are inevitable in order to satisfy the real-time requirement. Also, improvements in recognition performance can be expected by integrating responses from each distributed processing component. But it is usually not evident how the responses should be integrated. Furthermore, since a gesture is such a dynamic and complex motion, single-view observation does not necessary guarantee better recognition performance. One needs to know from which camera views a gesture
should be observed in order to quantitatively determine the optimal camera configuration and views.
2. Related Work
1
N
N N
Recognition agent
Q
2 Recognition
agent
Q
3 Recognition
agent
Q
Recognition agent
Q
Integration agent
Q
Shared memory A Shared memory B
Image acquisition
agent
0
S
Copy
Copy
Copy
Copy
Write
Write
Write
Write
Gesture class weight
W
Copy
Read
Read
Read Read Read
Write Camera 1
Camera 2
Camera N−1
Camera N
Evaluation score
E
1
1
Gesture class weight
W 2
Gesture class weight
W 3
Gesture class weight
W
Evaluation score
E
2 Evaluation
score
E
3 Evaluation
score
E
. . .
. .
. ...
. . .
Figure1: The proposed framework for multiview gesture recognition.
can be reliably estimated [2, 10]. On the other hand, the appearance-based approach usually focuses on more detailed understanding of human gestures. Since a gesture is a spatiotemporal event, spatial- and temporal-domain problems need to be considered at the same time. In [14], we have investigated the temporal-domain problems on gesture recognition and suggested that the recognition performance can depend on image sampling rate. Although there are some studies on view selection problems [15,16], they do not deal with human gestures, and how the recognition results should be integrated when larger numbers of camera views are available is not studied. This means that most of the multiview gesture recognition system’s actual camera configuration and views are determined empirically. There is a fundamental need to evaluate the recognition performance depending on camera views. To deal with the above-mentioned problems, we propose (1) a framework under which recognition is performed using multiple camera views (2) an integration scheme by which the recognition results are integrated on-line and in real-time. The effectiveness of our framework and an integration scheme is demonstrated by the evaluation experiments.
3. Multiview Gesture Recognition
3.1. Framework. A framework for multiview gesture
recog-nition is illustrated in Figure 1. Image acquisition agent obtains a synthesized multiview image that is captured by multiple cameras and stores each camera view image in the shared memory corresponding to each recognition agent. Each recognition agent controls its processing frame rate autonomously and resamples the image data in the shared memory at the specified frame rate. In this paper, we
assume a model in which each recognition agent performs recognition and outputs the following results for each gesture class: evaluation score matrix En and gesture class weight
matrixWn,
En=(en1,en2,en3,. . .,eni,. . .,enM), (1)
Wn=(wn1,wn2,wn3,. . .,wni,. . .,wnM). (2)
Here,M denotes the maximum number of target gestures. These results are updated in the specific data area in shared memoryBcorresponding to each recognition agent. Then, the integration agent Q0 reads out the evaluation score matrix En and the gesture class weight matrix Wn and
computes an integrated score for each gesture class as follows. For theith(i =1, 2,. . .,M) gesture, the integrated scoreSi,
which represents the swarm’s response, is computed by (3)
Si= N
n=1
eniwni. (3)
Here, N denotes the maximum number of recognition agents. Finally, the integrated score matrix S is given as following:
S=(S1,S2,. . .,Si,. . .,SM). (4)
The input image is judged to belong to the gesture class for which the integrated scoreSibecomes the maximum.
3.2. Recognition Agent. In this paper, each gesture
0 1 0 1 0 1 0 1 0 1 0 1 0 1 0 1 0 1 0 1
n Recognition
agent
Q
Dynamic regions
of interest Evaluation
scores Extraction of Gaussian
density feature (GDF)
Feature-based learning/recognition
Gesture protocol-based learning/recognition
Dependent
Independent
Dependent
Independent
Protocol map
Protocol map
Protocol map
Protocol map
Protocol map
Current similarity
Current similarity
Current similarity
Current similarity
Current similarity
Convolution Convolution Convolution Convolution Convolution
Dependent
Independent
Independent Dependent
Independent Scale
dependent/ independent feature vectors
Visual interest
point controller Frame rate detector
x (fps)
(A) (C) (B)
(A) Selection of pattern scanning interval (B) Selection of pattern matching interval (C) Selection of visual interest points
Rotation dependent/ independent feature vectors
Calculation of similarity
v (fps) Target frame rate Recognition
unit [4]
Recognition unit [32] Difference
image
Silhouette image
Edge image Input image
sequence for view n
Recognition unit [3] Recognition
unit [2] Recognition
unit [1]
. . .
. . .
. . .
en1 for gesture 1
en2 for gesture 2
en3 for gesture 3
en4 for gesture 4
enM for gestureM
Figure2: Processing flow diagram of our recognition agent.
how our method performs recognition and how to obtain the evaluation score matrixEnand the gesture class weight
matrix Wn. As shown in Figure 2, our framework takes
a multilayered hierarchical approach that consists of three stages of gestural image processing: (1) feature extraction, (2) feature-based learning/matching, and (3) gesture protocol-based learning/recognition. By applying three kinds of feature extraction filters to the input image sequence, a difference image, a silhouette image, and an edge image are generated. Using these feature images, regions of interest are dynamically set frame by frame. Regarding the binary image in each dynamic region of interest, the following feature vectors are computed based on the feature vectorsε(θ) given
by (5): (1) a feature vector that depends on both scale and rotation, (2) a feature vector that depends on scale but not on rotation, (3) a feature vector that depends on rotation but not on scale, and (4) a feature vector that does not depend on both scale and rotation.
LetPτ(r,θ) represent the given binary image in a polar
coordinate system:
sε(θ)=R
rPτ(r,θ) exp
−ar−φ2
rPτ(r,θ)
, (5)
where,θis the angle,Ris the radius of the binary image, and ris the distance from a centroid of the binary image. Andais a gradient coefficient that determines the uniqueness of the feature vector, andφis a phase term that is an offset value. In the learning phase, obtained feature vectors are stored as
a reference data set. In the matching phase, obtained feature vectors are compared with the feature vectors in the reference data set, and each recognition unit outputs similarity by (6)
Similarity=1− d
(ki)
l
Maxd(lg)
, (6)
whereg refers to an arbitrary number of reference data set, andd(ki)
l is the minimum distance between the given feature
vector and the reference data set. Max() is a function that returns the maximum value.
Then, in order to recognize human gestures with more flexibility, protocol learning is conducted. The purpose of protocol learning is to let the system focus on visual features of greater significance by using a sequence of images that is provided as belonging to the identical gesture class. In the protocol learning, larger weights are given to the visual features that are spatiotemporally consistent. Based on the sequence of similarity, likelihood functions are estimated and stored as a protocol map assuming the distribution function to be Gaussian. Based on the protocol map for recognition agentQn, each component ofWnin (2) is given by (7)
wni=LL l=1Ωnl
, (7)
whereLis the maximum number of visual interest points, andΩnlis the weight for each visual interest point of
1 C
2
C C4
3 C
Actor Top view
(a)
3 C 2
C C4
1 C ,
27 deg 27 deg
Ground Actor Horizontal view
(b)
1 C
2 C
4
C 135 cm 135 cm C3 130 cm
175 cm
Actor Top view
(c)
3 C 2
C
1 C
85 cm 80 cm
85 cm 4
C
Ground Actor Horizontal view
(d)
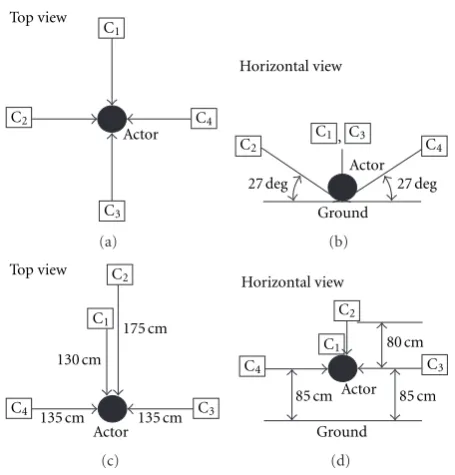
Figure3: Camera configuration.
Camera 1 (C )1
Camera 2 (C )2
Camera 3 (C )3
Camera 4 (C )4
Figure4: Camera view allocation.
ofEnin (1) is computed, which is the sum of convolution
between the similarity and each protocol map as illustrated in
Figure 2. The input image is judged to belong to the gesture
class that returns the biggest sum of convolution.
3.3. Frame Rate Control Method. Generally, the actual frame
rate of gesture recognition systems depends on (1) duration of each gesture, (2) number of gesture classes, and (3) perfor-mance of the implemented system. In addition, recognition systems must deal with slow and unstable frame rate caused by the following factors: (1) increase in pattern matching cost, (2) increased number of recognition agents, and (3) load fluctuations in the third party processes under the same operating systems environment.
In order to maintain the specified frame rate, a feedback control system is introduced as shown in the bottom part
of Figure 2, which dynamically selects the magnitude of
processing load. The control inputs are pattern scanning intervalSk, pattern matching intervalRSk, and the number
of effective visual interest pointsNvip. Here,Skrefers to the
jump interval in scanning the feature image, andRSkrefers
to the loop interval in matching the current feature vector with feature vectors in the reference data set. The controlled variable is the frame rate x (fps), and v (fps) is the target frame rate. The frame rate is stabilized by controlling the load of the recognition modules. Control inputs are determined in
31 30 29 28 27 26 25
F
rame
rat
e
(fr
ames/s)
0 50 100
Frame number
Q1 Q2
Q3 Q4
Figure5: Fluctuation of the processing frame rate.
accordance with the response from frame rate detector. The feedback control is applied as long as the control deviation does not fall within the minimal error range.
4. Experiments
The experiments are conducted on a personal computer (Core 2 Duo, 2 GHz, 2 GB Memory) under the Linux operating system environment.
4.1. Experiment I. We introduce publicly available ViHASi
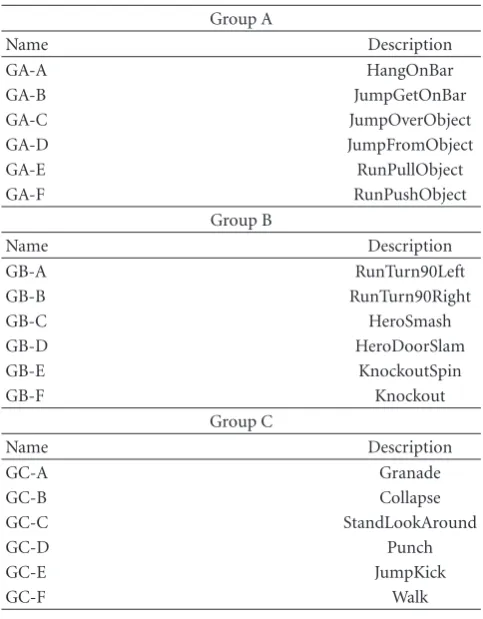
(Virtual Human Action Silhouette) [18] image database in order to evaluate the proposed approach from an objective perspective. The ViHASi image database provides binary silhouette images of virtual CG actor’s multiview motion that are captured at 30 fps in the PGM (Portable Gray Map) format. To investigate view dependency for different kinds of gestures, 18 gestures in the ViHASi image database are divided into three groups: Groups (A, B, and C) as shown
inTable 1. In this experiment, we use synthesized multiview
images observed from four different views although the number of camera views is not restricted in our approach. The camera configuration of ViHASi image database is illustrated in Figures 3(a) and 3(b). Allocation of each camera view is illustrated inFigure 4. For quick reference, trace images of each gesture are shown inFigure 22.
In this experiment, the image acquisition agent reads out the multiview image, and each view image is converted into an 8-bit gray scale image whose resolution is 80 by 60 dots and then stored in the shared memory area. Each recognition agent reads out the image and performs the recognition on-line and in real-time. The experiments are carried out according to the following procedures.
(Procedure I-1). Launch four recognition agents (Q1,Q2,Q3,
100 90 80 70 60 50 40 30 20 10 0
A
ver
age
rec
og
nition
rat
e
(%)
GA-A GA-B GA-C GA-D GA-E GA-F Name of gesture
Q0 Q1 Q2
Q3 Q4
Figure6: Group A.
100 90 80 70 60 50 40 30 20 10 0
A
ver
age
rec
og
nition
rat
e
(%)
GB-A GB-B GB-C GB-D GB-E GB-F Name of gesture
Q0 Q1 Q2
Q3 Q4
Figure7: Group B.
100 90 80 70 60 50 40 30 20 10 0
A
ver
age
rec
og
nition
rat
e
(%)
GC-A GC-B GC-C GC-D GC-E GC-F Name of gesture
Q0 Q1 Q2
Q3 Q4
Figure8: Group C.
100 90 80 70 60 50 40 30 20 10 0
A
ver
age
rec
og
nition
rat
e
(%)
GD-A GD-B GD-C GD-D GD-E GD-F Name of gesture
Q0 Q1 Q2
Q3 Q4
Figure9: Group D.
100 90 80 70 60 50 40 30 20 10 0
A
ver
age
rec
og
nition
rat
e
(%)
GE-A GE-B GE-C GE-D GE-E GE-F Name of gesture
Q0 Q1 Q2
Q3 Q4
Figure10: Group E.
100 90 80 70 60 50 40 30 20 10 0
A
ver
age
rec
og
nition
rat
e
(%)
GF-A GF-B GF-C GF-D GF-E GF-F Name of gesture
Q0 Q1 Q2
Q3 Q4
Table1: Target gesture sets (Part I).
Group A
Name Description
GA-A HangOnBar
GA-B JumpGetOnBar
GA-C JumpOverObject
GA-D JumpFromObject
GA-E RunPullObject
GA-F RunPushObject
Group B
Name Description
GB-A RunTurn90Left
GB-B RunTurn90Right
GB-C HeroSmash
GB-D HeroDoorSlam
GB-E KnockoutSpin
GB-F Knockout
Group C
Name Description
GC-A Granade
GC-B Collapse
GC-C StandLookAround
GC-D Punch
GC-E JumpKick
GC-F Walk
agentQ1also plays the role of an integration agentQ0. Since the ViHASi image database does not contain any instances for each gesture, standard samples are also used as training samples in the protocol learning.
(Procedure I-2). The target frame rate of each recognition
agent is set to 30 fps. Then, the frame rate control is started.
(Procedure I-3). Feed the testing samples into the
recogni-tion system. For each gesture, 10 standard samples are tested.
(Procedure I-4). The integrated score Si is computed by
recognition agentQ0 based on the evaluation scores in the shared memoryB.
The procedures I-3 and I-4 are repeatedly applied to six kinds of gestures in each group. Typical fluctuation curves of the processing frame rate for each recognition agent are shown inFigure 5. As shown inFigure 5, the error of each controlled frame rate mostly falls within 1 fps. The average recognition rates for the gestures in group A are shown in
Figure 6, for the gestures in group B are shown inFigure 7,
and for the gestures in group C are shown inFigure 8.
4.2. Experiment II. As an original image database, we created
a Japanese sign language (JSL) image database that contains 18 gestures in total. For each gesture class, our JSL database contains 22 similar samples, 396 samples in all. From the 22 similar samples, one standard sample and one similar sample
Table2: Target gesture sets (Part II).
Group D
Name Description
GD-A today
GD-B night
GD-C christmas
GD-D water
GD-E dog
GD-F volley ball
Group E
Name Description
GE-A golf
GE-B son
GE-C lung
GE-D gather
GE-E sing
GE-F get angry
Group F
Name Description
GF-A live
GF-B get tired
GF-C create
GF-D drink
GF-E mistake
GF-F happy
100 90 80 70 60 50 40 30 20 10 0
A
ver
age
rec
og
nition
rat
e
(%)
GG-A (GD-E)
GG-B (GE-B)
GG-C (GF-E)
GG-D (GF-D)
GG-E (GD-A)
GG-F (GF-A) Name of gesture
Q0 Q1 Q2
Q3 Q4
Figure12: Group G.
100 90 80 70 60 50 40 30 20 10 0
A
ver
age
rec
og
nition
rat
e
(%)
GH-A (GD-C)
GH-B (GE-A)
GH-C (GD-F)
GH-D (GD-D)
GH-E (GF-B)
GH-F (GE-F) Name of gesture
Q0 Q1 Q2
Q3 Q4
Figure13: Group H.
100 90 80 70 60 50 40 30 20 10 0
A
ver
age
rec
og
nition
rat
e
(%)
GI-A (GD-B)
GI-B (GE-C)
GI-C (GF-C)
GI-D (GE-D)
GI-E (GF-F)
GI-F (GE-E) Name of gesture
Q0 Q1 Q2
Q3 Q4
Figure14: Group I.
40 35 30 25 20 15 10 5 0
A
ver
aged
ev
aluation
sc
or
e
GA-A GA-B
GA-C GA-D
GA-E GA-F Gestur
e name
View 4 View 3 View 2 View 1 Camer
avi ew
Figure15: Averaged evaluation scores when the gesture GA-A is input to the system.
Table3: Target gesture sets (Part III).
Group G
Name Description
GG-A (GD-E) dog
GG-B (GE-B) son
GG-C (GF-E) mistake
GG-D (GF-D) drink
GG-E (GD-A) today
GG-F (GF-A) live
Group H
Name Description
GH-A (GD-C) christmas
GH-B (GE-A) golf
GH-C (GD-F) volley ball
GH-D (GD-D) water
GH-E (GF-B) get tired
GH-F (GE-F) get angry
Group I
Name Description
GI-A (GD-B) night
GI-B (GE-C) lung
GI-C (GF-C) create
GI-D (GE-D) gather
GI-E (GF-F) happy
GI-F (GE-E) sing
Table 4: Average recognition rates for each gesture group in Experiments I, II, and III (%).
Experiment I
Group Q0 Q1 Q2 Q3 Q4 Ave.
A 100.0 100.0 100.0 100.0 99.9 100.0
B 100.0 99.6 99.8 100.0 99.6 99.8
C 100.0 100.0 100.0 100.0 100.0 100.0 Ave. 100.0 99.9 99.9 100.0 99.8 99.9
Experiment II
Group Q0 Q1 Q2 Q3 Q4 Ave.
D 98.8 95.2 90.0 82.4 99.5 93.2
E 95.3 52.5 88.0 84.6 94.8 83.0
F 99.9 97.7 62.3 97.6 81.2 87.7
Ave. 98.0 81.8 80.1 88.2 91.8 88.0
Experiment III
Group Q0 Q1 Q2 Q3 Q4 Ave.
G 99.9 99.1 93.5 71.1 99.2 92.6
H 100.0 98.8 89.6 94.2 95.9 95.7
I 99.1 97.0 85.2 86.3 99.4 93.4
40 35 30 25 20 15 10 5 0
A
ver
aged
ev
aluation
sc
or
e
GF-A GF-B
GF-C GF-D
GF-E GF-F Gestur
e name
View 4 View 3 View 2 View 1 Camer
avi ew
Figure16: Averaged evaluation scores when the gesture GF-D is input to the system.
40 35 30 25 20 15 10 5 0
A
ver
aged
ev
aluation
sc
or
e
GE-A GE-B
GE-C GE-D
GE-E GE-F Gestur
e name
View 4 View 3 View 2 View 1 Camer
avi ew
Figure17: Averaged evaluation scores when the gesture GE-D is input to the system.
in size of 320 by 240 pixels and by 16-bit color (R:5[bit], G:6[bit], B:5[bit]). The actual frame rate is 30 fps since NTSC-compliant image capture device is used. To investigate view dependency for different kinds of gestures, 18 gestures in our database are divided into three groups: Groups (D, E, and F) as shown inTable 2. The trace images of each gesture are shown inFigure 23.
In this experiment, the image acquisition agent reads out the multiview image in the database and converts each camera view image into an 8-bit gray scale image whose resolution is 80 by 60 dots and then stores each gray scale image in the shared memory area. Each recognition agent reads out the image and performs the recognition on-line and in real-time. The experiments are carried out according to the following procedures.
(Procedure II-1). Launch four recognition agents (Q1,Q2,
Q3, andQ4), then perform the protocol learning on six kinds of gestures in each group. In this experiment, the recognition agent Q1 also plays the role of an integration agent Q0. As training samples, one standard sample and one similar sample are used for the learning of each gesture.
40 35 30 25 20 15 10 5 0
A
ver
aged
ev
aluation
sc
or
e
GF-A GF-B
GF-C GF-D
GF-E GF-F Gestur
e name
View 4 View 3 View 2 View 1 Camer
avi ew
Figure18: Averaged evaluation scores when the gesture GF-E is input to the system.
40 35 30 25 20 15 10 5 0
A
ver
aged
ev
aluation
sc
or
e
GD-E GE-B
GF-E GF-D
GD-A GF-A Gestur
e name
View 4 View 3 View 2 View 1 Camer
avi ew
Figure19: Averaged evaluation scores when the gesture GG-D(GF-D) is input to the system.
(Procedure II-2). The target frame rate of each recognition
agent is set to 30 fps. Then, the frame rate control is started.
(Procedure II-3). Feed the testing samples into the
recogni-tion system. For each gesture, 20 similar samples that are not used in the training phase are tested.
(Procedure II-4). The integrated score Si is computed by
recognition agentQ0 based on the evaluation scores in the shared memoryB.
The procedures II-3 and II-4 are repeatedly applied to six kinds of gestures in each group. The average recognition rates for the gestures in group D are shown inFigure 9, for the gestures in group E are shown inFigure 10, and for the gestures in group F are shown inFigure 11.
4.3. Experiment III. As shown inTable 3, other Groups (G,
40 35 30 25 20 15 10 5 0
A
ver
aged
ev
aluation
sc
or
e
GD-B GE-C
GF-C GE-D
GF-F GE-E Gestur
e name
View 4 View 3 View 2 View 1 Camer
avi ew
Figure20: Averaged evaluation scores when the gesture GI-D(GE-D) is input to the system.
Table5: Average recognition rates for ExperimentsII and III (%).
Exp. Q0 Q1 Q2 Q3 Q4 Ave.
II 98.0 81.8 80.1 88.2 91.8 88.0
III 99.7 98.3 89.4 83.9 98.2 93.9
Ave. 98.9 90.1 84.8 86.1 95.0 91.0
are shown inFigure 12, for the gestures in group H are shown
in Figure 13, and for the gestures in group I are shown in
Figure 14.
In the above experiments, each recognition rate is computed by dividing “the rate of correct answers” by “the rate of correct answers” plus “the rate of wrong answers.” “The rate of correct answers” refers to the ratio of the number of correct recognition to the number of processed image frames, which is calculated only for the correct gesture class. On the other hand, “the rate of wrong answers” refers to the ratio of the number of wrong recognition to the number of processed image frames, which is calculated for all gesture classes except the correct gesture class. In this way, a recognition rate is calculated that reflects the occurrence of incorrect recognition during the evaluation. The recognition rates shown in the figures and tables are the averaged values given by the above calculation about 10 testing samples of each gesture in Experiment I and 20 testing samples in Experiments II and III.
5. Discussion
5.1. Performance on ViHASi Database. As shown inTable 4,
each view’s average recognition rate for Groups (A, B, and C) exceeds 99.0 (%). And the average recognition rate’s dependency on views is very small. This suggests that the selected 18 gestures in Groups (A, B, and C) are so distinctive that any one of the views is enough for correct recognition. It should be noted here that each view’s contribution can never be evaluated without performing multiview recognition. On the other hand, the average recognition rate for the integration agent Q0 constantly reaches 100.0 (%). Above results toward the public image database demonstrate the fundamental strength of our gesture recognition method.
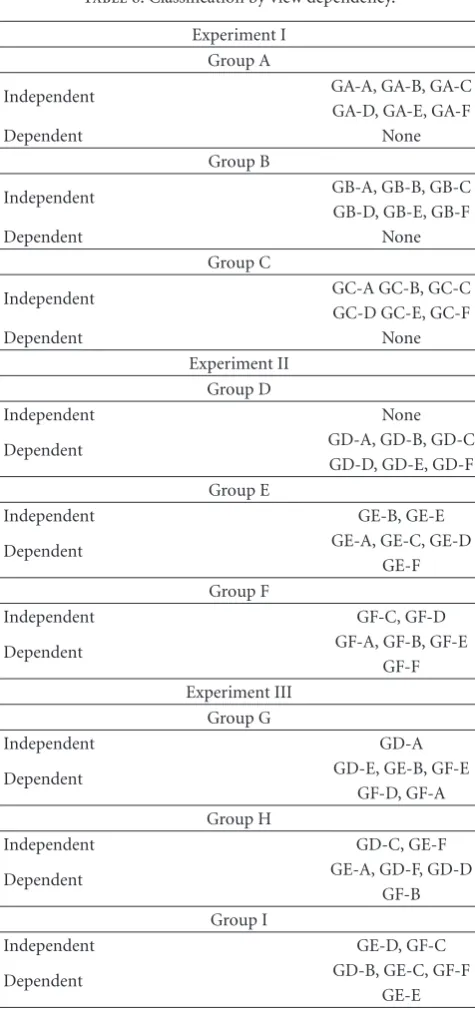
Table6: Classification by view dependency.
Experiment I Group A
Independent GA-A, GA-B, GA-C
GA-D, GA-E, GA-F
Dependent None
Group B
Independent GB-A, GB-B, GB-C
GB-D, GB-E, GB-F
Dependent None
Group C
Independent GC-A GC-B, GC-C
GC-D GC-E, GC-F
Dependent None
Experiment II Group D
Independent None
Dependent GD-A, GD-B, GD-C
GD-D, GD-E, GD-F Group E
Independent GE-B, GE-E
Dependent GE-A, GE-C, GE-D
GE-F Group F
Independent GF-C, GF-D
Dependent GF-A, GF-B, GF-E
GF-F Experiment III
Group G
Independent GD-A
Dependent GD-E, GE-B, GF-E
GF-D, GF-A Group H
Independent GD-C, GE-F
Dependent GE-A, GD-F, GD-D
GF-B Group I
Independent GE-D, GF-C
Dependent GD-B, GE-C, GF-F
GE-E
5.2. Performance on Our JSL Database. As shown inTable 4,
20 18 16 14 12 10 8 6 4 2 0
A
ver
age
o
f
av
er
aged
evaluation
sc
o
re
s
(left)
1000 900 800 700 600 500 400 300 200 100
V
ar
ianc
e
of
av
er
aged
ev
aluation
sc
or
es
(c
ent
er) 100
90 80 70 60 50 40 30 20 10
A
ver
age
rec
og
nition
rat
e
(%)
(r
ig
ht)
Experiment I Experiment II Experiment III
Group A
Group B
Group C
Group D
Group E
Group F
Group G
Group H
Group I
Figure21: Average recognition rate and average/variance of averaged evaluation scores for each group.
GA-A (76) GA-B (64) GA-C (52) GA-D (44) GA-E (20) GA-F (20)
GB-A (44) GB-B (44) GB-C (76) GB-D (32) GB-E (72) GB-F (36)
GC-A (76) GC-B (36) GC-C (80) GC-D (52) GC-E (40) GC-F (32)
Gesture set in group C (the number in parenthesis means the number of image frames) Gesture set in group B (the number in parenthesis means the number of image frames) Gesture set in group A (the number in parenthesis means the number of image frames)
Figure22: Trace images of gestures adopted in Experiment I.
for the integration agent Q0 reaches 98.0 (%) for Groups (D, E, and F) and 99.7 (%) for Groups (G, H, and I). These figures are comparable to the results for Groups (A, B, and C). Considering the greater variability in the testing samples, the integration agentQ0performs quite well for Groups (D, E, F, G, H, and I). Actually, the integration agentQ0performs best for our JSL image database as shown inTable 5. In our view, these are the indication of swarm intelligence [19– 22] since the integration agent Q0 outperforms individual recognition agent without any mechanisms for centralized
control. Regarding the performance of individual recogni-tion agent, the frontal viewQ1performs best for Groups (F and H), while the side view Q4 performs best for Groups (D, E, G, and I) as shown in Table 4. Interestingly, best recognition performance is not always achieved by frontal views, suggesting that the best view can depend on target gesture sets.
5.3. Classification by View Dependency. When the difference
GD-A (21) GD-B (26) GD-C (18) GD-D (37) GD-E (27) GD-F (23)
Gesture set in group D (the number in parenthesis means the number of image frames)
Gesture set in group E (the number in parenthesis means the number of image frames)
Gesture set in group F (the number in parenthesis means the number of image frames)
Gesture set in group G (the name in parenthesis means the original gesture name)
Gesture set in group H (the name in parenthesis means the original gesture name)
Gesture set in group I (the name in parenthesis means the original gesture name)
GE-A (23) GE-B (21) GE-C (19) GE-D (20) GE-E (36) GE-F (21)
GF-A (12) GF-B (28) GF-C (15) GF-D (22) GF-E (20) GF-F (25)
GG-A (GD-E) GG-B (GE-B) GG-C (GF-E) GG-D (GF-D) GG-E (GD-A) GG-F (GF-A)
GH-A (GD-C) GH-B (GE-A) GH-C (GD-F) GH-D (GD-D) GH-E (GF-B) GH-F (GE-F)
GI-A (GD-B) GI-B (GE-C) GI-C (GF-C) GI-D (GE-D) GI-E (GF-F) GI-F (GE-E)
rate of each gesture in Figures 6, 7, 8, 9, 10, 11, 12, 13, and14does not fall within 10 (%), let us say “the gesture exhibits view dependency.” The classification results based on this criterion for all gesture groups are summarized in
Table 6. Regarding the Groups (A, B, and C), no gesture
exhibits view dependency. On the other hand, 14 out of 18 gestures (→ 78 (%)) in Groups (D, E, and F) exhibit view dependency. And 13 out of 18 gestures (→ 72 (%)) exhibit view dependency regarding the Groups (G, H, and I). There is a striking difference between the Groups (A, B, and C) and the Groups (D, E, F, G, H, and I) with respect to view dependency. This suggests that the gestures in Groups (D, E, F, G, H, and I) are not so distinctive that all views are necessary for correct recognition. By utilizing the output of each recognition agent, the integration agent Q0exhibits better performance than individual recognition agent. Moreover, the classification results on 7 out of 18 gestures (→ 39 (%)) in the Groups (D, E, and F) have changed in the Groups (G, H, and I). This implies that view dependency can be affected by the combination of the target gestures.
5.4. Analysis on View Dependency. Figure 15 shows the typical response of the averaged evaluation scores when samples in Groups (A, B, and C) are tested.Figure 18shows the typical response of the averaged evaluation scores when samples in Groups (D, E, F, G, H, and I) are tested. Averaged evaluation scores are computed by taking an average of evaluation scores when all testing samples are sequentially tested. For the samples in Groups (A, B, and C), the distinction between the correct gesture class and the wrong gesture classes is very clear. On the other hand, for the samples in Groups (D, E, F, G, H, and I), wrong responses are rampant and they vary depending on the views. This can also be confirmed in Figures16,17,18,19, and20. Regarding the view dependency, Figures 16 and19 show the case in which the view dependency increases. And Figures17 and 20 show the case in which the view dependency decreases. Above results imply that the change in the combination of target gestures affects the distinctiveness from respective views, which can cause a change in view dependency.
5.5. Quantitative Difference between ViHASi and Our JSL Image Database. Figure 21 shows the average recognition rate and the average/variance of averaged evaluation scores for each group. Apparently, there is little correlation between the average recognition rate and the average/variance of averaged evaluation scores. But the variance of averaged evaluation scores for Experiment I is larger than that of Experiments II and III. And the average of averaged evaluation scores for Experiment I is smaller than that of Experiments II and III. Above results seem to have been brought about by the following reasons. In Experiment I, only standard samples in ViHASi image database are used for both the learning and the test. On the other hand, in Experiments II and III, only one standard sample and one similar sample in our JSL image database are used for the learning. And the similar samples that are evidently less
distinct and more ambiguous than the samples in ViHASi image database are used during the test. Nevertheless, the results of the integration agent for our JSL image database are comparable to the results for ViHASi image database, suggesting that our approach requires only a small amount of samples for learning. The greatest merit of multiview approach lies in that it can capture multiple samples from different views at the same time. This reduces the user’s burden before using the recognition system.
6. Summary
In this paper, a framework is proposed for multiview recognition of human gestures by real-time distributed image processing. In our framework, recognition agents run in parallel for different views, and the recognition results are integrated on-line and in real-time. In the experiments, the proposed approach is evaluated by using two kinds of image databases: (1) public ViHASi image database and (2) original JSL image database. By examining recognition rates of each gesture for each view, we found gestures that exhibit view dependency and the gestures that do not. And the most suitable view for recognition varied depending on the gestures in each of nine groups. More importantly, some gestures changed view dependency by changing the combination of target gestures. Therefore, the prediction of the most suitable view is difficult, especially when the target gesture sets are not determined beforehand as in the case of user-defined gestures. On the whole, the integration agent demonstrated better recognition performance than individ-ual fixed-view recognition agent. The results presented in this paper clearly indicate the effectiveness of our swarm-based approach in multiview gesture recognition. Future work includes the application of our approach to many view gesture recognition in sensor network environment.
References
[1] M. Weiser, “Hot topics-ubiquitous computing,” Computer, vol. 26, no. 10, pp. 71–72, 1993.
[2] T. Matsuyama and N. Ukita, “Real-time multitarget tracking by a cooperative distributed vision system,”Proceedings of the IEEE, vol. 90, no. 7, pp. 1136–1149, 2002.
[3] R. Liu, Y. Wang, H. Yang, and W. Pan, “An evolutionary system development approach in a pervasive computing environment,” inProceedings of International Conference on
Cyberworlds (CW ’04), pp. 194–199, November 2004.
[4] J. Yamato, J. Ohya, and K. Ishii, “Recognizing human action in time-sequential images using hidden Markov model,” in
Proceedings of IEEE Computer Society Conference on Computer
Vision and Pattern Recognition (CVPR ’92), pp. 379–385,
Champaign, Ill, USA, June 1992.
[5] C. R. Wren, A. Azarbayejani, T. Darrell, and A. P. Pentland, “Pfinder: real-time tracking of the human body,”IEEE
Trans-actions on Pattern Analysis and Machine Intelligence, vol. 19,
no. 7, pp. 780–785, 1997.
[6] A. Corradini, “Dynamic time warping for off-line recognition of a small gesture vocabulary,” inProceedings of IEEE ICCV Workshop on Recognition, Analysis, and Tracking of Faces and
[7] P. Dreuw, T. Deselaers, D. Rybach, D. Keysers, and H. Ney, “Tracking using dynamic programming for appearance-based sign language recognition,” inProceedings of the 7th Interna-tional Conference on Automatic Face and Gesture Recognition
(FGR ’06), pp. 293–298, April 2006.
[8] Z. Hang and R. Qiuqi, “Visual gesture recognition with color segmentation and support vector machines,” inProceedings of
the International Conference on Signal Processing (ICSP ’04),
vol. 2, pp. 1443–1446, Beijing, China, September 2004. [9] S.-F. Wong and R. Cipolla, “Continuous gesture recognition
using a sparse Bayesian classifier,” inProceedings of
Interna-tional Conference on Pattern Recognition, vol. 1, pp. 1084–1087,
September 2006.
[10] U. C. Jung, H. J. Seung, D. P. Xuan, and W. J. Jae, “Multiple objects tracking circuit using particle filters with multiple features,” inProceedings of International Conference on Robotics
and Automation, pp. 4639–4644, April 2007.
[11] C. Wan, B. Yuan, and Z. Miao, “Model-based markerless human body motion capture using multiple cameras,” in
Proceedings of IEEE International Conference on Multimedia
and Expo, pp. 1099–1102, July 2007.
[12] M. Ahmad and S.-W. Lee, “HMM-based human action recognition using multiview image sequences,” inProceedings
of International Conference on Pattern Recognition (ICPR ’06),
vol. 1, pp. 263–266, September 2006.
[13] A. Utsumi, H. Mori, J. Ohya, and M. Yachida, “Multiple-human tracking using multiple cameras,” in Proceedings of the 3rd IEEE International Conference on Automatic Face and
Gesture Recognition (FGR ’98), pp. 498–503, April 1998.
[14] T. Kirishima, Y. Manabe, K. Sato, and K. Chihara, “Multi-rate recognition of human gestures by concurrent frame “Multi-rate control,” inProceedings of the 23rd International Conference
Image and Vision Computing New Zealand (IVCNZ ’08), pp.
1–6, November 2008.
[15] S. Abbasi and F. Mokhtarian, “Automatic view selection in multi-view object recognition,” in Proceedings of the 15th
International Conference on Pattern Recognition (ICPR ’00), pp.
13–16, September 2000.
[16] L. E. Navarro-Serment, J. M. Dolan, and P. K. Khosla, “Opti-mal sensor placement for cooperative distributed vision,” in
Proceedings of IEEE International Conference on Robotics and
Automation (ICRA ’04), pp. 939–944, July 2004.
[17] T. Kirishima, K. Sato, and K. Chihara, “Real-time gesture recognition by learning and selective control of visual interest points,” IEEE Transactions on Pattern Analysis and Machine
Intelligence, vol. 27, no. 3, pp. 351–364, 2005.
[18] H. Ragheb, S. Velastin, P. Remagnino, and T. Ellis, “ViHASi: virtual human action silhouette data for the performance evaluation of silhouette-based action recognition methods,” in
Proceedings of the 2nd ACM/IEEE International Conference on
Distributed Smart Cameras (ICDSC ’08), pp. 1–10, Palo Alto,
Calif, USA, September 2008.
[19] M. G. Hinchey, R. Sterritt, and C. Rouff, “Swarms and swarm intelligence,”Computer, vol. 40, no. 4, pp. 111–113, 2007. [20] L. M. Fern´andez-Carrasco, H. Terashima-Mar´ın, and M.
Valenzuela-Rend ´on, “On the path towards autonomic com-puting: combining swarm intelligence and excitable media models,” in Proceedings of the 7th Mexican International
Conference on Artificial Intelligence (MICAI ’08), pp. 192–198,
October 2008.
[21] P. Saisan, S. Medasani, and Y. Owechko, “Multi-view classifier swarms for pedestrian detection and tracking,” inProceedings
of the IEEE Computer Society Conference on Computer Vision
and Pattern Recognition (CVPR ’05), p. 18, San Diego, Calif,
USA, June 2005.
[22] M. Scheutz, “Real-time hierarchical swarms for rapid adaptive multi-level pattern detection and tracking,” inProceedings of
the IEEE Swarm Intelligence Symposium (SIS ’07), pp. 234–241,