Comparison of Robust Nearest Neighbour fuzzy Rough
Classifier (RNN-FRC) with KNN and NEC Classifiers
Bichitrananda Behera1, Sudhakar Sabat2
1,2M.Tech.,Computer Science and Engineering College of Engineering and Technology, Bhubaneswar, India
Abstract
—
Fuzzy rough set, generalized from Pawlak’s rough sets, were introduced for dealing with continuous or fuzzy data. This model has been widely discussed and applied these years. It is shown that the model of fuzzy rough sets is sensitive to noisy samples, especially sensitive to mislabelled samples. As data are usually contaminated with noise in practice, a robust model is desirable. To handle noisy datasets a lot of robust fuzzy rough set models were designed before. Robust nearest neighbour fuzzy rough set model is best among the models. A classification algorithm was mentioned before based on this model known as robust nearest neighbour fuzzy rough classifier. In literature there was no detail description of the robust nearest neighbour fuzzy rough classifier was given and compared it with KNN, and NN classifiers. In this paper, we give detail description of this classifier and compare it with other classifiers like KNN classifier, NN classifier and Fuzzy rough classifier. In this paper we have done some numerical experiments to show that Robust nearest neighbour Fuzzy Rough Classifiers perform best among them.Keywords—Fuzzy rough set, robustness, KNN , NEC classifiers.
I. INTRODUCTION
This Classification is a form of data analysis that extracts models describing important data classes. Such models called classifiers, predict categorical (discrete, unordered) class labels, Classification is a twostep process. In the first step, a classification model is built based on training data. In the second step it determines the model’s accuracy based on testing data. If the model’s accuracy is acceptable, then the model is used to classify new data.
Many classification methods have been proposed by researchers in machine learning, pattern recognition, and statistics. Classification has numerous applications, including fraud detection, target marketing, performance prediction, manufacturing, and medical diagnosis.
In literature a lot of classifiers were discussed. Decision tree classifier is one of the well known classifier. Given a object X, for which the associated class label is unknown, the attribute values of the object are tested against the decision tree. A path is traced from the root to a leaf node, which holds the class prediction for the object. Bayesian classifiers are statistical classifiers. They can predict class membership probabilities such as probability that a given object belongs to a particular class. A rule based classifier uses a set of IF-THEN rules for classification.
A neural network is a set of connected input/output units in which each connection has a weight associated with it. The weights are adjusted during the learning phase to help the
network predict the correct class label of the input objects .A support vector machine is another classifier that transforms training data into a higher dimension, where it finds the hyper plane that separates the data by class using essential training objects called support vectors.
K-NN classifier, in which a new pattern is classified into the class with the most members present among the K nearest neighbours[1].K-NN classifiers require computing all the distances between the training sets and test sample, it is time-consuming if the available samples are of very great size. Besides, when the number of prototypes in the training set is not large enough, the K-NN rule is no longer optimal. This problem becomes more relevant when having few prototypes compared to the intrinsic dimensionality of the feature space. Neighbourhood rough set model (NEC) as a uniform framework to understand and implement neighbourhood classifiers[2].This algorithm integrates attribute reduction technique with classification learning. Rough set theory [3], especially fuzzy rough set theory [4], which encapsulates two kinds of uncertainty of fuzziness and roughness into a single model, has attracted much attention from the domains of granular computing, machine learning, and uncertainty reasoning over the past decade. Fuzzy rough set theory has been successfully used in gene clustering, feature selection, attribute reduction, case generation, and rule extraction. The dependence function, which is defined as the ratio of the sizes of the lower approximation of classification over the universe, plays a key role in these applications. This function underlies a number of learning algorithms, including feature selection, attribute reduction, rule extraction, and decision trees. Due to the advantages of dependence function of fuzzy rough set fuzzy rough set models was developed.
called fuzzy variable precision rough sets (FVPRS), to handle noise of misclassification and perturbation [10]. In 2010,Hu et al. introduced a new robust model of fuzzy rough sets, which are called soft fuzzy rough sets, where soft threshold was used to compute fuzzy lower and upper approximations [11].It has a lot of advantages but in real-world application, the parameters used in the models have complex interaction ways with noise. Therefore, it is usually difficult to obtain an optimal value.
In 2012,Hu et al. introduced robust nearest neighbour fuzzy rough set (RNN-FRS) model and compared RNN-FRS model with other robust models like
ߚ
-PFRS, VQRS, VPFRS, FVPRS and SFRS[12]. In that paper, robust nearest neighbour fuzzy rough classifier (RNN-FRC) was mentioned and that classifier performed best among them; But it was not given the details description of the RNN-FRC and its comparison with KNN and NN. In this paper, it is discussed and given the explanation of RNN-FRC algorithm and compared it with other classifier like KNN, NN and FR and shown that RNN-FRC is best a mong them. The remainder of this paper is organized as follows. First, we give preliminary knowledge of rough sets and fuzzy rough sets in Section II; then, we discuss the existing models of robust nearest neighbour fuzzy rough set models in Section III. Then, we introduce robust nearest neighbour fuzzy rough classifiers (RNN-FRC) in section IV. Experimental analysis is given in Section V. Finally, conclusions are drawn in Section VI.II. PRELIMINARIES OF ROUGH SET AND FUZZY ROUGH SET
A. Rough Set
The Rough set concept can be defined quite generally by means of topological operations, interior and closure, called approximations.
IS
=
U, A
is called an information table, where U is a finite and nonempty set of objects and A is a set of features used to characterize the objects.B
A
∀ ⊆
, a B-indiscernibility relation is defined asIND(B) {(x, y) U U | a B, a(x) a(y)}
=
∈ ×
∀ ∈
=
Then the partition of U generated by IND(B) is denoted by U/IND(B) (or U/B). The equivalence class of x induced by B-indiscernible relation is denoted by [x]B.
Given an arbitrary
X
⊆
U
, R is an equivalence relation on U induced by a set of attributes.• The lower approximations of X with respect to R are defined as
RX
= ∈
{x U | [x]
R⊆
X}
The lower approximation of a set X with respect to R is the set of all objects, which can be for certain classified as X with respect to R (are certainly X with respect to R)• The upper approximations of X with respect to R are defined as
RX
= ∈
{x U |[x]
R∩ ≠
X
φ
}
The upper approximation of a set X with respect to R is the set of all objects which can be possibly classified as X with respect to R (are possibly X in view of R).• R-boundary region of X is defined as
BN (X)
R=
RX RX
−
The boundary region of a set X with respect to R is the set of all objects, which can be classified neither as X nor as not-X with respect to R.
• R-negative region of X is defined as
NEG
R(X) U
= −
RX
It contains those elements which completely do not belongs to X.
The definition of rough sets is
• Set X is crisp (exact with respect to R), if the boundary region of X is empty.
• Set X is rough (inexact with respect to R), if the boundary region of X is nonempty
The lower approximation is also called R-positive region of X, denoted by
POS
R(X)
.Given a decision tableDS
=
U A D
,
∪
D is the decision attribute. ForB
A
∀ ⊆
, the positive region of decision D on B, denoted byPOS
B(D)
, is defined as
/
(D)
BX U D
POS
BX
∈
=
Where, U/D is the set of the equivalence classes generated by D. The dependency of decision D on B is defined as
(D)
B(D)
BPOS
U
γ
=
Dependency is the ratio of the samples in the lower approximation over the universe. As the lower approximation is the set of objects with consistent decisions, dependency is used to measure the classification performance of attributes. It is expected that all the decisions of objects are consistent with respect to the given attributes. In practice, inconsistency widely exists in data. B. Fuzzy Rough Set
The Rough set model is constructed under the assumption that only discrete features exist in the information system. In practice, most of classification tasks are described with numerical features or fuzzy information. In this case, neighbourhood relations or fuzzy similarity relations are used and neighbourhood or fuzzy granules are generated. Then, we use these granules to approximate decision classes.
Given a nonempty universe U, R is a fuzzy binary relation on U. If R satisfies
(1) reflexivity: R(x, x)=1 (2) symmetry: R(x, y)= R(y, x) (3)sup-min transitivity: R(x, y)
su p m in
z U{ R (x , z ), R (z , y)}
∈
Then R is a fuzzy equivalence relation. The fuzzy equivalence class [x]R associated with x and R is a fuzzy set on U, where
[x] (y) R(x, y)
R=
for all yϵ U.a fuzzy set
X
∈
X
(U)
, the lower and upper approximations are defined as( x ) m a x (1 R ( x , y ) , X ( y ) ) ( x ) m i n ( R ( x , y ) , X ( y ) )
i n f
s u p
y U y U R X R X ∈ ∈ = − = These approximation operators were discussed in the view point of the constructive and axiomatic approaches. In 1998, Morsi and Yakout replaced fuzzy equivalence relation with a T-equivalence relation and built an axiom system of the model[13], where the lower and upper approximations of X
∈X(U) are
( x ) i n f S ( N ( R ( x , y ) ) , X ( y ) )
( x )
s u p
T ( R ( x , y ) , X ( y ) )y U
T
y U
R s X
R X ∈ ∈ = =
Where, T is a triangular norm.
In 2002, based on and Radzikowska and Kerre introduced another model [14]:
( x ) ( R ( x , y ) , X ( y ) ) ( x ) s u p ( N ( R ( x , y ) ) , X ( y ) )
i n f
y U y U R X R X ϑ σ ϑ σ ∈ ∈ = =
In classification learning, samples are assigned with a class label and described with a group of features. Fuzzy equivalence relations can be generated with numerical or fuzzy features, while the decision variable divides the samples into some subsets. In this case, the task is to approximate these decision classes with the fuzzy equivalence classes induced with the features. Given a decision system <U, R, D>, for a decision class Di ∈U/D, the membership of a sample x to Di is
(x)
1
0
i ix D
D
x Di
∈
=
∉
Then the membership of sample x to the fuzzy lower approximation of
D
i is(x)
iRD
=
inf
max
y U∈
{1 R(x, y), D (y)}
−
imax{1 R(x, y),1
inf
i
y D∈
=
−
}inf
max{1 R(x, y),0}i
y D∉
∧ −
=
1
inf
{1 R(x, y)}
i
y D∉
∧
−
inf
{1 R(x, y)}
i
y D∉
=
−
If we introduce Gaussian function 2
2
(x, y) exp
2
x y
G
σ
−
=
−
to compute the similarity R, 1 −G(x, y) can be considered as a pseudo-distance function. Similarly, the membership of sample x to the fuzzy upper approximation of
D
iis(x)
sup
min{R(x, y), D (y)}
i i i y D
RD
∈=
min{R(x, y),1}
sup
iy D∈
=
∨
sup
min{R(x, y), 0}
i
y D∉
min{R(x, y)} 0
sup
i
y D∈
=
∨
sup
min{R(x, y)}
i
y D∈
=
We can see that
RD
i(x)
is the distance from x to itsnearest sample from different classes; while
RD
i(x)
is the similarity between x and the nearest sample inD
i.III.ROBUST NEAREST NEIGHBOR FUZZY ROUGH SET
MODEL
It was shown that both
R d
S i(x)
orR d
T i(x)
depends on the nearest miss of x, i.e., the nearest sample from different classes of x. As we know, the statistics of minimum and maximum are very sensitive to noisy samples. Just one noisy sample would change the minimum or maximum of a random variable. The sensitiveness of these statistics leads to the poor performance of fuzzy rough sets in dealing with noisy datasets. RNN-FRS introduced robust statistics to substitute the operators of minimum and maximum in the fuzzy rough set model. So that it can be performed better in noisy environment.A.BASIC DEFINITIONS
Given a random variable X and its n samples
x x
1, ,...,
2x
n sorted in the ascending order, the k-trimmed minimum of X isx
k+1; the k-trimmed maximum of X isx
n k− −1; k-mean minimum of X is1
/
ki i=
x k
; k-mean maximum of X is/
ni i n k= −
x k
, and k-median minimum of X ismedian(
x x
1, ,...,
2x
k ); k-mean maximum of X is median(x
n k−,...,
x
n ), denoted bymin
k trimmed−(X)
,max
k trimmed−(X)
,min
k mean−(X)
,max
k mean−(X)
,min
k median−(X)
, andmax
k median−(X)
, respectively.Given
DT
=
U A D
, ,
, R is a fuzzy similarity relation induced by B is subset C and R(x, y) monotonously decreases with their distancex y
−
. Ifd
iis one class ofsamples labelled with i and
x d
∈
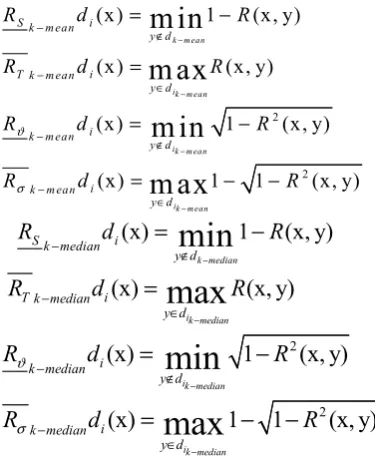
i, then the robust fuzzy rough operators are defined as2
2
(x) 1 (x, y)
(x) (x, y)
(x) 1 (x, y)
(x) 1 1 (x, y)
min
max
min
max
k trimmed ik trimmed ik trimmed ik trimmedSk trimmed i
y d Tk trimmed i
y d i k trimmed y d i k trimmed y d
R d R
R d R
R d R
R d R
2
2
(x) 1 (x, y)
(x) (x, y)
(x) 1 (x, y)
(x) 1 1 (x, y)
m in
m ax
m in
m ax
k m ean
ik mean
ik mean
ik mean
Sk m ean i
y d
Tk m ean i
y d
i k m ean
y d
i k m ean
y d
R d R
R d R
R d R
R d R
ϑ σ − − − − − ∉ − ∈ − ∉ − ∈ = − = = − = − −
(x)
min
1
(x, y)
k median
Sk median i
y d
R
d
R
−
−
=
∉−
(x)
max
(x, y)
ik median
Tk median i
y d
R
d
R
− − ∈
=
2(x)
min
1
(x, y)
ik median
i k median
y d
R
ϑd
R
−
−
=
∉−
2
(x)
max
1
1
(x, y)
ik median
i k median
y d
R
σd
R
− −
∈
=
−
−
The aforementioned models do not compute the lower and upper approximations with respect to the nearest samples as they might be outliers. These new models use k-trimmed or the mean or the median of k nearest samples to compute the membership of fuzzy approximations. This way, the variation of approximations caused by outliers is expected to be reduced; thus, the new models may be robust.
Given a binary classification task,
x d
∈
1 is a normal sample, andy
1∈
d
2 is an outlier close to x such that1
( , )
R x y
= 0.9.While as a normal sample,y
2∈
d
2 is thesecond nearest sample of x from
d
2 , andR x y
( , )
2 = 0.2. As per the classical fuzzy rough set model,1
(x) 1
( , )
1S
R d
= −
R x y
= 1 − 0.9 = 0.1.However, if weuse the 1-trimmed model,
1 2
1
(x) 1
( , )
S trimmed
R
d
R x y
−
= −
= 0.8. This way, the noisysample is ignored in the new model. At the same time, assume
x
1∈
d
1 is the second nearest sample ofy
1 , and1 1
( , )
R x y
= 0.88. According to the classical model,2
(y ) 1
1( , )
1 SR d
= −
R x y
= 1 −0.9 =0.1 and as per the1-trimmed model, 2
1
(x)
S trimmed
R
d
−
= −
1
R x y
( , )
1 1 = 0.12.It is seen that although the nearest sample x is ignored,
y
1 still obtains a small value of membership. In fact, the membership should be small enough sincey
1 is a noisy sample. This example shows that the proposed model can not only reduce the influence of noisy samples on computation of approximations of normal samples but can recognize the noisy samples and give small memberships to them as well.IV.ROBUST NEAREST NEIGHBOR FUZZY ROUGH
CLASSIFIER(RNN-FRC)
In this section, we design a robust classifier with RNN-FRS approximation. The idea of this classifier comes from nearest neighbour rule (NN). Sample x is classified to the class of the nearest neighbour of x. Here nearest neighbour is determined by k-trimmed, k-mean and k-median.
Fuzzy rough classifier (FRC) is designed as follows. Given a set of training samples with m classes, x is an unseen sample. We compute m memberships of x to fuzzy lower approximations of m classes. Finally, x is classified to the class producing the maximal membership as x belongs to this class with the greatest consistency.
Now we replace the fuzzy lower approximation with the robust fuzzy lower approximation for a robust classifier. We call it Robust Nearest Neighbour fuzzy rough classifier (RNN-FRC).It works in a similar way with FRS. We compute the memberships of an unseen sample to the soft fuzzy lower approximations of each class.
A. RNN-FRS Algorithm
Given a set of training samples
DT
=
U A D
, ,
, x is a test sample. We compute the fuzzy lower approximation of each candidate class with different fuzzy rough set models. The decision function isA.
* * *
1 2
arg max{ (x), (x),..., (x)} i
d k
class= R class R class R class
Where
R
*is a certain fuzzy lower approximation operator Formally, the classification algorithm is given in Table 1. This algorithm assigns x the class label which achieves the largest fuzzy lower approximation. Supposex class
∈
j .We compute
R class
* j(x)
. If x really belongs toclass
j , it will be far from the samples in the other classes.Table 1: RNN-FRS Classifier
Input training set
1 1 2 2
{(x , y ),(x , y ),...,(x , y )}
n nX
=
and test setX
'=
{x , x ,..., x }
1' '2 'mProcess
label
←
φ
classnum=max
(y , y ,..., y )
1 2 n -min(y , y ,..., y )
1 2 n +1 For i=1:m
degree
←
φ
For class=1:classnum
degree(class)
←
R class
*
(x )
'i end
class
*arg
max(degree)
class←
label(x )
'i←
class
* Return labelOutput label
Thus,
R class
* j(x)
should be large; otherwise,*
(x)
j
R class
is small. Therefore, the earlier algorithm is rational to classify x into the class label producing the largest fuzzy lower approximation if no class noise exists. However, if there are class-noisy samples, the previous algorithm may not work when the classical fuzzy rough set model is employed, while the robust model is still effective in this case. Some numerical experiments are described to prove effectiveness of RNN-FRC in the numerical experiments sectionB.Robustness evaluation of Different Classifiers
It is also known as comparison of classification performance. So Robustness of different classifiers are evaluated using Average classification accuracies. It is the measure used to evaluate the performance of classifiers
.
Accuracy = (correctly classified instances) / (Total no. of instances)*100%1. Accuracy = (TP+TN) / (TP+FP+TN+FN) 2. Sensitivity = (TP/TP+FN)*100%
3. Specificity = (TN/ TN+FP) * 100% Where, TP = true positive, TN = true negative FP = false positive, FN = false negative
In 10-fold cross-validation, the original sample is randomly
partitioned into 10-equal size subsamples. Of
the 10 subsamples, a single subsample is retained as the validation data for testing the model, and the remaining 9 subsamples are used as training data. The cross-validation process is then repeated 10 times (the folds), with each of the 10 subsamples used exactly once as the validation data. The 10 results from the folds can then be averaged (or otherwise combined) to produce a single estimation. The advantage of this method over repeated random sub-sampling is that all observations are used for both training and validation, and each observation is used for validation exactly once.
IV.NUMERICAL EXPERIMENTS
The simulation process is carried on a machine having Intel(R) core (TM) 2 Duo processor 2.40 GHz and 2.00 GB of RAM. The MATLAB version used is R2012(a).The simulation was carried out with 4 data sets collected from University of California, Irvine(UCI)Machine Learning Repository[15].
A. Data sets
Four datasets from University of California, Irvine (UCI) Machine Learning Repository are used. The information related to the datasets is shown in table 2.
Table 2: Summaries of data sets
B. Dataset Split
In the process of Classification, the dataset is split into ten parts. The randomly chosen 90% of objects are used as the training set and the remainder 10% as the testing set. C. Parameter Specification
We use Gaussian kernel to compute the fuzzy similarity relations between samples and the kernel parameter
σ
= 0.15, k=3.D. Simulation Result
In this section we do some numerical experiments to show robustness of the proposed classifier.
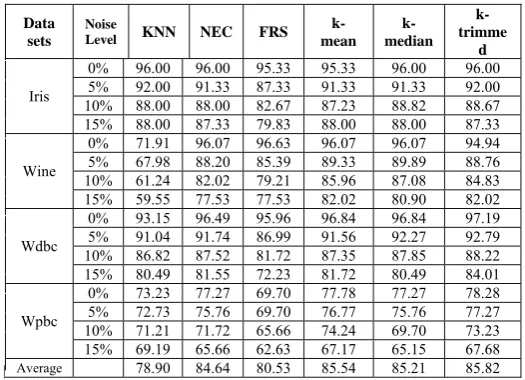
Table 3: Classification accuracy(%) on real world data set
The classification accuracy of different classifiers computed with 10 fold cross validation is shown in table 3.First raw data sets are taken and its classification accuracies is shown with zero noise level. Since we know that attribute noise has less impact on computation of classification accuracy. So, here we do not take attribute noise. We here only consider class noise for accuracy c0mputation.Here 5%,10% and then 15% class noise data sets are taken and classification accuracy are shown in the table 3.
For considering iris data set we see that all the classifiers perform well; when there is no noise and KNN classifier performs best. But in noise environment as noise increases only FRS classifier reduces rapidly others remains nearly same. So for iris data set FRS classifier performs worst and others perform better on noisy data set. It is shown in fig.1.
In fig.2, FRS classifier performs best and KNN classifier performs worst and k-mean, k-median, k-trimmed performs average when there is no noise in the wine data set. But introducing noise k-trimmed, k-mean and k-median performs best, NEC and FRS average and K-NN worst.
In wdbc data set k-trimmed performs best in both noiseless and noisy environment. The k-mean, NEC performs well after that k-median and K-NN.FRSperforms worst in noisy environment. It is shown in fig.3
.
Dataset Samples Features Classes
Iris 150 4 3
Wdbc 569 30 2
Wine 178 13 3
Wpbc 198 30 2
Data sets
Noise
Level KNN NEC FRS
k-mean
k-median
k-trimme
d
Iris
0% 96.00 96.00 95.33 95.33 96.00 96.00 5% 92.00 91.33 87.33 91.33 91.33 92.00 10% 88.00 88.00 82.67 87.23 88.82 88.67 15% 88.00 87.33 79.83 88.00 88.00 87.33
Wine
0% 71.91 96.07 96.63 96.07 96.07 94.94 5% 67.98 88.20 85.39 89.33 89.89 88.76 10% 61.24 82.02 79.21 85.96 87.08 84.83 15% 59.55 77.53 77.53 82.02 80.90 82.02
Wdbc
0% 93.15 96.49 95.96 96.84 96.84 97.19 5% 91.04 91.74 86.99 91.56 92.27 92.79 10% 86.82 87.52 81.72 87.35 87.85 88.22 15% 80.49 81.55 72.23 81.72 80.49 84.01
Wpbc
Fig.1 Variation of classification accuracy for iris data set
Fig.2 Variation of classification accuracy for wine data set
Fig.3 Variation of classification accuracy for wdbc data set
Considering fig.4, we see that k-trimmed performs best in raw data set and also in noisy data set. The mean, k-median and NEC performs average. But classification performance of KNN and FRS reduces rapidly with increase in noise.FRS performs worst.
Fig.4 Variation of classification accuracy for wpbc data set
Fig.5 Average classification accuracy of different classifier
Fig.5 shows average classification performance of RNN-FRC i.e. k-mean, k-trimmed and k-median performs best.NEC performance in between RNN-FRC and FRS. Average classification performance of KNN classifier is worst among these classifiers
.
VI. CONCLUSION AND FUTURE WORK
KNN, NEC and FRS classifiers are widely discussed and have applied in many classification applications. Similarly Robust Nearest Neighbour fuzzy rough classifiers (RNN-FRC) is recently discussed. All classifiers are good but there was no comparison was done to show among them best. In this paper we compared RNN-FRC with KNN, NEC and FRS classifiers on both raw and noisy data sets and shown than all three classifiers of RNN-FRC perform best. Out of the three classifiers of RNN-FRC, K-trimmed based RNN-FRC shows best result both in average and for individual data sets. After RNN-FRC, NEC classifier is better than FRS classifier and Finally KNN classifiers. Our future scope is to use RNN-FRC for feature selection
.
REFERENCES
[1] Duda, R., Hart, P.: Pattern Classification and Scene Analysis.Wiley,New York(1973).
[2] Qinghua Hu, Daren Yu, Zongxia Xie. Neighborhood classifiers. Expert Systems with Applications. 34 (2008) 866–876.
[3] Z. Pawlak, Rough sets, International Journal of Computer and Information Sciences 11 (1982) 341–356.
[4] D. Dubois, H. Prade, Rough fuzzy sets and fuzzy rough sets, International Journal of General Systems 17 (1990) 191–209.
[5] J. M. F. Salido and S. Murakami, “Rough set analysis of a general type of fuzzy data using transitive aggregations of fuzzy similarity relations,”Fuzzy Sets Syst., vol. 139, pp. 635–660, 2003.
[6] A. Mieszkowicz-Rolka and L. Rolka, Variable Precision Fuzzy Rough Sets. Transactions on Rough Sets I. vol. LNCS-3100, Berlin, Germany:Springer, 2004, pp. 144–160
.
[7] Q. H. Hu, Z. X. Xie, and D. R. Yu, “Hybrid attribute reduction based on a novel fuzzy-rough model and information granulation,” Pattern Recognit., vol. 40, no. 12, pp. 3509–3521, 2007.
[8] C. Cornelis, M. De Cock, and A. M. Radzikowska, “Vaguely quantified rough sets,” in Proc. 11th Int. Conf. Rough Sets, Fuzzy Sets, Data Mining,Granular Comput., 2007, pp. 87–94.
[10] S. Y. Zhao, E. C. C. Tsang, and D. G. Chen, “The model of fuzzy variable precision rough sets,” IEEE Trans. Fuzzy Syst., vol. 17, no. 2, pp. 451–467,Apr. 2009.
[11] Q. H. Hu, S. An, and D. R. Yu, “Soft fuzzy rough sets for robust feature evaluation and selection,” Inf. Sci., vol. 180, pp. 4384-4400, 2010
.
[12] Qinghua Hu, Lei Zhang, Shuang An, David Zhang, Daren Yu. On robust fuzzy rough set models. IEEE Transactions on Fuzzy Systems. 2012, 20(4): 636-651.
[13] N.N. Morsi, M.M. Yakout, Axiomatics for fuzzy rough sets, Fuzzy Sets and Systems 100 (1998) 327–342.
[14] A.M. Radzikowska, E.E. Kerre, A comparative study of fuzzy rough sets, Fuzzy Sets and Systems 126 (2002) 137–155.
[15]A. Asuncion and D. J. Newman (2007). UCI machine learning repository,School Inf. Comput. Sci., Univ. California, Irvine, [Online].Available:http://www.ics.uci.edu/mlearn/MLRepository.ht ml
AUTHORS
Bichitrananda Behera received his B.Tech in Computer Science and Engineering from Dhaneswar Rath Institute of Engineering and Management Studies, Cuttack, India in 2011 and completed M.Tech.in Computer Science and Engineering from College of Engineering and Technology, Bhubaneswar, India in 2013.His current research interest is Soft Computing, Data mining and Algorithms.
Sudhakar Sabat has obtained his B.Tech.
in Computer Science and Engineering from CV Raman College of Engineering, Bhubaneswar, India in year 2011 and received his M.Tech.in Computer Science and Engineering from College of Engineering and Technology, Bhubaneswar, india in 2013.His field of interest is Software engineering and Data mining.