Copyright 0 1995 by the Genetics Society of America
Deleterious Background Selection
With
Recombination
Richard
R.
Hudson"
and
Norman L.
&plant
*Department of Ecology and Evolutionary Biology, University of California, Irvine, California 9271 7 and 'Statistics and Biomathematics Branch, National Institute of Environmental Health Sciences, Research Triangle Park, North Carolina 27709
Manuscript received February 25, 1995
Accepted for publication August 31, 1995
ABSTRACT
An analytic expression for the expected nucleotide diversity is obtained for a neutral locus in a region with deleterious mutation and recombination. Our analytic results are used to predict levels of variation
for the entire third chromosome of Drosophila melanogaster. The predictions are consistent with the low
levels of variation that have been observed at loci near the centromeres of the third chromosome of D. melanogaster. However, the low levels of variation observed near the tips of this chromosome are not predicted using currently available estimates of the deleterious mutation rate and of selection coefficients. If considerably smaller selection coefficients are assumed, the low observed levels of variation at the tips of the third chromosome are consistent with the background selection model.
R
ECENTLY, it has been shown that the continual production of deleterious mutations along with their continual elimination by natural selection can the- oretically reduce the levels of neutral variation main- tained at linked loci (CHARLESWORTH et al. 1993). This reduction of neutral variation due to linkage to deleteri- ous mutations is referred to as the "background selec- tion" effect. Using Monte Carlo simulations, it was shown that the background selection effect was most pronounced in regions of low recombination (CHARLES WORTH et al. 1993). This raised the interesting possibil- ity that background selection on deleterious mutations might account, at least in part, for the observation that regions of the Drosophila genome with low rates of recombination exhibit low levels of variation at the DNA level (AGUADE et al. 1989; STEPHAN and LANGLEY 1989; BEGUN and AQUADRO 1991; BERRY et al. 1991; BEGUN and AQUADRO 1992; MARTIN-CAMPOS et al. 1992; STEPHAN and MITCHELL 1992; LANGLEY et al. 1993; AGU- ADE and LANGLEY 1994; AQUADRO et al. 1994). The theo- retical analysis of CHARLESWORTH et al. (1993) did not give the precise dependence on recombination rates of this background selection effect. This has limited to some extent our ability to explore the possibility that background selection is playing an important role in determining the levels of variation in various parts of the Drosophila genome. Motivated by this problem, we have obtained approximate analytic results concerning the combined effects of background deleterious muta- tions and recombination on levels of linked neutral variation. These results, as well as simulation results to assess the accuracy of the approximations, are pre- sented here. In addition, we illustrate how to use theseCurresponding author; Richard R. Hudson, Department of Ecology and Evolutionary Biology, University of California, Irvine, CA 92717.
E-mail: [email protected]
Genetics 141: 1605-1617 (December, 1995)
analytic results by calculating the expected levels of vari- ation as a function of physical position for the third chromosomes of Drosophila melanogaster, and we com- pare these calculated values to observed levels of varia- tion on the third chromosome.
THEORETICAL ANALISIS
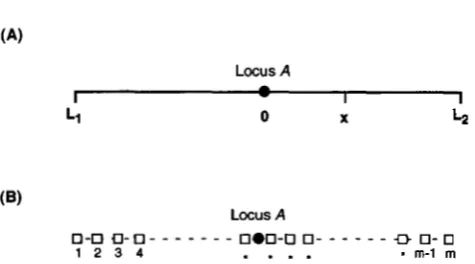
Our goal in this section is to obtain an analytic expres sion for the mean nucleotide diversity at a neutral locus, denoted locus A, embedded in a large region in which deleterious mutations occur. Figure 1A depicts the situ- ation being considered. Approximate results will be pre- sented for a general model in which deleterious muta- tion rates and recombination rates can vary throughout the region. The positions of sites in this region are described in terms of their physical distance from locus A . For concreteness, we suppose for the moment that physical distance is measured in kb. A site x kb to the right of locus A will be said to be at position x. A site x kb to the left of locus A will be said to be at position
"x.
We denote the diploid deleterious mutation rate per generation per kb at position x by u ( x ) and the recombination rate per generation between locus A and a site at position x by R( x). We assume that recombina- tion rates are small enough that recombination rates are additive over contiguous intervals, so that we can write R( x) =s,"
r(y) dy, where r(y) is the local recombina- tion rate. (That is, r(y)Ay is approximately the probabil- ity of recombination per generation between the site at y and the site at y+
Ay.) The far left end of the region is at position 4 , and the far right end is at position L2. It follows that, U, the total diploid deleteri- ous mutation rate in the region from position Ll to&
equals
R. R. Hudson and N. L. Kaplan 1606
(A)
(B)
Locus A
0-0
a - 0 -
- - - -
- - 0 m 0 - 0 0 -- - - - - -rJ
0- 01 2 3 4
. . . .
-
m-1 rnFIGURE 1.-Models considered. (A) The continuous model considered in THEORETICAL ANALESIS. Locus A, where neutral variation occurs, is embedded in a region in which deleterious mutations occur and whose left end is at position L, and
whose right end is at position &. Positions are measured in
units of physical distance from locus A, with positions to the
left of locus A having negative values. (That is, Ll < 0 and I+
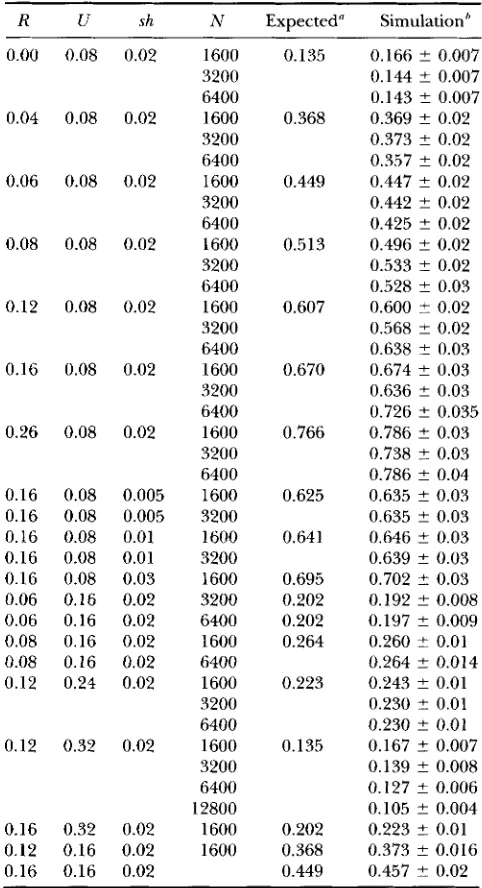
> 0.) The deleterious mutation rate per kb, at a site x kb to the right of locus A is denoted u ( x ) . (B) The mlocus model
that approximates the continuous model in A.
We assume that every deleterious mutation has the same selective effect, sh, and that deleterious effects combine multiplicatively. That is, an individual hetero- zygous for
i
deleterious mutations will be assumed to have fitness (1 - sh)'. We assume that the selection coefficient, sh, is sufficiently large that individual muta- tions never reach high frequency. With these assump- tions, in a very large population at equilibrium, the frequency of chromosomes with i deleterious muta- tions, denotedX (
U/2sh), is approximately(KIMURA and "A 1966). In other words, at equi- librium the number of deleterious mutations in the region on a random chromosome has a Poisson distri- bution with mean U/2sh. CHARLESWORTH et al. (1993) have shown, for an infinite-sites model with no recombi- nation [ i . e . , with R(x) equal to zero for all x E (L1,
& ) I ,
that the expected nucleotide diversity at locus A,denoted T , is equal to no exp(- U/2sh), where T O is the
nucleotide diversity that would be expected at locus A under the neutral model, in the absence of any back- ground selection effect. [At equilibrium under an infi- nite-sites Wright-Fisher neutral model, r0 is 4Np, where N is the diploid population size and M is the neutral mutation rate (KIMURA 1969). We will refer to the Wright-Fisher neutral model without background selec- tion as the strict neutral model.] Our goal is to calculate T for cases in which R(x) is not zero.
We approximate the model just described by an m locus model, as shown in Figure 1B. Properties of the desired model will be obtained by taking the limit as m
tends to infinity. In the mlocus model, we number the loci from 1 to m, from left to right in the region. The ith locus has deleterious mutation rate u ( x , ) A x , where
A x = (& - L 1 ) / m and x, = i A x
+
4 .
It is assumedthat no recombination occurs within each locus, and that the recombination rate between the neutral locus (locus A) and the ith locus is R ( x j ) . To begin, we focus on the effects on 7r of deleterious mutations at a single one of the m loci, say the jth locus. That is, we suppose, for a moment, that u( x,) is zero for all values of i, except i = j . In this case, the problem is reduced to a two-locus model, such as that analyzed by HUDSON and KAPLAN
(1994). If u ( q ) A x and R(x,) are small, it has been shown for the two-locus model that = 7r$,, where
4 = 1 - u ( q ) A x . s h
2(sh
+
R(Xj))2[from Equation 14 of HUDSON and KAPLAN( 1994)
1.
Equation 3, which expresses the effect of deleterious mutations at a single locus on nucleotide diversity at locus A, is rederived in APPENDIX A. The problem is to determine the simultaneous affect of many such linked loci at varying distances from locus A. Remarkably, if the deleterious mutation rates at each locus are small and the population size is large, the combined effects of many loci can be obtained by simply multiplying together the effects of the individual loci. That is, 7r isgiven by
m
7r
= T o
nF2.
(4)E= 1
Because of this property, results are easily obtained. A derivation of (4) is given in APPENDIX A.
From (3) and (4), it follows, for the mlocus model, that
=
no exp[ -2
u( x j ) A x . sh i= 1 2(sh+
R ( x J ) *which, as m tends to infinity, approaches
n
=
T o exp[ - u ( x) shdxwhich is our main result. MAGNUS NORDBORG, BRIAN
CHARLESWORTH and DEBORAH CHARLESWORTH (unpub-
lished results) have obtained essentially the same result by a different approach.
We now consider some special cases. Suppose that
u ( x ) is constant and equal to u. Also, suppose that the recombination rate per kb is constant in the region. In addition, we assume that the recombination rate is sufficiently low that R( x) is linear, Le., that R ( x ) = rl
X I
,Deleterious Background Selection 1607
If the neutral locus is precisely in the center of the region, then
(7)
simplifies toU
T
=
7r0 exp[
- ___ 2sh+
R]'where Uis the total diploid deleterious mutation in the region, and R is the recombination rate between the ends of the region.
If rL2 and rl I,,
I
are both large compared to sh, then the term in curly brackets of(7)
is approximately2,
andwhich is the result suggested by HUDSON and KAPLAN
(1994). This is also the same reduction factor that BAR
TON (1995) found for the effect of background selec- tion on the probability of fixation of a weakly selected favorable mutation.
Equation 9 shows that, under certain conditions, the decrease in heterozygosity due to background selection depends on u / r but is independent of the selection coefficient against the deleterious mutations. It is im- portant to note that this lack of dependence on selec- tion coefficients depends on the recombination rate per unit physical distance being constant for a large region on each side of the neutral locus. For loci in regions of very low recombination this is unlikely to be true. Typically for a locus in such a region, the recombi- nation rate increases dramatically as one moves a small map distance away from the locus (or in some cases the tip of the chromosome is encountered). Equation 9 will overestimate the background selection effect on such a locus.
To verify that (8) is a good approximation for the background selection effect on a locus in the middle of a region of uniform recombination, Monte Carlo simulations were carried out and are reported in the next section.
SIMULATIONS
Simulations very similar to those of CHARLESWORTH et al. (1993) were carried out to check the approximate results derived in the previous section. In these simula- tions, N diploid individuals were represented in the computer. Haploid genomes were represented as lists of sites at which deleterious mutations were present. In all the simulations, sites were labeled from 1 to 10,000, from left to right. To produce a descendent generation,
the following procedure was carried out N times. (1) Two random individuals from the parent generation were chosen.
(2)
One possibly recombinant and mu- tated gamete was produced from each of these individu- als. Each new gamete was produced without any cross- overs with probability 1 - R and was produced via a single crossover (at a randomly chosen site) with proba- bility R. A Poisson distributed number of new mutations were added to the gamete, at sites randomly chosen from the integers 1 to 10,000. The mean number of new mutations added per gamete was U/2. (3) The fitness ( w ) of the zygote, formed by the union of the two gametes produced in step 2, was calculated as (1- sh) ', where i is the sum of the number of deleterious mutations on the two uniting gametes. (4) With proba- bility w the zygote was added to the growing list of the parents for the next generation, otherwise the new zygote was discarded and the program returned to step 1.
To determine the effects of background selection of deleterious mutations on linked neutral variation, a neutral locus was assumed to be located between site 5000 and site 5001 of the genomes described above. To estimate the expected nucleotide diversity at the neutral locus, a slight modification of the method of CHARLESWORTH et al. (1993) was used. Namely, after an equilibration period of 1000 generations, the following cycle was repeated many times. Neutral variation was introduced at the neutral locus, and evolution of the population was allowed to proceed until all variation at the neutral locus was lost. Each generation of this pe- riod, during which neutral variation persisted, the het- erozygosity at the neutral locus was calculated. These heterozygosities for each generation of the cycle were summed. When all variation at the neutral locus was lost due to drift, an additional 100 generations were simulated, and then a new cycle was begun by reintro- ducing neutral variation. Many such cycles were carried out. To be more explicit, let us denote the heterozygos- ity in the tth generation of the ith cycle by z,. We then calculated, for the ith cycle, the sum, H, =
E
z,, where the sum is over all generations ofthe ith cycle. If a total of M cycles were carried out, the mean and variance of the H s were estimated byH = H , / M (10)
and
M
s'
= ( H , - H ) ' / M . (11)1
1608 R. R. Hudson
variation at the beginning of each cycle by introducing a single mutant at frequency 1/2N. (They actually had 25 different neutral sites, at each one of which they introduced a single mutant allele.) With this method, the expectation of
f i
calculated with ( l o ) , is propor- tional to the expected nucleotide diversity and is equal to 2 under a strict neutral model without background selection (KIMURA 1969, 1971; CHARLESWORTH et d .1993). Instead of introducing a single neutral mutant, we introduce variation at the beginning of each cycle by introducing 2N different neutral alleles at a single neutral site, each allele having initially a frequency of 1/2N. In our simulations, the heterozygosity ( h , ) in the tth generation is calculated as 1 -
E,(&(
t)), wherepi(
t) is the frequency of the ith neutral allele in generation t. If variation is introduced in this way, the sum of hetero- zygosities, when divided by N, has the same expectation as the sum calculated by CHARLESWORTH et al. We found that introducing 2N distinct neutral alleles at the begin- ning of each cycle, instead of introducing a single mu- tant allele, reduced the number of cycles required to get good estimates of the mean summed heterozygosities. Thus, the mean summed heterozygosities calculated in this way divided by 2N is an unbiased estimate of the multiplicative factor by which heterozygosity is reduced by background selection. This is explicitly shown in AP- PENDIX B. Summarizing, we estimate n/no by(k)
= H/2N,and the SE of this estimate was calculated as
Table 1 shows some simulation results along with the predicted result using (8). Overall, the agreement is excellent. With small population size ( N = 1600), there are two cases where the simulation mean heterozygosity in the simulations is slightly, but significantly, larger than predicted mean heterozygosity. For larger popula- tion sizes, all the simulation results are within two stan- dard errors of the predicted value, with the exception of one case (with N = 12,800) in which (8) predicts an 87% reduction in variation, whereas the simulation shows a 90% reduction in variation. We conclude that the approximation is excellent for a wide range of pa- rameter values.
AN APPLICATION
In this section, we illustrate the use of our analytic results by predicting levels of variation on the third chromosome of D. melanogaster and comparing the pre- dictions to observed levels of variation. We will consider predictions based on (9) and also based on (6). Equa- tion 9 requires that the recombination rate be constant for all sites within a large distance of the locus where
and N. L. Kaplan
TABLE 1
Expected nucleotide diversisity: a comparison of approximate theoretical expectations and simulation results
R U sh
0.00 0.08 0.02
0.04 0.08 0.02
0.06 0.08 0.02
0.08 0.08 0.02
0.12 0.08 0.02
0.16 0.08 0.02
0.26 0.08 0.02
0.16 0.08 0.005
0.16 0.08 0.005
0.16 0.08 0.01
0.16 0.08 0.01
0.16 0.08 0.03
0.06 0.16 0.02
0.06 0.16 0.02
0.08 0.16 0.02
0.08 0.16 0.02
0.12 0.24 0.02
0.12 0.32 0.02
0.16 0.32 0.02
0.12 0.16 0.02
0.16 0.16 0.02
N 1600 3200 6400 1600 3200 6400 1600 3200 6400 1600 3200 6400 1600 3200 6400 1600 3200 6400 1600 3200 6400 1600 3200 1600 3200 1600 3200 6400 1600 6400 1600 3200 6400 1600 3200 6400 12800 1600 1600
-
Expected" Simulation''0.135 0.368 0.449 0.513 0.607 0.670 0.766 0.625
0.64 1
0.695 0.202 0.202 0.264 0.223 0.135 0.202 0.368 0.449
0.166 ? 0.007 0.144 ? 0.007 0.143 2 0.007 0.369 ? 0.02 0.373 ? 0.02 0.3.57 2 0.02 0.447 2 0.02 0.442 2 0.02 0.425 2 0.02 0.496 ? 0.02 0.533 2 0.02 0.528 ? 0.03 0.600 f 0.02 0.568 2 0.02 0.638 2 0.03 0.674 ? 0.03 0.636 ? 0.03 0.726 ? 0.035 0.786 ? 0.03 0.738 2 0.03 0.786 ? 0.04 0.635 ? 0.03 0.635 2 0.03 0.646 ? 0.03 0.639 2 0.03 0.702 2 0.03 0.192 ? 0.008 0.197 2 0.009 0.260 2 0.01 0.264 ? 0.014 0.243 ? 0.01 0.230 2 0.01 0.230 ? 0.01 0.167 t- 0.007 0.139 ? 0.008 0.127 ? 0.006 0.105 2 0.004 0.223 5 0.01 0.373 ? 0.016 0.457 t 0.02
I' Expected values are calculated with Equation 8 with T,, =
'
Simulation results are the means t- SE obtained from 100 1 .O.cycles as described in the text.
variation is to be predicted. The more complicated (6) does not require constant recombination rates and is expected to provide more accurate predictions. Ob- served levels of variation, which we compare to the pre- dictions based on (9) and (6), are estimates of 8(=4Np)
Deleterious Background Selection 1609
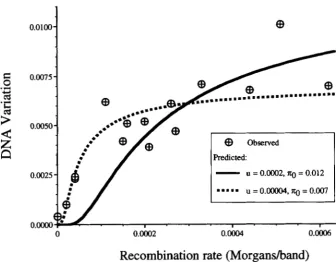
Recombination rate (Morganshand)
FIGURE 2.-Observed and pre-
dicted levels of DNA variation as a function of local recombination rates. The observed levels of DNA variation are estimates of 6’ for 15 loci
on the third chromosome of D. melu- nogmter obtained from E. KINDAHI.
and C. AQUADRO (personal commu-
nication). These loci are, from left to
right on the figure, L s p l y , PC, Antp, Gld, Ubx, &a,&, Mlc2, q, Sod, TI, Rh3,
Estb, E($), and Hsp26. The local re- combination rates for these loci were
also provided by E. KINDAHL and C.
AQUADRO. The predicted levels of variation are obtained with (9) with
the parameter values indicated on the figure.
proximately the same expectation under the back- ground selection models. [This is true, since, as argued in APPENDIX A and also HUDSON and -LAN (1994), the frequency spectrum of neutral variants are approxi- mately the same under a strict neutral model and under the background selection model.] Since the estimator of
0
has a lower variance than the estimator of 7r (NEI1987), we have used 0 when published estimates were available, and 7r otherwise.
Recently, E. KINDAHL and C. AQUADRO (personal communication) obtained estimates of levels of DNA variation for 15 loci on the third chromosome of D.
melunoguster. They also estimated the local recombina- tion rate for each of these loci using published cytologi- cal and genetic map data and plotted the observed lev- els of variation as a function of recombination rate. Their data are replotted in Figure 2, which shows the very strong positive relationship between level of varia- tion and local rate of recombination noted by KINDAHL and AQUADRO. The expected dependence of level of variation on local recombination rate can be obtained with (9) if values can be assigned to the two parameters, u and 7ro. The parameter u can be estimated as follows. The total diploid deleterious mutation rate in D. melunc-
gaster has been estimated from mutation accumulation studies to be 1.0 or larger (CROW and SIMMONS 1983; KEICHTLEY 1994). Since there are -5000 cytological bands in the Drosophila genome, we estimate u, the deleterious mutation rate per generation per band, to be 1.0/5000 =
2
X We have no upriori
estimate of 7ro and hence we choose its value to produce a goodfit to the observed levels of variation. In Figure 2 , (9) is plotted as a function of r, with u = 2 X
lop4
and 7ro= 0.012. The curve gives a fairly good fit to the loci
with moderate to high recombination rates but predicts much lower levels of variation than are actually ob- served in regions of low recombination. Equation 9 is also plotted in Figure 2 with u = 4 X and 7ro = 0.007, which fits moderately well over the full range of recombination rates. The parameter values, u = 4 X
lop5
and 7ro = 0.007, were obtained by fitting (by leastsquares) a straight line to the logarithm of the observed levels of variation plotted as a function of l/r, where r is the local recombination rate. Although a good fit with (9) is possible with u = 4 X this value of
u is too low to be compatible with estimated rates of deleterious mutation in Drosophila. As mentioned ear- lier, (9) is likely to overestimate the background selec- tion effect for loci in regions of very low recombination. For this reason, a prediction based on (6) and using information on the entire genetic map, rather than just the local rates may be more accurate. We now calculate the expected level of variation using (6).
In D. melunogusterwe know the approximate physical position and genetic map position of a large number of loci. With such information and a few simplifjmg assumptions, we can obtain an estimate of R ( x ) , the function describing the relationship between recombi- nation distance and physical distance, that appears in ( 6 ) . It is then possible to calculate 7r for any site in the genome using (6).
1610 R. R. Hudson and N. L. Kaplan
Chromosome
3
- ... .. ... ".
... ... "" ...
0 500 ldoo 1500 2doo
Physical Distance (band)
FIGURE: 3.-Map distance as a function of physical position on the third chromosome of D. mlanogaster. Physical position is measured as total number of cytological bands from the left tip of the chromosome. Map distance data are from The Drosophila
Genetic Database (FLYBASE 1994). Numbers of bands for each cytological division were obtained from SORSA (1988).
(1994). This file contains an ordered list of the subdivi- sions with a map position associated with each subdivi- sion. This data on map positions is rather crude and hence the predictions we obtained from them should be regarded as tentative. This map information on 235 subdivisions was reduced further by eliminating from the list all subdivisions that were indicated as having the same exact map position as the previous subdivision. This was done to avoid having intervals with estimated recombination rates of zero as an artifact of having map positions rounded to the nearest cM or, in some cases, to the nearest tenth of a cM. This procedure yielded a list of 107 subdivisions each with a map position greater than the map position of the previously listed subdivi- sion. We associate with each of these subdivisions a single point (or locus) with physical distance from the tip of
3 L given by the sum of the number of bands in all the subdivisions to the left of the subdivision. We number these loci from 1 to 107 and denote the physical position of locus i by
x,
and the map position (in morgans) byM(x,).
The physical and genetic position of these 107 loci are plotted as squares in Figure 3. The dashed lines connecting the squares in the figure are linear interpola- tions of the map positions of sites located between the loci. The interpolations represented by these dashed lines can be used to obtain an approximateR(x)
, the function that appears in (6), for any site on the third chromosome. In this caseR(x)
is piecewise linear and the integral in (6) is easy to calculate, if we assume that the mutation rate per band is constant throughout the chromosome. Note that we have assumed that recombi- nation rates between loci are equal to the differencebetween the (approximate) map positions of the loci. This is a good approximation for tightly linked loci but not for loosely linked loci. However, the errors in our predictions due to this approximation should be small since it is only quite tightly linked loci that produce a background selection effect at a given locus.
Using (6) with
R(x)
obtained as just described and assuming that the mutation rate per band is constant, we find that the predicted ratio, 7 r / 7 r U , for locus k isgiven by
T / T ( , = e-",
where
1
(sh
+
I
M(xi) - M ( x J 1/21The terms in the denominator,
I
M ( x , ) - M ( x k )I
andI
M ( X > + ~ ) - M ( x k )I
, are each multiplied by 1/2 in this expression to account for the fact that recombination does not occur in males. For the X chromosome one would multiply these terms by z / 3 , instead of 1/2. Termsin this sum for which both
I
M ( x , ) - M ( x k )I
/ 2 andDeleterious Background Selection
0.0100
Chromosome
3
161 1
l o
0.0075
e
0.0050
1:
oo4
z
n
0.0025
-
8
ObservedPredicted
A sh = 0.03
0 sh =0.02
0 sh =0.005
A n A D
0.ooOot.
. . .,
.. .
P.
.,
. .. .
I ..
0
500
1000
1500
2000
Physical Position (band)
FIGURE 4.-Observed and predicted levels of DNA variation as a function of physical position on the third chromosome of D. rnehnogaster. The observed data, from left to right, are from the following loci: Lspl-y, Hsp26, Sod, Est6, ft, tru, PC, Antp,Gld, MtnA, Hsp7OA, 7y, Ubx, Rh3, E(#), T1, and Mlc2. The DNA variation at MtnA is an estimate of x from LANGE et ul.( 1990) as reported in
BEGUN and AQUADRO (1992). The observed level of DNA variation at Hsp7OA is an estimate of 7r from LEIGH BROWN (1983) as reported in BEGUN and AQUADRO (1992). The other observed values are estimates of 6' provided by E. KINDAHI. and C. AQUADKO (personal communication). Estimates of 7r or 6' are appropriate in this figure. Since 6' has a lower variance than T , we used 6' when
a published estimate was available and 7r otherwise. The predicted values are based on (14) and (15) and assume that x,, = 0.014
and u, the deleterious mutation rate per band, is 0.0002. The map distances shown in Figure 3 are assumed.
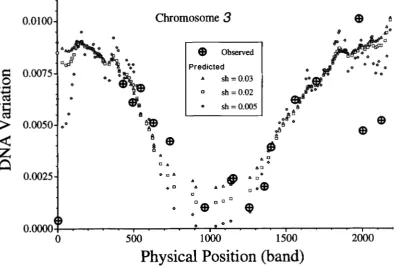
In Figure 4 the levels of variation observed at
17
loci on the third chromosome are plotted, in this case, as a function of physical map location rather than as a func- tion of local recombination rates as was done in Figure 2. The prediction based on (14) is also plotted in this figure with u =2
X T,, = 0.014 and three different values of sh, namely, 0.03,O.OZ and 0.005. The mutation rate of 2 X lop4 corresponds to the previously men- tioned total diploid mutation rate of 1.0 estimated from mutation accumulation studies. The sh value of 0.02is the estimated average strength of selection against spontaneously occurring mutants obtained from the same studies (CROW and SIMMONS 1983). [However, see KEICHTLEY (1994) for a more detailed analysis that allows for a distribution of selective effects.] The value of n o , namely 0.014, was chosen to produce a good fit
to the data as judged by eye. Note that with these param- eter values, even loci in high recombination regions are expected to have levels of variation reduced by -33% due to background selection. In regions of low recombi- nation near the centromere, the reduction in variation is expected to be much greater, around a 90% reduc- tion. This is a somewhat larger effect than calculated by CHARLESWORTH et al. (1993). With = 0.014, the fit of the data to the model is remarkably good except at the tips of the chromosome. There is a particularly large
discrepancy at the very tip of 3L, where the observed nucleotide diversity is well below the prediction based on (6). This discrepancy is not due to approximations in the analysis of the model, which correctly incorpo- rates the edge effects on loci near the telomere. Smaller selection coefficients would lead to greater reductions in neutral variation near the telomeres and centromeres, however, even with sh as small as 0.005, the predicted level of variation at the tip of 3L is well above what is observed. If sh = 0.002, then the predicted level of varia- tion at the tip of 3 L is close to the observed level. This value of sh is an order of magnitude smaller than esti- mated by CROW and SIMMONS (1983) and would predict lower levels of variation in the centromeric region than are actually observed.
Note also that for much of the chromosome the pre- dicted nucleotide diversity is not strongly dependent on sh, consistentwith (9), but in regions of low recombi- nation, smaller sh leads to larger reductions in nucleo- tide diversity. Thus the extremely large background se- lection effect predicted by (9) for loci i n regions of low recombination is not predicted by (6) when sh = 0.02
1612 R. R. Hudson and N. L. Kaplan
that sh
<
0.005, (9) should not be used to predict levels of variation for loci such as Lspl-y, near the tips of the chromosomes or loci such as PC and Antp near the centromere.To predict the levels of variation on the X chromo- some, several modifications of (14) and (15) are re- quired. First, as mentioned earlier, the two terms in the denominator that are divided by
2
for autosomes are instead divided by 1.5 for the X chromosome, to ac- count for the fact that recombination occurs only in males and the fact that X chromosomes occur in fe- males two-thirds of the time instead of one-half the time for autosomes. In addition, since Xchromosomes occur as single copies in males, the selection on mutations in the hemizygous state must be considered. If the selec- tive effect of a deleterious mutant in hemizygous state is s, then sh must be replaced in (15) by 2 s h / 3+
s / 3(CHARLESWORTH et al. 1993). In addition 7ro is expected to be only threequarters as large for an X-linked locus as for an autosome, since in a population of Ndiploids there are only 1.5N copies of an X-linked gene, as op- posed to 2N copies of an autosomal gene.
Our model incorporates several simplifjmg, but unre- alistic, assumptions that should be noted, including the assumptions that all mutations have the same selective effect, that deleterious mutation rates are the same across the entire third chromosome, and that all deleterious mutations interact multiplicatively. The poor fit of the model to the data from some chromosomal regions may be due to one or more of these unrealistic assumptions, or the poor fit may be the result of other kinds of selec- tion (e.g., directional selection on advantageous mutants) acting via hitchhiking to reduce neutral variation. These issues are discussed further in the next section.
DISCUSSION
If deleterious mutations interact multiplicatively, we have shown that the effects of background deleterious selection at many loci on neutral variation at a linked locus can be calculated by simply multiplying the effects of the individual deleterious loci. This is expressed in (4) that is derived in APPENDIX A. This result leads imme- diately to (6) with which one can calculate the expected level of variation at a neutral locus embedded in a region with continuous recombination and deleterious muta- tion. To derive these results, we have considered the coalescent process that describes the genealogical his- tory of sampled genes. Briefly, we first consider a single sampled allele at a neutral locus, which is linked to a locus at which deleterious mutations occur. The ances- tor of the sampled neutral allele, t generations back in time, can be characterized by the number of deleterious mutations that are carried on its chromosome at the linked deleterious locus. For large t the distribution of the number of deleterious mutations at the linked locus is a geometric mixture of Poisson distributions, which
depends on the deleterious mutation rate, selection co- efficient and the recombination rate between the neu- tral locus and the deleterious locus. For many linked loci, each with small deleterious mutation rates, the numbers of deleterious mutations on the ancestral chro- mosome at the linked loci are approximately indepen- dent Poisson variables with means for each locus that depend on the recombination rate between the neutral locus and the deleterious locus. In this case, the coales- cent process is straightforward. In large populations, the overall effect of the background selection is to reduce the effective population size but to otherwise preserve the neutral genealogical process. A consequence is that levels of variation are reduced, however, the frequency spectrum of variation is precisely that expected under standard neutral models. Remarkably, under some con- ditions the background selection effect is independent of the strength of selection against the deleterious muta- tions as shown in (9).
Equation 14, which is a special case of ( 6 ) , can be used to predict the effect of background selection on levels of neutral variation when a detailed genetic and cytological map is available, as well as estimates of u,
the deleterious mutation rate per band, and sh, the selection against individual deleterious mutations. Mu- tation accumulation experiments have suggested that u
is -2 X lop4 per cytological band per generation, or perhaps larger, and that sh is -0.02 or perhaps some- what smaller in D. melanogaster (CROW and SIMMONS 1983). With these parameter values we have shown that the background selection effect is expected to be sub- stantial on all loci of the third chromosome. Even at loci in regions of high recombination on this chromo- some, the predicted level of variation is approximately two-thirds the level expected without background selec- tion. Near the centromere of the third chromosome, the background selection model predicts substantial re- ductions in levels of variation. Available data are consis- tent with this prediction. However, using current esti- mates of mutation rates and selection coefficients, predictions for the tips of the third chromosome are not consistent with available data. Loci near the tips of the third chromosome exhibit lower levels of variation than are predicted under the background selection model. Variation on the fourth chromosome is also lower than expected under the background selection model (CHARLESWORTH et al. 1993).
Deleterious Background Selection 1613
number of sites at any locus and each site has at most four possible states and hence multiple hits are possible. For some organisms and some loci, multiple hits will
be common either due to high mutation rates or very long coalescent times, and in these cases a finite-sites model, possibly with variation of mutation rates across sites, will need to be considered. Extending our results to these more realistic finite-sites models will be straight- forward given our results concerning the coalescent times. In fact, since we have shown that the distribution of genealogies with background selection is approxi- mately the same as under strict neutral models, the results for any finite-site neutral models would apply to the corresponding background selection model with the appropriate reduction in effective population size. We note, however, that in
D.
melanogaster there is little evidence of multiple hits in samples taken from within the species, and hence we believe that an infinite-site model is appropriate for interpreting polymorphism data inD.
melanogaster.In our theoretical analysis, we have assumed a com- pletely linear recombinational map without interference. This is not likely to introduce much error into our pre- dictions, since the loci more than a few map units apart are unlikely to have an effect on each other under the background selection model. Over these small distances nonlinearities and interference will have very minor ef- fects. It should be noted that our simulations are based on an assumption of complete interference. BIUAN CHARLESWORTH (personal communication) is currently carrying out simulations with a more realistic model of recombination that should alleviate many concerns about the recombination assumptions used here.
All of our analysis is based on the assumption that fitness is multiplicative across loci. Given the possibility that synergistic interactions may be common (KONDRA- SHOV 1988; CHARLESWORTH 1990), it is important to regard our results as tentative in this regard. CHARLES WORTH et al. (1993) suggested that synergism may in- crease the effect of background selection. It is highly desirable that models with synergism and other forms of interaction be investigated further.
Our predictions using (14) are based on a rather crude genetic map, but these predictions are unlikely to change due to small refinements in the map, unless selection coefficients are smaller than the values that we have assumed. However, if selection coefficients are much smaller, then much greater effects of background selection are expected in regions of low recombination. Also, in this case, the effects are expected to be quite sensitive to small changes in the genetic map. For exam- ple, if the map position of the tip of 3L is assumed to be -0.5 instead of - 1 .0, as we have assumed, and if sh = 0.002, then the predicted nucleotide diversity at the tip of the chromosome is 0.0012. This predicted level of variation is certainly not significantly different from the observed level of variation at Lspl-y, near the tip
of 3L. [E. KINDAHL and C . AQUADRO (personal commu- nication) estimate 8 for this locus to be 0.0004.1 Thus to account for the observed patterns of variation at the tips of the chromosomes, it appears that higher deleteri- ous mutation rates or smaller selection coefficients are required. Smaller selection coefficients might result in the very large background selection effects observed at the tips of the chromosomes and on chromosome 4. However, such low selection coefficients would result in levels of variation lower than are observed near the centromere of the third chromosome at least with the crude map data that we have used. If selection coeffi- cients are typically as low as 0.002, then much more refined genetic maps may be necessary to predict accu- rately the expected level of variation under the back- ground selection model.
Another possibility is that deleterious mutation rates and selection coefficients vary on a large scale across the chromosomes. For example, transposable element insertions are plausibly slightly deleterious mutations (GOLDING 1987), and they are nonrandomly distributed in the genome (CHARLESWORTH et al. 1992). Hence, as suggested earlier by HUDSON (1994), transposable ele- ments may result by themselves in heterogeneous delete- rious mutation rates and thus produce a background selection effect that is nonuniform across the genome.
In addition, we have assumed that all deleterious mu- tations have exactly the same deleterious effect, sh. It is more reasonable to assume that there is a distribution of deleterious effects. Generalizing (6) to the case where
sh has a distribution is straightforward. When recombi- nation rates are zero, the harmonic mean of sh can be substituted for sh, as pointed out earlier (CHARLES WORTH et al. 1993), but when recombination rates are not zero, such a substitution is not appropriate. BRIAN
CHARLESWORTH (personal communication) is currently carrying out a detailed analysis for the third, second and
X chromosomes, using more precise genetic maps and including the effects of transposable elements and distri- butions of selective effects. The predictions based on this more detailed analysis should be much more precise, especially in regions of low recombination.
In conclusion, though parameter values of u and sh
are uncertain, and the nature of the interaction be- tween deleterious mutations is uncertain, it seems very likely that background selection is having an important effect on levels of variation in some regions of the
D.
1614 R. R. Hudson and N. L. Kaplan
neutral variants under the background selection model is approximately the same as under a strict neutral model. This is in contrast to the hitchhiking of advanta- geous mutants model that has also been proposed as an explanation of the low levels of variation observed in regions with low recombination (KAPLAN et al. 1989; WIEHE and STEPHAN 1993). Under the hitchhiking of advantageous mutants model, low frequency variants are expected to be more common than under a neutral model (BRAVERMAN et ul. 1995). A global analysis of the frequency spectrum of variants in different regions of the L). melanoguster genome may be quite informative
for distinguishing between the background selection and the hitchhiking models.
Many properties of genetic variation depend on the effective population size. The analysis that we have car- ried out suggests that effective population size may be very different for different regions of the Drosophila genome. This will influence equilibrium levels of varia- tion as described above, but many other properties as well. For example, we expect measures of geographic structure, such as
F,,,,
for loci in regions of low recombi- nation could be much larger than for loci in regions of high recombination because the product of' effective population size and migration rate will be much smaller in regions of low recombination. Similarly, aspects of the evolution of a population that depends on the prod- uct of population size and selection coefficient are likely to be different in regions low recombination than in regions of high recombination. Thus background selec- tion may dramatically effect the evolutionary process in large portions of the genome.This work was supported in part by U. S. Public Health Service grant GM-42397. We also thank BRIAN and DEBORAH <:HARl.ESWORTH for helpful discussions and for suggesting that predictions for entire chromosomes would be useful. MA(;NL~S NORDROKG, BRIAN
~ ~ 1 I A R I . t S U ' O R I ' I l and Dk:BoRAr I cHrUU.ESWORT H also generously shared unpublished results.
LITERATURE CITED
A C X I A I ) ~ , M., and C . H. LANGI.EY, 1994 Polymorphism and diver- gence in regions of low recombination in Drosophila, pp. 67-
76 in Non-neutral Evolution: lhem'es and Molecular Data, edited by
C;. B. GOl.I)lNG. Chapman & Hall, New York.
AGLADE, M., N. MIYAslwrA and C. H. L A N G I . w , 1989 Reduced varia- tion i n the yellow-achaete-scute region in natural populations of
Dros@hila mlanogaster. Genetics 122: 607-615.
AQLIAI)RO, C. F., D. J. BEGLJN and E. C:. KINDAHI., 1994 Selection, recombination and levels of DNA polymorphism in Drosophila, pp. 46-56 i n Non-neutral Evolution: Throrirs and Molecular Data,
edited by G. B. G ~ I . D I N C ; . (:hapmall 8c Hall, New York. BAKTON, N . H., 1995 Linkage and the limits to natural selection.
(knetics 140: 821-841.
BEGCN, D. J., and C. F. AQLJADRO, 1991 Molecular population genet- ics of the distal portion of the X chromosome in Drosophila: evidence for genetic hitchhiking of the yellow-achaete region. Genetics 129: 1147-1158.
Bt:(;~w, D..I., and C,F. AQLIAIIRO, 1992 Levels of naturally occurring
DNA polymorphism correlate with recombination rates in L).
melanogaster. Nature 356: 519-520.
BERRY, A.
J...I.
U'. Ayouand M. KREITMAN, 1991 Lack of polymor- phism on the Drosophila fourth chromosome resulting from selection. Genetics 129: 1111-1 117.BRAVERMAN,J. M., R. R. HLIDSON, N. 1.. KAPIAN, C . H. 1 n N c ; l . w and U'. S ~ E P H A N , 1995 The hitchhiking effect on the site frequency spectrum of DNA polymorphisms. Genetics 140: 783-796.
<:HARI.ESWORTII, B., 1990 Mutation-selection balance and the evolu-
tionary advantage of sex and recombination. Genet. Res. 55:
199-221.
(:HAKl.E:SWORTIf, B., A. LAPID and D. (;AK.AI)A, 199'2 The distribution of transposable elements within and between chromosomes i n a population o f Drosophila melanogaster. I. Element frequencies and distribution. Genet. Res. 60: 103-114.
CHARI.ESWORI'H, C., M. T. MORGAN and D. (:IIAKI.ESU'ORII1, 1993
The effect of deleterious mutations on neutral molerulal- varia- tion. Genetics 134: 1289- 1303.
CROW,J. F., and M. J. SIMMONS, 1983 The mutation load i n Drosoph- ila, pp. 1-35 in The Gmrtir.\ and Biology oJIlro.rophilu, edited hy M. ASIIRLIRNER, H. L . (:ARSON and J. N. THOMPSON. Academic Press, London.
F L ~ A S F , , 1994 The Drosophila Genetic Database. Availabk from the ftp.hio.indiana.edu network server and Gopher site.
GoI.nlNc:, G. B., 1987 The detection of deleterious selection using
49: 71 -82.
ancestors inferred from a phylogenetic history. Gellet. Res. Camb
HUININ, R. R., 1994 How can the low levels of DNA sequence varia- tion ill regions of the Drosophila genome with low recombination
rates he explained? Proc. Natl. Acad. Sci. USA 91: 6815-6818.
HUIISON, R. R., and N. I.. KAPIAN, 1994 Gene treeswith background selertion, pp. 140- 153 i n ~~~~i,,n-nr.utr~~lEuolution: Thvorirs and Molur- ukcr Data, edited by G. B. GOI.INN(;. Chapman & Hall, New York.
K A P I A N , N. L., R. R. HL'I)SON and C. H. LANGI.F,Y, 1989 The "hitcll- hiking effect" revisited. Genetics 123: 887-899.
KF.IGIITI.EY, P. D., 1994 The distribution of mutation effects on via- bility in llrorYf,hzla mlunoguster. Genetics 138: 1315- 1322.
KIMI'RZ, M., I969 The number o f heterozygous nucleotide sites
maintained in a fiuite population due to steady flux of mutations. Genetics 61: 895-903.
KIMI~M, M., 1971 Theoretical foundations of population genetics
at the molecular level. Theor. Popul. Biol. 2: 174-208.
KIMLIRZ, M., and T. MARIIYAMA, 1966 The mutational load with epi-
static gene interactions in fitness. Genetics 54: 1337-1351. KoNoRAsllov, A. S., 1988 Deleterious mutations and the evolution
of sexual reproduction. Nature 336: 435-440.
IAN(:E, B. W . , C. H. IAN(x,w and W'. H. SI'EPIIAN, 1990 Molecular evolutiou of Drosophila metallothionein genes. Genetics 126:
921 -932.
Lack o f . correlation between interspecific divergence and intra- specific polymorphism at the suppressor of forked region i n flro-
sophila mrlanogasterand 1)rosophila simulans. Proc. Narl. Acad. Sci. USA 90: 1800-1803.
I.elc;tt BROWN, A. J., 1983 Variation at the 87'4 heat shock locus i n
flro.rophilrc melanogastrr. Proc. Natl. Acad. Sci. IJSA 80: 5350-5354. 1992 Intraspecific and interspecific variation at the y-ar-.\c. re- gion o f Urosophilo simulans and llrosophila mrlanogastrr. Genetics
130: 805-816.
Ner, M . , 1987 Molurular Evolulionn? Genrlzc.~. (:olnrnhia Univrrsitv Press, New York.
SORSA,\'., I988 Lhromosomv Maps o/I~rosophik~. (;IN> Press, Inc., Boca Raton, Fl..
STEPHAN, W., and G , H. L A N C : I . ~ Y , 1989 Molecular genetic variation in the centromeric region of the X chromosome i n three Ihmoph-
and forked loci. Genetics 121: 89-99.
ila ananasroe populations. I . Contrasts between the vermillion S~EPHAN, UT., and S. J. MrrcIw.I,I,, 1992 Reduced levels of DNA poly-
morphism and fixed betweell-population differences in the cen- tromeric region o f k ~ s o p h i k ~ ananuwzr. Genetics 132: 1039-1045. TAIIMA, F., I983 Evolutionary relationship of DNA sequences i n fi-
nite populations. Genetics 105: 437-460.
WATTE.RSON, G, A., 197.5 On the Ilnmher of segregating sites i n genetical models without recombination, Theor. Pop. Biol. 10:
256-276.
WIF,rrF,, T. H. E., and W. SmrtI.m, I993 Analysis of a genetic hitch- hiking model, and its application to DNA polymorphism data from I h w p h i l a ?n&moga~trr. Mol. B i d . Evol. 10: 842-54. LWGI.EY, C:. H., J. M.U;l)ONAI.I), N. MIYASIIII'A and M. A<;r'tZL)L, I993
MART~N-CAMPOS, J , M., J. P. C O M E R O N , N. MIY,\SHIIA and M. A<~UAI)I,
Deleterious Background Selection 1615
APPENDIX A
To make the paper selfcontained we rederive (3) in a
way that is more appropriate for the problem in this paper. We then derive (4). Let T denote the time (measured in generations) until two randomly chosen chromosomes at the neutral locus A have a common ancestor. If p is the neutral mutation rate, then under an infinite-sites model
where N is the diploid population size and T~ = 4Np.
HUDSON and -LAN (1994) calculated E( T) , assuming the neutral locus A was linked to a single deleterious locus, using a set of recurrence equations. We now de- scribe an alternative approach that can be generalized to more than one linked deleterious locus.
Following the notation in the text, we define for i = 1, 2
X,(
t ) = the number of deleterious mutationsat locus
j
on the ancestral chromosomein the tth ancestral generation,
of the ith sampled chromosome.
X, and
X..
have the same distribution, and if the popu- lation size is very large, then we can also assume that they are independent. Since all chromosomes having k deleterious mutations are selectively equivalent, the probability, A,, that the two chromosomes have a com- mon ancestor in generation t equalswhere we recall that for x
>
0 and k 2 0,and u ( x , ) A x is the deleterious mutation rate at locus
j .
2Nf,( u(
q )
Ax/2sh) is the number of chromosomes at equi- librium with k mutations at locusj (&MUM and "A1966).
If
N
is large and time is measured in units of 2 Ngenerations, then it follows from (A2) that the distribution of Tis approximately exponential with parameter
where
P,(k) = lim-P(X1(t) = k ) ,
assuming the limit exists. Hence E( T) % (Am)".
The same line of reasoning applies if there is more than one deleterious locus. Indeed if there are m such loci, then
where - k = (kl,
b,
. . .
,
k m ) andnPl
&(u( x j ) A x / 2 s h ) is the frequency of chromosomes at equilibrium with k7 mutations at locusj , j
= 1 ,. . .
,
m. The problem thus reduces to studying the behavior ofPm(k) - = lim,P(Xl(t) = ( k l ,
h,
. . .
,
k , ) )We return to the case of one deleterious locus and determine the stationary distribution of X, ( t ) . To sim- plify notation we employ u for u( 5 ) Ax and R for
R(
xj).
We assume that
R
is small enough so that each gamete has at most one recombination event between the two loci per generation. Each generation a randomly cho- sen gamete is either a recombinant or not, with proba- bilities Rand 1 - R, respectively, and has Yl deleterious mutations that were present in the parent and Y2 new mutations. Yl and Y2 are independent Poisson variables with means u/2sh and u/2, respectively. It follows from properties of Poisson variables that the distribution ofYl conditional on the sum Yl
+
Y2
is binomial with one parameter being Y ,+
Y2, and the other parameter equal to the mean of Yl divided by the sum of the mean of Yl and Y2. Thus conditional on X, ( t ) , X , ( t+
1) has with probability 1 - a binomial distribution with parameters X , ( t ) and (u/2sh)/(u/2sh+
4 2 ) = 1/( 1+
sh), and with probability R, a Poisson distribution with mean u/2sh. Let h,(P) = E(PX'"), 0<
P
<
1. It follows from the above that h,+,(P) satisfies the re- cursionwhere
It follows from (A6) that the stationary distribution is a geometric mixture of Poisson distributions.
If u/2sh and sh are small, then we can approximate
k ( P )
ask ( P )
% R (1 - R)k(l -k=O 2sh(l
+
s h ) kHence the stationary distribution of X , satisfies
Pm(l) = uR
1616 R. R. Hudson and N. L. Kaplan
Substituting ( A 7 ) in ( A 3 ) and doing some algebra leads to
A , = l + ush
2 ( R
+
sh)‘and so finally we obtain ( 3 )
We next indicate how to calculate A, for more than one deleterious locus. For simplicity we assume that there are two such loci, but the argument generalizes to any number. Let u1 = u(xl)Axand up = u(%)Ax, be the mutation rates at the two loci and R1 = R(xl ) and R1
+
R2 = R ( x 2 ) be the recombination rates be- tween each of the loci and the neutral locus. [we assume that R( x1 )<
R(%) .] The generalization of ( A 6 ) is straightforward and leads to the following re- cursionRlR2
R1
+
R,
+
sh (R1+
R2+
sh)(Rl+
sh)x
( R l : _ _ _ - ,5h)‘%(’
- P 2 )(
R1 +R,
).
(A10)2sh R1 +
R,
+
shExtending (AZO) to larger numbers of loci is straight- forward. The only conditions that must be satisfied is that the associated recombination rates all be different and that u(x) be well behaved, e.g., piecewise continu- ous. A reasonable condition to impose on R ( x ) is that it can be written as
where r(y)
>
0. If R(x) is constant over a finite interval, i e . , there is a recombinational cold spot, then the dele- terious mutation rate need not be small and so ( A 7 ) does not necessarily hold.It follows from (A10) that at stationarity the numbers of deleterious mutations on the ancestral chromosome
in disjoint intervals I,,
. . .
, I, are nearly independent Poisson variables with means1 1 , 2s;:~;‘: sh)
dx, j = 1 ,
. . . ,
m.An immediate consequence of the independence prop- erty is that
m
,=
Iwhere = ( k l ,
. . .
,a,)
andPm(
k,) is given by ( A 7 ) with the appropriate value of R. The proof of (4) now follows by simple algebra.It is straightforward to generalize the analysis to larger samples. In particular, if a random sample of size
n is obtained from a large population, the time back until the first coalescent event, measured in units of 2 N generations, is approximately exponentially distributed with mean equal to
Any of the (2“) possible pairs of lineages are equally likely to coalesce at the first coalescent event. These are precisely the properties of a gene genealogy of a sample of size n, under a strict neutral model, if A, is set equal to 1 (TAJIMA 1983). Thus, the coalescent process under the background selection model is approximately the same as under a strict neutral model, except that A, is given by ( A 4 ) under the background selection model, whereas
Am
is equal to 1 under the neutral model. Sum- marizing, if the population is sufficiently large, the dis- tribution of gene genealogies of a sample is approxi- mately the same under background selection model and under the neutral model, except that the effective population size under the background selection model is reduced by the factorExp[ -
s”
u( x ) sh d.].I., 2(sh
+
R(x))‘An important consequence of this result is that the sample frequency spectrum is not affected by back- ground selection.
APPENDIX B
In this appendix, we justify using ( 1 2 ) for estimating the mean nucleotide diversity expected under the back- ground selection model relative to the mean nucleotide diversity under a strict neutral model. From ( A l ) it
follows that (12) would provide an unbiased estimate of 7r/7ro, if E ( @ is equal to E( T ) , where T is the time (measured in generations) until two randomly chosen chromosomes have a common ancestor at a neutral locus. We now show that E(&) = E( T ) .
Deleterious Background Selection 1617
>
t) denotes the probability that T is greater than t.(We assume here that Tis a discrete random variable.) With Monte Carlo simulations, we can estimate P( T
>
t ) , for a particular value of t, as follows. Assuming that we have a population at stationarity at the loci at which deleterious mutations occur, we introduce neutral vari- ation at the neutral locus as described in the main text, ie., 2N distinct alleles are introduced, each with fre- quency 1/2N. We run the simulation an additional t
generations with mutation and selection continuing to occur at the background loci, but without mutation at the neutral locus. Since no additional mutations have occurred at the neutral locus, two sampled alleles at
the neutral locus have a common ancestor less than t
generations back only if they are identical. It follows that the expectation of the heterozygosity after t genera- tions is equal to P( T