The Consequences
of
Fluctuating Selection for
Isozyme Polymorphisms in Daphnia
Michael Lynch
Department of Ecology, Ethology, and Evolution, Shelford Vivarium, University of Illinois, Champaign, Illinois 61820 Manuscript received February 7, 1986
Revised copy accepted December 26, 1986
ABSTRACT
Temporal sequences of allele frequencies in natural populations of Daphnia are analyzed to obtain the mean and variance of the selection coefficient for both asexual and sexual phases. In general, the alleles at enzyme loci appear to be quasi-neutral. Although significant variation exists for the estimated selection coefficients, the means are in all cases close to zero. Estimates of the variance of selection intensity are applied to existing models to demonstrate the implications of fluctuating selection for the spatial and temporal distribution of gene frequencies in Daphnia. The empirical and analytical results are shown to provide a possible solution to some previously puzzling aspects of Daphnia population genetic surveys. Neither genetic drift nor diversifying selection are necessary conditions for the local diversification of gene frequencies.
OLLOWING the early work of WRIGHT (1948)
F
and KIMURA (1 954), great advances have been made in the theory of fluctuating selection intensity(GILLESPIE and LANGLEY 1974; KARLIN and LIEBER-
MAN 1974; COOK and HARTL 1975; FELSENSTEIN
1976; HARTL and COOK 1976; HEDRICK, GINEVAN
and EWINC 1976; GILLESPIE 1976, 1978; MATSUDA and GOJOBORI 1979; TAKAHATA and KIMURA 1979; TAKAHATA 1981; TIER 1981). Models now exist for both discrete and overlapping generations, for asex- uality and sexuality, and for finite and infinite effec- tive population sizes. Mutation has been incorporated into some models, as has serial autocorrelation in selection intensity. One of the primary reasons that the problem of temporally variable selection has re- ceived so much attention is that it appears to help maintain genetic polymorphisms in some cases, thereby providing a potential explanation for levels of genetic variance observed in natural populations. Another reason is that the incorporation of variable selection into the theory of rates of molecular evolu- tion is expected in some cases to provide a more satisfactory fit to the data than a purely neutral model
(MATSUDA and GOJOBORI 1979; NEI 1980; KIMURA 1982; NEI and GRAUR 1984).
WRIGHT (1948) and KIMURA (1954) first showed that, under appropriate conditions, random variation in selection intensity could cause a drift-like phenom- enon. Although an analytical error in this work was pointed out by GILLESPIE (1973a) and JENSEN (1973),
the qualitative conclusions have been upheld by many subsequent studies. Random variation in selection can result in substantial divergence in gene frequencies among isolated populations. Indeed, TIER (1 98 1 ) has
Genetics 115: 657-669 (April, 1987)
demonstrated that, for certain parameter values, the expected gene frequency distribution for a random environment model will be virtually indistinguishable from that for a random drift-mutation balance model. Although it is reasonable to expect selection coef- ficients on individual loci in natural populations to be temporally variable, the quantitative significance of variable selection remains an enigma. Genetic studies of natural populations exceeding a few generations are very rare, and for those that d o exist, it is generally difficult to determine the relative contributions of drift, sampling error, and selection to observed gene frequency changes. T h e most familiar empirical study bearing on the problem of temporally variable selec- tion, FISHER and FORD’S (1947) eight-generation cen- sus of the medionigra gene in the moth Panaxia do- minula, drew immediate criticism from WRIGHT ( 1 948). A subsequent analysis of the same data (TUCK- WELL 1976) has also been questioned (TURELLI 1977).
Recently, MUELLER et al. (1985) and MUELLER, BARR and AYALA (1985) have developed statistical tests for detecting natural selection from observed temporal changes in gene frequencies. Their applica- tion of the tests to date on natural populations of
Drosophila pseudoobscura and the butterfly Euphydryas editha led to the conclusion that significant selection was operating on several enzyme loci. Unfortunately, while the analytical procedures engaged by MUELLER, BARR and AYALA (1985) and MUELLER et al. (1985)
658 M. Lynch
gene frequency that they attributed to selection may have resulted from gene flow.
It now appears that further progress in the area of fluctuating selection can be made by analyzing avail- able data on temporal changes of genotype frequen- cies in Daphnia populations. Periodic censuses are available for several populations monitored for up to 8 consecutive years. Depending on the environment, 5-20 overlapping generations may occur each year. Since even during a bottleneck such populations will typically consist of >l O5 individuals (including dia- pausing embryos), random drift can be effectively ruled out as a factor underlying gene frequency changes on a time scale of a few years (LYNCH 1984a). Due to the island-like nature of ponds and the lack of an active dispersal stage in Daphnia, it is also unlikely that significant gene frequency shifts over this time scale would be caused by mass migration. This leaves only sampling error (on the part of the investigator) and selection as explanations for the variance in ob- served gene frequencies.
T h e following study demonstrates that, while alleles at enzyme loci in Daphnia populations are selectively equivalent on average, they are not always neutral in the short term. It will also be shown that the temporal variance in selection is capable of generating differ- ences in gene frequency of the magnitude often ob- served between adjacent populations. This eliminates the need to invoke unreasonable levels of genetic drift or restricted gene flow.
THEORY
Most Daphnia are cyclical parthenogens. Typically, an indeterminate number of generations of ameiotic parthenogenesis occur annually, interspersed with en- vironmentally induced phases of sex. T h e sexual fe- males produce males and upon fertilization release diapausing eggs. Such eggs generally (always in inter- mittent ponds) do not hatch until the following year o r later. Thus, in order to evaluate the consequences of selection for gene frequencies in Daphnia, two types of models are required: an asexual model with contin- uous growth for phases of clonal propagation, and a monoecious model with discrete “generations” for changes between sexual phases (“generation” being equivalent to a complete cycle of the life history).
An explicit theory for the stochastic behavior of clonal frequencies in infinite populations exposed to fluctuating selection was first presented by GILLESPIE
(1972, 1973a) for both continuously growing and discrete generation populations. A continuous time model is most appropriate for Daphnia since their generations are overlapping. However, since the ac- tual sampling of selection coefficients is necessarily a discrete time process, it is useful to consider a discrete time approximation to the continuous model.
Following CROW and KIMURA (1970; p. 193) and letting
p ,
be the frequency of the clone at time t, it can be shown thatwhere si is the selection coefficient (difference be- tween the clone’s instantaneous rate of increase and that of all other individuals) at time
i.
It is assumed that the time scale is sufficiently small that si is effec- tively constant within an interval. It then follows from logarithmic transformation thatt-I
Et = Eo
-
c
si (2)i=O
where
Et
= ln[(l-
p,)/p,]. Assuming the si to be independently distributed, by the central limit theo- rem, as t + +m, the distribution ofCIIA
si will approach normality with mean t i and variance ta:. T h e proba- bility distribution ofEt
is therefore approximatelyf(.Q
= (2~tas‘)-”’exp{-[~~-
(to
-
ti)12/2ta,21. (3)Transforming equation 3 to the standard normal distribution with U = [&
-
to
+
tS]/a,d, we obtain the probability of quasi-fixationpm
--m
pt(a) =
J
f
and the probability of quasi-loss
f +=
= 1
-
W [ E ( P )
-
EO+ t ~ ] / a , J t ~
of the clone at time t. QI is the minimal
p
consideredto be in the quasi-fixed class,
P
is the maximump
considered in the quasi-lost class, and refers to the cumulative probability function. For situations in which estimates of S and a: are available, these for- mulas provide a basis for estimating the probability that an allele will decline to a level below detectability (or, conversely, increase to a level of apparent fixation) over a prolonged period of clonal selection.T h e consequences of fluctuating selection for polymorphisms in sexual, monoecious populations with discrete generations have been worked out by
HARTL and COOK (1973, 1976), GILLESPIE (1973b), and KARLIN and LIEBERMAN (1974). T h e latter show that if the fitnesses of the AA, Aa, and aa genotypes are represented by 4, 1, and y, then fixation of the a
allele is stochastically locally stable if E[log(l/y)]
<
0, and similarly for the A allele if E[log( 1/4)]<
0. If E ( y )attained. For additive loci, r$ = 1
+
s and y = 1-
s,and the criteria for local fixajon of the A or a alleles are, respectively, -5
+
( 1/2)s2 0 andS
+
( 1/2)s2<
0. In this particular case, either one of the alleles becomes fixed-or a stochastically stable polymorphism arises. Since s2 = U,'
+
PI
the fulfillment of these criteria can be tested when the mean and variance of the selection coefficient for sexual phases is known.Finally, letting a, =
p,/(
1-
Pn)
be the ratio of gene frequencies in the nth sexual generation, the recursion equation for the additive case (fitness 1+
s, 1, 1-
s)follows from standard theory (CROW and
KIMURA
1970),
Thus, by use of equation 5 and information on the distribution of s for sexual phases, the probability distribution of allele frequency can be projected to any future sexual generation.
METHODS
A substantial number of Daphnia populations have been surveyed for genotype frequencies at poly- morphic enzyme loci for one to several years with samples being taken periodically (at
-
1 -5-week inter- vals) within years. Such published data sets, as well as previously unpublished data of my own, provide the basis for the following analyses. In all analyses of clonal selection, data within years were analyzed separately unless it was clear that the population overwintered in the water column. For situations in which such a partitioning of data led to two or more estimates of 5 and U:, pooled estimates of these parameters were obtained after weighting the individual estimates by their sample sizes (e.g., S = n&/Z ni where Si is the ith [annual] estimate of S andni
is the number of individual selection coefficients in the ith analysis).It must be emphasized at the outset that the selec- tion parameters calculated below represent the net
forces operating on single locus genotypes. In theory, the total selection on such a genotype is partitionable into a component operating directly on the locus and a component resulting indirectly from selection on all other linked loci. In practice, however, it is impossible to isolate these two causes in Daphnia. Nevertheless, from the standpoint of the theory outlined above, net selection differentials are the desired parameters.
In order to evaluate the influence of fluctuating selection on the stochastic behavior of genotype fre- quencies during a phase of clonal growth, estimates of the mean
(S)
and variance of (U:) of the instanta- neous selection coefficients are required. Suppose that estimates of genotype frequencies are available at times and t i . An estimate of the mean selection coefficient over that time period can be obtained by,/
rearranging equation 2,
where Tj = tj'
-
4,
and substituting the observed frequencies int5
and51;.
It also follows from equation 2 that5- 1
'=4
d(j] = Si&
(7)
Thus, if
R
estimates of S(j) are available, as when clone frequencies are repeatedly determined over a long period, the estimator of the mean selection coeflicient for that period becomesk
d =
I:
TjS(j)/T (8)j= I
where
h
T =
q.
j= 1
The estimation of U,' poses more of a problem since the time scale on which selection coefficients are mea- sured is coarser than that in equation 1, and since Tj will often vary from interval to interval. Fluctuations in selection intensity that occur within the sampling interval are not directly observable. However, an ap- proximate estimate of U,' may be obtained as follows. From Taylor expansion of equation
7,
-Cov(z si,
T j )
+
Var(E)where Var(E) is the sampling variance due to finite sample size. Also by Taylor expansion,
Cov(X si, Tj) E(S).Var(Tj),
and
Var(z si)
=
[E(J)l2Var(Tj)+
E(Tj).u:+
C (10)where the final term,
C,
is a weighted function of the covariance of selection coefficients summed over all time intervals. Although C is unobservable, it is likely to be positive since it is a function of temporal auto- correlation of selective forces. Substituting dS(j)/dTj= -E(g/E(Tj) and dS(j)/dZ si = [E(Tj)]-' in equation 9 and rearranging,
U: N E(Tj). {Var[?(j)]
-
Var(E)-
[C/E(Tj)']].Since C is likely to be positive, an approximate upper bound to the variance of the selection coefficient is
3
E(Tj)-(Var[d(j)]-
Var(E)]. (1 1)of the Taylor expansion. CHARLESWORTH (1984) pre- sents a similar derivation for the analysis of fluctuating phenotypic selection from paleontological informa- tion.
From equation 6 the sampling variance for S ( j ) is
Var(E,)
=
[Var@)+
Var(E,)]/T~.Since Var(Et,)
the sample size at time t,, it follows that
p 5 ( l
-
pt,).(d&,/dp,)2/Nt, where Nt, iswhere
p ,
andp i
are the observed genotype frequen- cies at time tJ and t;. T h e mean of the k estimates of Var(E,) may be used as an estimator for Var(E) in equation 1 1 .Since the exact solution given by equation 3 is obtained under the assumption that the s, are inde- pendently distributed, it is of some interest to know whether there is any temporal correlation of selection forces operating on genotypes. As noted above, any autocorrelation that exists within the smallest sam- pling interval T, will be undetectable. Thus, only a very rough indication of autocorrelation can be ob- tained by regressing S ( j ) on S ( j
-
2), S ( j-
3), and soforth. Unfortunately, temporally adjacent estimates of the selection coefficient, which might be most influ- enced by common environmental forces, are also of limited use here. Because contiguous estimates of S ( j ) are based on a common estimate of the genotype frequency, they will naturally tend to be negatively correlated. If, for example, the s, are actually mutually independent with expectation zero, then Cov[S(j
-
l ) ,S(j)] = E[S(j
-
l)-S(j)] = -Var(E).E(l/T,-lT,). T h e expected correlation coefficient is then~ [ . ? ( j
-
l ) , S ( j ) ] = -E(l/T,-IT,)/2E(l/T,). (13)Thus, while negative estimates of r[S(j
-
l), S ( j ) ] are uninformative, significantly positive values can be taken as strong evidence for positive autocorrelation of selection coefficients.Data on between-year changes in genotype frequen- cies that can be applied to the sexual, monoecious model are still rather limited. For the one intermittent pond for which sufficient data were available, all of the data within years were pooled to obtain the annual genotype frequencies. T h e equation for estimating s (not to be confused with the instantaneous parameter for the clonal model) in the case of alleles with additive effects follows from a rearrangement of equation 5:
RESULTS
T h e most extensive data set available for the anal- ysis of clonal selection is that for the PGM polymor- phism in the cyclically parthenogenetic Daphnia Pulex
population found in Busey Pond, Urbana, Illinois (referred to as Group C in LYNCH [1983, 1984a1).
This diallelic locus has been continuously monitored from 1978 to 1985 (Figure l ) , with samples being taken at two sites in 1984. Thus, by use of equations 8 and 1 1 , nine independent estimates of S and 2; are obtainable for each of the three genotypes. A diallelic polymorphism at a peptidase ( P E P ) locus in the pop- ulation (LYNCH 1984a) has also been monitored since
1980, yielding seven estimates for d and
G;
for each of its three genotypes. Similar long-term data are available for several loci in Daphnia obtusa populations inhabiting Busey Pond and Trelease Center Pond, Urbana, Illinois.T h e data from these three populations are summa- rized in Table 1 . There seems little doubt that selec- tion operates on the monitored loci at least periodi- cally during phases of clonal growth. Taking
I
S ( j ) I>
2 d m a sthe criterion for significance at the 0.05 level, then between 1 1 and 30% of the individual genotypic selection coefficients within populations and loci were significantly different from zero. On the other hand, only four of the 112 annual estimates of S from these three studies were significantly different from zero. Since this is approximately the number of significant estimates expected to arise by chance, it appears that fluctuations in selection intensities within a year tend to cancel each other, rendering the mean selection coefficients very close to zero.Absolute values of the mean genotypic selection coefficients (S) averaged over the entire study range from 0.0014 to 0.0200 day-' (Table 1). Of the 20 pooled estimates obtained in this way, two are barely significant by the above criterion. Again, since this is only one more than expected by chance, the evidence for the operation of long-term directional selection on single locus genotypes during periods of clonal growth in these populations is weak. * *
Because of the non-normality of the distributions of individual (annual) estimates of
G:,
specific levels of confidence cannot be attached to the pooled meas- ures. However, the fact that 67% (61 of 91) of the._..&...I
...
A... ....
I
.o
.6
.2
1.0 I
.o
.6
.2 .6
Ln
W
C
'3 .2
1.0 1.0
E
Q) .6 .6
a
.2
LL
>r
C W
.2
-
*--a--+
___---
---o--,...A.. ... '..~...".""'...
M A M J J A S O M A M J J A S O
FIGURE 1 .-Temporal changes in genotype frequencies at the PGM locus in a cyclically parthenogenetic population of D. Pulex, Busey Pond, Illinois. Stippled areas denote periods during which the pond was dry. Data up to 1982 are reported in LYNCH (1984a).
TABLE 1
Summary statistics for the mean (i) and maximum variance (2:) of genotypic selection coefficients during phases of clonal growth of cyclically parthenogenetic Daphnia Pulex
~
Species Site Locus Genotype N n
D. Pulex Busey Pond PGM FF 55 919
FM 57 919
MM 58 919
PEP M M 40 615
MS 39 717
ss 31 717
D. obtusa Busey Pond
+0.0014 f 0.0055 -0.0033 f 0.0067 -0.0007 f 0.0046 +0.0036 f 0.0092 -0.0056 f 0.0095 +0.0025 f 0.0057
0.0206 f 0.0307 0 0 4
0.0326f0.0382 13 0 3
0.0386f0.0355 18 0 1
0.0049f0.0120 3 0 0
0.0094f0.0135 4 0 2
0.0699 f 0.0762 6 1 2
PGM FF 1 1 513 +0.0059 f 0.0181 0.0187 f0.0319 0 0 1
M M 1 1 513 +0.0043+0.0164 0.0206f0.0218 3 0 0
PGI MM 12 5/3 +0.0159+0.0145* 0.0761 20.0790 1 0 0
MS 13 515 +0.0149f0.0316 0.0196f0.0368 1 0 2
GOT M M 10 512 +0.0131 kO.0341 0.0015-+0.0056 2 1 1
FM 1 1 513 -0.0141 f0.0133* 0.0342f0.0796 3 0 1
ss 13 515 -0.0199f 0.0322 0.0395 fO.0633 2 1 2
MS 10 512 -0.0044+0.0375 0.0151 fO.0151 5 0 0
ss
10 512 -0.0200f0.0340 0.0234f0.0603 2 0 0D. obtusa Trelease Center Pond PGI MM 16 515 +0.0058 f 0.01 12 0.0214 f 0.0205 2 0 1
MS 16 515 -0.0058f0.0112 0.0212f0.0174 2 0 1
MS 10 413 -0.0065f0.0381 0.0500k0.1268 2 1 1
ss
10 413 +0.0075f0.0414 0.1715f0.1771 3 0 0GOT MM 4 211 +0.0016 f 0.0748 0.0914 1 0 0
Estimates are derived from continuous monitoring programs extending over several years (M. LYNCH [ 1983, 1984al and unpublished data). N is the number of individual estimates of j(j). n is the number of annual estimates for S and 2:. N * and n* refer respectively to the number of significant individual and pooled annual estimates of S. n(-2:) is the number of annual estimates of 2: that were negative.
.
662 M. Lynch
’“
1
PGM-MMI
U )
c 0
0
Ql
.-
e2
Selection Coefficient
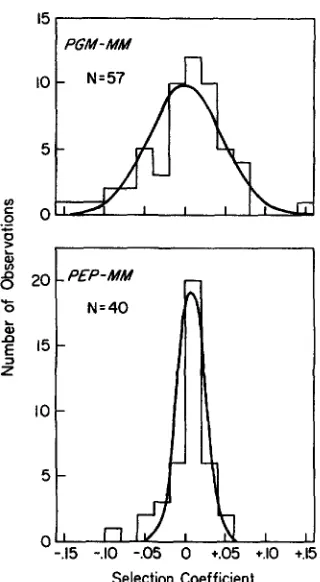
FIGURE 2.-Frequency distributions for individual estimates of
S ( j ) for the PGM-MM and PEP-MM genotypes for the cyclically parthenogenetic D. Pulex population in Busey Pond. Fitted normal
distributions are based on the estimates of S and U: given in Table
1 .
tion intensities on genotypes. In no case were selection coefficients for adjacent intervals significantly posi- tively correlated; as a group, they were distributed slightly above the expectation of equation 13 with a mean deviation of 0.12 (SE = 0.05) for the Busey populations. Of correlations that could be computed for greater sampling intervals, 5 of 106 (summed over both loci and populations) were significant. This is approximately what would be expected to arise by chance.
In summary, the available information on electro- phoretic loci in the Busey Pond and Trelease Center Pond populations suggests that the genotypes are quasi-neutral during periods of clonal growth. That is, although selection does periodically (perhaps al- ways) operate on the genotypes, it fluctuates fre- quently enough in both direction and intensity that mean selection intensities are approximately zero. As shown with two examples in Figure 2, the distributions of genotypic selection coefficients tend to normality.
Several additional estimates of 5 and
G
:
for clonally reproducing cladocerans can be derived from data in the literature (Table 2). T h e English populations ofDaphnia magna are of particular interest. Hebert (1 974a,b,c) has argued that the influence of selection on genotype frequencies is much less pronounced in
intermittent than in permanent populations where it tends to favor heterozygotes. This argument appears to stand up statistically at least in part. None of the nine estimates of S for HEBERT’S intermittent popula- tions were significantly different from zero, whereas nine of 26 and nine of 31 were significant for the permanent populations studied by HEBERT and by
YOUNG (1979a,b). Only two of 63 individual d(j) esti- mates were significant in HEBERT’S intermittent pop- ulations, while 28% (136 of 479) and 24% (131 of 553) were significant in HEBERT and in YOUNG’S per- manent populations. Excluding one large value, all of the estimates of g: for HEBERT’S intermittent popula- tions were very close to zero with a mean ( f 2 SE) of -0.00 18 f 0.0039. Combined with the observation of insignificant J, this suggests that selection was essen- tially inoperable on the loci observed in HEBERT’S intermittent populations. On the other hand,
G:
k 2SE for the permanent populations of HEBERT (0.0 105 f 0.0052) and YOUNG (0.0214 f 0.0183) are more in line with those reported above for intermittent pop- ulations of D . Pulex and D. obtusa.
HEBERT’S data do not provide very strong evidence for heterosis. Of the three comparisons that can be made for S of three genotypes (e.g., FF, FM, M M ) in intermittent populations, the heterozygote has the lowest fitness in two cases, and in one case it is inter- mediate (Table 2). For his permanent ponds, two cases of heterozygote superiority appear (one of which is significant), but there are also three cases in which the heterozygote has minimum fitness (two of which are significant) and one case of intermediate heterozygote fitness. On the other hand, an analysis of YOUNG’S
data reveals five cases of heterozygote superiority (four of which are significant), and only one case of heterozygote intermediacy.
Data for two permanent lake populations of Daphnia (MORT and WOLF 1985) are consistent with an interpretation of continously weak selection on individual loci, and therefore depart radically from the situation in permanent pond D . magna popula- tions. None of 13 estimates of d and only 42 of 325 estimates of S ( j ) are significant for the Schohsee
Daphnia cucullata population, and the average value of g: (0.0051 f 0.0036) is relatively low (Table 2). An analysis of the data for the Lake Morey population of
Daphnia galeata mendotae reveals four of 34 estimates of S ( j ) and none of S to be significantly different from zero; all of the estimates of Var[J(j)] were less than the expected sampling variance, thereby yielding a negative mean
C
:
(-0.0074 f 0.0088). Thus, similar to the situation in intermittent D. magna populations, isozyme loci for which data are available in permanent lake populations of Daphnia appear to be nearly neu- tral.TABLE 2
Summary statistics for selection coefficient estimates for singlelocus genotypes of cladocerans during periods of clonal growth
Geno-
Species Site Locus type N j k 2 S E 5; N* Reference
INTERMITTENT POPULATIONS:
Daphnia magna Landbeach MDH
Longstowe Field- 1 MDH
Upware-1 EST-I
PERMANENT POPULATIONS:
Daphnia cucullata Schohsee PGM
PGI
Daphnia galeata mendotae Morey ALK-2
GOT
Daphnia magna Harlton MDH
Longstowe MDH
Hatley Hill MDH
Longstowe Field-2
Moulton MDH
ALK-2
Audley End MDH
EST-I MM MS ss MM MS ss FF FM MM FF FS ss FW
ww
MM MXxx
ss SYw
s-z zz FS ss FS ss FF FM MM MM MS FM MM MM MS ss FF FM MM FF FM MM FF FM FF FXxx
MM MYw
sz zz 5 5 5 5 5 5 11 11 11 25 25 25 25 25 25 25 25 25 25 25 25 25 5 5 12 12 25 25 19 5 5 6 6 10 10 10 10 10 10 10 10 10 29 29 30 30 30 30 30 30 30 30+0.0052 f 0.0055 +0.0048 f 0.0091 -0.0106 f 0.0256
+0.0022 f 0.0072
+0.0005 f 0.0023
+0.0055 f 0.0106 -0.0010 f 0.0087 +0.0006 f 0.0034 -0,001 3 f 0.0029
+0.0016 f 0.0122 +0.0008 f 0.0031 -0.0039 f 0.0148
+0.0002 f 0.0219 +0.0023 f 0.0205 -0.0006 f 0.0291 -0.0013 f 0.0159 +0.0013 f 0.0117 +0.0029 f 0.01 15 -0.0011 f 0.0137 -0.0040 f 0.0165 -0.0034 f 0.0195 0.0034 f 0.0188
+0.0087 f 0.0270 -0.0099 f 0.0279
+0.0008 f 0.0048 -0.0008 f 0.0048
+0.0041 f 0.0047 -0.0024 f 0.0045 -0.0064
*
0.0068-0.0020 f 0.0249 +0.0020 f 0.0249
-0.0064 f 0.0095 +0.0064 f 0.0095
+0.0005 f 0.0040 -0.0005 f 0.0018 +0.0002 f 0.0040 -0.0042 f 0.0161 +0.0059 f 0.0098 -0.0064 f 0.0181
-0.0059 f 0.0058* +0.0052 f 0.00461 -0.0037 f 0.0056
-0.0043 f 0.0055 +0.0043 f 0.0055 +0.0063 f 0.0017* -0.0060 -C 0.0020* +0.0008 f 0.0017 -0.0019 f 0.0018* -0.0051 f 0.0018* +0.0057 f 0.0014* +0.0006 f 0.0003* -0.0006 f 0.0003*
-0.0050 -0.0070 0.1005 -0.0015 -0.0042 0.0022 -0.0009 0.0018 -0.0001 0.0021 -0.0003 0.0003 0.0050 0.0012 0.0133 0.0100 0.0002 0.00 18 0.0040 -0.0030 0.0163 0.0150 -0.0001 -0.0016
-0.0 139 -0.0139 0.0030 0.0027 -0.0095 0.0325 0.0325 0.0061 0.0061
-0.00 13 -0.0020 -0.0016 0.0093 0.0034 0.0252 -0.0075 -0.0034 -0.0060 0.0234 0.0234
0.01 14
0.0245 0.0226 0.0316 0.0182 0.0063 0.01 11 0.01 11
0 HEBERT (1974~) 0 1 0 0 0 1 0 0
4 MORT and WOLF (1985) 2 0 1 2 5 2 2 0 4 4 5 5 1 1 0 2
8 HEBERT (1974a) 6
2
4 HEBERT (1974b) 4 3 3 0 0 0 1 2 2 0 0 0 4 4 13 12 14 10 11 11 11 11
664 M. Lynch
TABLE Z-Gmtinued
Summary statistics for selection coefficient estimates for single-locus genotypes of cladocerans during periods of clonal growth
Species
Geno-
Site Locus type N j k 2 S E z: N * Reference
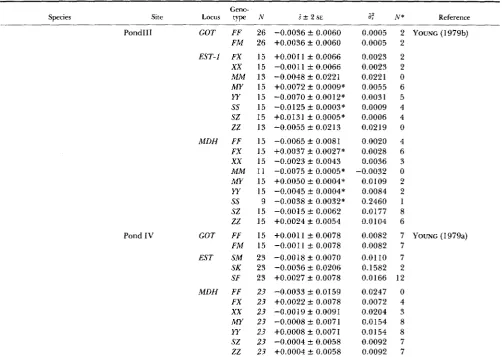
Pond111 GOT FF 26
FM 26
EST-I FX 15
XX 15
M M 13
M Y 15 W 15
SS 15 SZ 15 ZZ 13
M D H FF 15
FX 15
XX 15
M M 11
M Y 15
W 15
ss 9
SZ 15 ZZ 15
GOT FF 15
FM 15 EST SM 23
SK 23
SF 23
M D H FF 23
FX 23
XX 23
MY 23 YY 23 SZ 23
zz 23 Pond IV
-0.0036 f 0.0060 +0.0036 f 0.0060
+0.0011 f 0.0066 -0.001 1 f 0.0066 -0.0048 f 0.0221 +0.0072 +. 0.0009* -0.0070 f 0.0012* -0.0125 f 0.0003*
+0.0131 f 0.0005* -0.0055 f 0.0213
-0.0065 f 0.0081 +0.0037 f 0.0027* -0.0023 f 0.0043 -0.0075 f 0.0005* +0.0050 f 0.0004* -0.0045 f 0.0004* -0.0038 f 0.0032* -0.0015 f 0.0062 +0.0024 f 0.0054
+0.0011 f 0.0078 -0.001 1 f 0.0078 -0.0018 +- 0.0070 -0.0036 f 0.0206 +0.0027 +- 0.0078
-0.0033 k 0.0159 +0.0022 +- 0.0078 -0.0019 f 0.0091 -0.0008 k 0.0071 +0.0008 +- 0.0071 -0.0004 +. 0.0058 +0.0004 +- 0.0058
0.0005 0.0005 0.0023 0.0023 0.0221 0.0055 0.0031 0.0009 0.0006 0.0219 0.0020 0.0028 0.0036 -0.0032 0.0109 0.0084 0.2460 0.0177 0.0104 0.0082 0.0082 0.01 10 0.1582 0.0 166 0.0247 0.0072 0.0204 0.0 154 0.0154 0.0092 0.0092
2 YOUNG (1979b) 2 2 2 0 6 5 4 4 0 4 6 3 0 2 2 1 8 6
7 YOUNG (1 979a) 7 7 2 12 0 4 3 8 8 7 7
Symbols as in Table 1. F, M and S refer to particular alleles, whereas, W , X , Y and Z contain more than one allele. For example, F W refers to all heterozygotes conditional on having a single F allele.
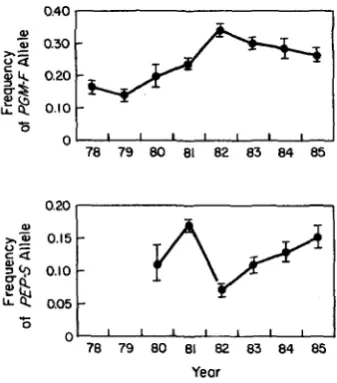
enough for an analysis of selection operating between sexual generations. As can be seen in Figure 3, signif- icant changes in gene frequencies have occurred over the 8-yr period. These changes appear to be attribut- able to selection rather than genetic drift. I used the algorithm of MUELLER et al. (1 985) to test this hypoth- esis. Following an input of the annual effective popu- lation sizes, annual sample sizes, and initial gene fre- quency, their program generates estimates of the var- iance in gene frequency between years expected to result from drift and sampling error. By iterating this procedure many times, an empirical distribution of the variance is obtained, and the hypothesis of selec- tion is evaluated by considering the probability that the observed variance could have been generated by drift and sampling error alone. Table 3 illustrates that the effective population size of the Busey Pond pop- ulation would have to be on the order of 100 for there to be an appreciable chance of the observed annual changes in gene frequency at the PGM and
PEP loci arising by genetic drift and sampling error.
Essentially the same conclusion was reached earlier by use of the diffusion approximation (LYNCH 1984a). As discussed in LYNCH (1984a) such low effective population sizes are unreasonable for this population. On the contrary, upon application of equations 14
and 15, 4 of the 8 selection coefficients estimated for the PGM locus, and 3 of the 5 for the PEP locus appear to be statistically significant (Table 4).
DISCUSSION
0.40 I 1
= U
078 79 80 81 82 83 84 85
z u
078 79 80 E1 82 83 84 85
Year
FIGURE 3.-Average annual gene frequencies for two loci in the cyclically parthenogenetic D. pulex population from Busey Pond. Vertical bars denote f 2 SE. Only data from the main site are illustrated here.
TABLE 3
Comparison of the observed variance in annual gene frequencies in Busey Pond D. pules with that expected to result
from random drift and sampling error
Var(p)
Locus N. Observed Expected P
PGM 50 0,0052 0.00 18 0.046
75 0.001 2 0.014
150 0.0005 co.001
PEP 50 0,001 2 0.0009 0.204
75 0.0006 0.091
150 0.0003 0.017
Effective population sizes are assumed to be 50, 75 or 100. P is the probability that a value of Var(p) equal to or greater than that observed would arise under a neutral hypothesis and was estimated by iterating the algorithm of MUELLER et al. (1985) 1000 times.
variances of selection coefficients (Z:) between geno- types have been revealed, although the confidence in such a conclusion cannot be very strong since each mean estimate is based on only a few annual estimates. When averaged over genotypes and loci, the esti- mates of
2;
range from about 0 for intermittentD.
magna populations to 0.002 for large lake Daphnia
(D.
cucullata and D. galeata mendotae) to 0.016 for D.magna populations in permanent ponds to 0.035 for intermittent populations of
D.
pulex andD.
obtusa.Since these estimates are approximate upper limits to the variance of the genotypic selection coefficient, it seems very unlikely that a, will ever greatly exceed -0.2. By substituting this value and S = 0 into equa- tions 4a and 4b, upper limits to the probabilities of quasi-fixation (p
>
0.99) and quasi-loss (P<
0.01) of genotypes are generated as a function of time (Figure4). These probabilities refer to uninterrupted periods of clonal growth and assume an effectively infinite
population size. In the extreme case of a, =
0.2,
it can be seen that the probability of quasi-fixation of a genotype with initial frequency 0.5 reaches 0.1 within a year and 0.4 within 10 yr. Slightly higher and lower figures are obtained for starting frequencies of 0.75 and 0.25, respectively. On the other hand, if a, =0.05, a figure more in line with the results for inter- mittent D. magna and permanent
D.
cucullata andD.
galeata mendotae populations, there is essentially no chance that alleles with starting frequencies 0.25-0.75
TABLE 4
Annual selection coefficients for the Busey Pond D. puZex population treated as a sexual, monoecious population
Selection Coefficient f SE
Year PGM-M PEP-M
1978 +0.213 f 0.284 1979 -0.356 f 0.203
1980 -0.213 f 0.189 -0.960 f 0.035 1981 -0.431 2 0.086
+
1.ooo
*
0.299 1982 +0.189 f 0.133 -0.376 f 0.141 -0.162 f 0.235 1983 +0.064 k 0.1631984 +0.113 k 0.186 -0.200
*
0.235Estimates obtained with equations 14 and 15.
us = 0.05 us = 0.20
Days of Uninterrupted Clonal Reproduction
will be quasi-fixed or lost within a 3-yr period of continuous clonal propagation.
These theoretical predictions are qualitatively con- sistent with observations on the distributions of gen- otype frequencies in natural populations of Daphnia. Permanent pond
D.
magna populations, which are suspected of surviving for several years with little or no recruitment from sexually produced resting eggs, have relatively high values of2:.
It is not uncom- mon for expected genotypes for polymorphic loci to be completely absent from these populations or for genotypes to proceed to quasi-fixation or quasi-loss during a 2-3-year period (HEBERT 1974b,c,d; YOUNG 1979a,b). Moreover, HEBERT (1 974d) has docu- mented dramatic differences in gene and genotype frequencies between populations separated by as little as a few meters. On the other hand, while the large permanent lake populations ofD.
cucullata andD.
galeata galeata examined by MORT and WOLF (1985, 1986) show few signs of sexual activity, they exhibit a remarkable degree of temporal stability of genotype frequencies within as well as between years, and all possible genotypes are generally present at poly- morphic loci. As noted above, the maximum estimates of U, for these populations are very small (-0.04). It is therefore of interest that, contrary to the situation in
D.
magna, populations ofD.
galeata galeata sepa- rated by several kilometers generally have nearly iden- tical genotype distributions (MORT and WOLF 1986). Finally, while intermittentD.
Pulex andD.
obtusapopulations have the highest observed estimates of
a :
, the opportunity for quasi-fixation or loss via fluc- tuating clonal selection is limited (and not observed). In these cases, because the ponds generally contain water for no more than a few months at a time, periods of continuous clonal reproduction last for no more than 5-1 0 generations.
Let us now consider the potential consequences of fluctuations in selection intensities between years for populations with an annual phase of sexual reproduc- tion. T h e only data bearing on this are contained in Table 3. T h e mean annual selection coefficients (&2
SE) for the PGM-M and PEP-M alleles, -0.1 1 f. 0.20 and -0.14
+
0.7 1, are not significantly different from zero. The variance in s d u e to annual environmental changes can be determined by subtracting the mean of the sampling variances from the variance of the sestimates. This procedure yields estimates (+2 SE) of 0.05 f 0.06 and 0.50 f 0.71 for the PGM-M and
PEP-M alleles. T h e standard errors of these measures are approximate, having been obtained by use of 2(Var)*/(N
-
1) as an estimator of the sampling vari- ance of a variance, but they indicate that several years of data with sample sizes 2 1000 may often be inade- quate to reveal statistically significant variance in se- lection coefficients.a:=0.05 2 0.50
1.0 7, 1.0 7,
i
0 2
+ n"
0 x) 40 60 80 100 0 20 40 60 80 IC0
40 60 80%0 0 20 40 60 80 100 Years
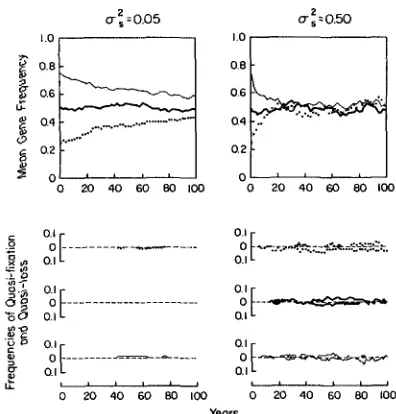
FIGURE 5.-Expected gene frequencies as a function of time for quasi-neutral loci (S = 0) at two levels of selection variance, starting with populations with initial gene frequency 0.25 (.
. . .
.), 0.50(-), and 0.75 (-), and using the sexual, monoecious model, equation 5. Each of the three cases is the mean of 100 independent populations with the selection coeficient being treated as a normally distributed random variable. In the lower panels, the frequencies of populations that are quasi-fixed (gene frequency >0.99) and quasi-lost (gene frequency <O.O 1) are given above and below the dashed lines.
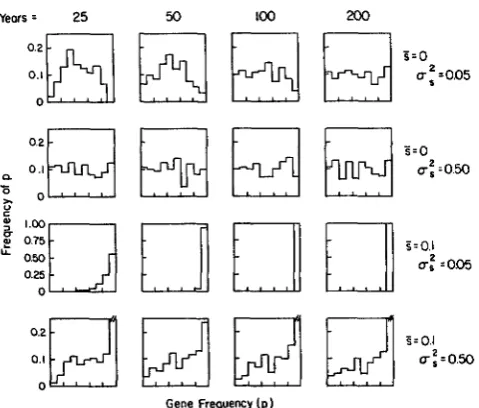
Of course, it is unrealistic to expect there to be no between-year variation in selection pressures in natu- ral populations. For heuristic purposes, let us suppose that S = 0 but that the var;ance in s between years is of the magnitude observed above (0.05 or 0.50). The consequences of fluctuating selection can then be re- solved by iteration of equation 5, treating s as a normally distributed random variable. It is shown in Figure 5 that, regardless of starting gene frequencies and the variance of s, the expected gene frequency converges on P = 0.5 when 3 = 0. The rate of convergence increases with the variance of s, but so does the variance in gene frequency between popula- tions. This results in higher probabilities of quasi- fixation and quasi-loss in more variable situations. An interesting feature of the case of quasi-neutrality (S = 0) is that the gene frequency distribution between populations asymptotically approaches a uniform dis- tribution (HARTL and COOK 1976). With a: = 0.50, the uniform distribution is attained in a very short period (<25 yr), and even with U: as small as 0.05, a
substantial flattening of the distribution is observed within 25 yr (Figure 6).
in
Years = 25 100 200
I=O.I
U = 0.50
Gene Frequency (p)
FIGURE B.-Temporal change in the gene frequency distribu-
tion for four different combinations of S and U: for the sexual,
monoecious model, equation 5. In each case 200 populations were initiated with gene frequency p = 0.5 and their annual selection coefficients were generated by treating s as a random, normally distributed variable with the appropriate S and U:.
tween gene frequency behavior for neutral loci in finite populations and loci exposed to fluctuating se- lection in effectively infinite populations. In the for- mer case a lost allele can only become re-established through immigration or mutation, while in the latter case quasi-loss need not be permanent. Following sev- eral years of favorable selection, a quasi-lost allele may increase to an observable level and may even go on to become quasi-fixed.
Now consider the situation that would arise if the estimates of both S and U: reported above were cor- rect. For both loci (M alleles), let S = -0.1. Recall from above that thecriterion for local fixation of the M allele is -S
+
%s2<
0 and that for fixation of the opposite allele is S+
I/q?<
0. For the PGM locus, s2= 0.065, implying that the F allele
will ultimately be lost. For the PEP locus, however, s2 is quite large (0.426) and the criterion for local fixation is violated for both alleles. For this locus, therefore, the existence of a stochastically stable polymorphism is predicted provided the true S and U? are approximately -0.1and 0.5.
Figures 6 and
7
graphically portray the conse- quences of variable selection on the distribution of a gene frequency when S = 0.1. When02
= 0.05, as at the PGM locus, all populations asymptotically ap- proach fixation regardless of their initial gene fre- quencies, but the expected time to fixation will be >50 years if the initial frequency of the favored allele is very low. On the other hand, when 0: = 0.50, themean population gene frequency will essentially reach the equilibrium of -0.65 within 25
yr.
However, theuf.0.05 ut -0.50
1.0 -
oa
-
a4
--
0.2 *
Years
FIGURE 7.-Expected gene frequencies as a function of time for alleles with j = 0.1 at two levels of selection variance, starting with populations with initial gene frequency 0.25 ( e +
.
.), 0.50 (-),and 0.75 (-), and using the sexual, monoecious model, equation 5. Each of the three cases is the mean of 100 independent popula- tions with the selection coefficient being treated as a normally distributed random variable. In the lower panels, the frequencies
of populations that are quasi-fixed (gene frequency >0.99) and quasi-lost (gene frequency <0.01) are given above and below the dashed lines.
dispersion of gene frequencies between populations will be very great. A significant fraction (-5-10%) of the populations are expected to be quasi-fixed for the favored allele, and a very small fraction (- 1
W )
quasi- fixed for the unfavored allele. The overall distribution of gene frequencies at such a locus is expected to be bimodal, a pattern which is revealed within -25 gen- erations starting from a mixture of populations with identical frequencies (Figure 6).These results help resolve the somewhat paradoxi- cal observations of HEBERT (1974d) and MORT and WOLF (1985, 1986). HEBERT (1974d) invoked the founder effect to explain the dramatic differences in gene frequencies between D. magna populations in ponds that are in very close proximity and similar in ecological features. As HEBERT (1 974d) acknowl- edges, however, one of the difficulties in accepting the founder effect hypothesis is the fact that the likelihood of ephippial transport between these ponds is exceptionally high owing to frequent visits by sheep and cattle. Moreover, if gene flow is assumed to be nearly absent in D. magna, which in intermittent ponds often produce massive numbers of ephippia, it be- comes extremely difficult to reconcile the homoge- neity of gene frequencies among distant D. galeata
M.
pearance of new alleles in populations over 1-3-yr periods to be further evidence against gene flow in D.
magna. This appears to ignore the fact that, in a Daphnia population, a newly introduced allele will typically have an initial frequency of or lower. Even with a constant and fairly substantial selective advantage, it would take several years for such an allele to attain detectable levels. As noted above and in LYNCH (1984a), large and constant selection differ- entials on alleles are not commonly observed in Daphnia.
Having concluded that gene flow among popula- tions of
D.
magna is extremely limited, HEBERT(1974d) was left with an additional paradox: an ex- traordinary degree of phenotypic uniformity of the species thoughout both Europe and North America. His solution that
". . .
local fragmentation of the gene pool may reduce the directional response to selection gradients, because individual populations will respond to similar selection pressures in differing ways,. . ."
appears to be more consistent with phenotypic diver- sity than phenotypic uniformity. If, however, the local divergence of gene frequencies is primarily a function of fluctuating selection, rather than the founder effect or random drift, the relative phenotypic uniformity of the species can be reconciled. Selection coefficients of the magnitude reported in this paper are fully consistent with the operation of strong stabilizing (or directional) selection at the phenotypic level (HAL-DANE 1930; KIMURA and CROW 1978; LYNCH 1984b). Their fluctuations can therefore be accounted for by periodic, constrained changes in the phenotypic selec- tion function.
T h e message of this study is that neither restricted gene flow nor divergent selection are essential condi- tions for the local diversification of gene frequencies. As noted in the introduction, this point has long been appreciated by theoreticians, but it does not yet ap- pear to have attained its proper status in the interpre- tation of field data. T h e previous analyses certainly do not rule out the long-term importance of gene flow and random drift in the ecological genetics of Daphnia. It is now clear, however, that an equally, if not more, compatible explanation for the existing data is that the observed levels of between-population var- iance in gene frequencies are primarily a result of random fluctuations in selection intensity.
T h e actual rate of differentiation of gene frequen- cies between populations will ultimately depend on the correlation of temporal sequences of selection coefficients in isolated populations, an issue that can- not be addressed with the existing data. If fluctuating selection pressures were perfectly correlated in differ- ent populations, then the gene frequency of each population would follow an identical time course, and divergence would not occur. However, such correla- tion seems rather unlikely even in adjacent popula-
Mdh
1.00
LT
om
0.25
0
o a4 0.e o
Q
0.4 0.e o 0.4 0.0Gene Frequency (p)
FIGURE 8.-The distributions of gene frequencies for three al- leles at the MDH and EST-l loci among 25 Cambridge populations of D. magna (from Table 1) (HEBERT 1974d).
tions, particularly if the selection is largely influenced by the chance development of linkage disequilibrium. T h e fact that gene frequency distributions of the sort observed by HEBERT (1974d) (Figure 8) can develop in only a few years when spatial autocorrelation is negligible (Figures 5-7) indicates that fluctuating se- lection should not be ignored as a potentially powerful force in the local diversification of gene frequencies.
This work was supported by National Science Foundation grant DEB 79-1 1562. I am extremely grateful to L. MUELLER for provid- ing me with a copy of his computer program for testing the hypothesis of random drift. I am also very appreciative to J. GIL-
LESPIE, M. MORT, M. TURELLI and H. WOLF for helpful comments, to R. SMOGOR, K. SPITZE and L. WEIDER for performing much of the field work, and to J. Su for computational assistance.
LITERATURE CITED
CHARLESWORTH, B., 1984 Some quantitative methods for study- ing evolutionary patterns in single characters. Paleobiology 10:
COOK, R. D. and D. L. HARTL, 1975 Stochastic selection in large and small populations. Theor. Popul. Biol. 7: 55-63.
CROW, J. F. and M. KIMURA, 1970 An Introduction t o Population Genetics Theory. Harper & Row, New York.
FELSENSTEIN, J., 1976 The theoretical population genetics of var- iable selection and migration. Annu. Rev. Genet. 10: 253-280. FISHER, R. A. and E. B. FORD, 1947 The spread of a gene in
natural conditions in a colony of the moth Panaxia dominula L. Heredity 1: 143-174.
The effects of stochastic environments on allele frequencies. Theor. Popul. Biol. 3: 241-248.
Natural selection with varying selection coefficients-a haploid model. Genet. Res. 21: 115-120.
Polymorphism in random environments. Am. Nat. 108 145-151.
A general model to account for enzyme variation in natural populations. 11. Characterization of the fitness function. Am. Nat. 110: 809-821.
A general model to account for enzyme variation in natural populations. V. The SAS-CFF model. Theor. Popul. Biol. 1 4 1-45.
A general model to account for enzyme variation in natural populations. Genetics
7 6 837-848. 308-3 18.
GILLESPIE, J. H., 1972
GILLESPIE, J. H., 1973a
GILLESPIE, J. H., 1973b
GILLESPIE, J. H., 1976
GILLESPIE, J. H., 1978
669
HALDANE, J. B. S., 1930 A mathematical theory of natural and artificial selection. VII. Selection intensity as a function of mortality rate. Camb. Phil. Soc. Proc. 27: 131-136.
HARTL, D. L. and R. D. COOK, 1973 Balanced polymorphisms of quasi-neutral alleles. Theor. Popul. Biol. 4: 163-1 72. HARTL, D. L., and R. D. COOK, 1976 Stochastic selection and the
maintenance of genetic variation. pp. 593-616. In: Population Genetics and Ecology, Edited by S. KARLIN and E. NEVO. Aca- demic Press, New York.
HEBERT, P. D. N., 1974a Enzyme variability in natural popula- tions of Daphnia magna. I. Population structure in East Anglia. Evolution 2 8 546-556.
HEBERT, P. D. N., 197413 Enzyme variability in natural popula- tions of Daphnia magna. 11. Genotypic frequencies in perma- nent populations. Genetics 77: 323-334.
HEBERT, P. D. N., 1974c Enzyme variability in natural populations of Daphnia magna. 111. Genotypic frequencies in intermittent populations. Genetics 77: 335-341.
HEBERT, P. D. N., 1974d Ecological differences between geno- types in a natural population of Daphnia magna. Heredity 33: 327-337.
HEDRICK, P. W., M. E. GINEVAN and E. P. EWING, 1976 Genetic polymorphism in heterogeneous environments. Annu. Rev.
Random selective advantages of genes and their probabilities of fixation. Genet. Res. 21: 215-219.
Random temporal variation in selection intensities: case of large population size. Theor. Popul. Biol. 6 355-382.
Process leading to quasi-fixation of genes in natural populations due to random fluctuations of selection intensities. Genetics 39: 280-295.
Solution of a process of random genetic drift with a continuous model. Proc. Natl. Acad. Sci. USA 41: 144-
150.
KIMURA, M., 1982 The Neutral Theory of Molecular Evolution. Cambridge University Press, New York.
KIMURA, M. and J. F. CROW, 1978 Effect of overall phenotypic selection on genetic change at individual loci. Proc. Natl. Acad. Sci. USA. 75: 6168-6171.
LYNCH, M., 1983 Ecological genetics of Daphnia Pulex. Evolution 37: 358-374.
LYNCH, M., 1984a The genetic structure of a cyclical partheno- gen. Evolution 38: 186-203.
EcoI. Syst. 7: 1-32. JENSEN, L., 1973
KARLIN, S. and U. LIEBERMAN, 1974
KIMURA, M., 1954
KIMURA, M., 1955
LYNCH, M., 1984b The selective value of alleles underlying poly- genic traits. Genetics 108: 1021-1033.
MATSUDA, H. and T. GOJOBORI, 1979 Protein polymorphism and fluctuation of environments. Adv. Biophys. 12: 53-99. MORT, M. A. and H. G. WOLF, 1985 Enzyme variability in large-
lake Daphnia populations. Heredity 5 5 27-36.
MORT, M. A. and H. G. WOLF, 1986 The genetic structure of large-lake Daphnia populations. Evolution 4 0 756-766. MUELLER, L. D., L. G. BARR and F. J. AYALA, 1985 Natural
selection vs. random drift: evidence from temporal variation in allele frequencies in nature. Genetics 111: 517-554.
MUELLER, L. D., B. A. WILCOX, P. R. EHRLICH, D. G. HECKEL and D. D. MURPHY, 1985 A direct assessment of the role of genetic drift in determining allele frequency variation in pop- ulations of EuphydTas editha. Genetics 1 1 0 495-5 1 1. NEI, M., 1980 Stochastic theory of population genetics and evo-
lution. Lect. Notes Biomath. 3 9 17-47.
NEI, M. and D. GRAUR, 1984 Extent of protein polymorphism and the neutral mutation theory. Evol. Biol. 17: 73-1 18. TAKAHATA, N., 1981 Genetic variability and rate of gene substi-
tution in a finite population under mutation and fluctuating selection. Genetics 9 8 427-440.
TAKAHATA, N. and M. KIMURA, 1979 Genetic variability main- tained in a finite population under mutation and autocorrelated selection intensity. Proc. Natl. Acad. Sci. USA 76: 5813-5817. TIER, C., 1981 An analysis of neutral-alleles and variable-environ-
ment diffusion models. J. Math. Biol. 12: 53-71.
TUCKWELL, H. C., 1976 The effects of random selection on gene frequency. Math. Biosci. 30: 113-128.
TURELLI, M., 1977 Random environments and stochastic calculus. Theor. Popul. Biol. 12: 140-178.
WRIGHT, S., 193 1 Evolution in Mendelian populations. Genetics
1 6 97-159.
WRIGHT, S. 1948 On the roles of directed and random changes in gene frequency in the genetics of populations. Evolution 2:
YOUNG, J. P. W., 1979a Enzyme polymorphism and cyclic par-
thenogenesis in Daphnia magna. I. Selection and clonal diver- sity. Genetics 92: 953-970.
YOUNG, J. P. W., 1979b Enzyme polymorphism and cyclic par- thenogenesis in Daphnia magna. 11. Heterosis following sexual reproduction. Genetics 92: 97 1-982.
279-294.