Volume 3, No. 7, Nov-Dec 2012
International Journal of Advanced Research in Computer Science
RESEARCH PAPER
Available Online at www.ijarcs.info
ISSN No. 0976-5697
Knowledge Mining and Trifle Management for Predicting Heart Disease
Mr.Bensujin*
Registrar, Department of Engineering Nizwa College of Technology, Nizwa , Oman
Dr.Kezi selva vijila
Principal, Christian College of Engineering & Technology Tamilnadu, India
Mrs.Cynthia Hubert
Research Scholar, Department of Electronics & Communication Karunya University Tamilnadu, India
Abstract: Heart Disease (HD) is the foremost cause of death worldwide; the World Health Organization(WHO) estimates that globally 17.3 million people died from Heart Disease in 2008, representing 30% of global deaths. The prediction of heart disease from various inputs and raw data is a multi-layered problem, which is not free from false assumptions. It is essential to extract the valuable information to spot the risk of heart disease. This papers details about an online expert system to identify the presence of heart disease in any human by the use of risk factors. The risk factors are the life style habits or the behavioural characteristics present in the analysis individual. The OES system calculates an OES scoring based on the risk factors and the decision is taken based on the score by the artificial neural networks. The risk factors and the inputs to the system is given in the form of trifles. The obtained input datas are pre-processed and clustered using K-means clustering algorithm. The fine tuned data set is converted into trifles and passed to the Artificial Neural Network(ANN) for the identification of heart disease. A Multi Layered feed forward network is used for the decision making and the Back Propogation(BP) algorithm is used to train the network and adjust the weight of the nodes in the neural network. The OES System enables significant knowledge, e.g. patterns, relationships between medical factors related to heart disease, to be established. OES is Web-based, user-friendly, scalable, reliable and expandable system and it consist of a simple database designed by the Microsoft tool and the system is implemented on the .NET platform using ASP.
Keywords: Trifles, Heart Disease, Back Propogation, risk factors, K-means clustering, WHO.
I. INTRODUCTION
Heart disease (HD) is a major root of morbidity and mortality in the modern society. Medical diagnosis is a vital but intricate task that should be done accurately and efficiently. Heart diseases are also termed as “cardiovascular diseases“, and they include diseases such as coronary heart disease, heart attack, high blood pressure, stroke, chest pain (also called “angina“), and rheumatic heart disease. Risk factors make a person more susceptible to get heart disease. Risk factors are traits or lifestyle habits that make a person more likely to develop a heart disease. Some risk factors for heart disease cannot be changed like older age or family history. Other risk factors can be changed or at least be modified. Literatures are established based on the risk factors by which the occurrence of heart disease can be predicted for an exact person. These risk factors are obtained from the clinical data’s, diagnosed data’s and from a huge number of research literatures. Risk assessment for determining the risk for HD development is carried out using OES risk scoring. The risk factors included in the OES calculation are: age, total cholesterol, HDL cholesterol, systolic blood pressure, treatment for hypertension, and cigarette smoking, Height & Weight, BMI, blood Sugar, eating habit.
The healthcare environment is still information rich‟ but knowledge poor”. There is a wealth of data available within the healthcare systems. However, there is a lack of effective
analysis tools to discover hidden relationships and trends in data. The OES system proves to be the best solution to make use of the information into a valuable yield.
The OES system specifically designed for predicting the heart disease is based on the above mentioned risk factors and if the system predicts the risk level is high for getting the disease the electro cardiogram (ECG)[1][2] data of that particular person can be made as input to the system, in a way the system diagnoses the ECG data and provides the type of heart disease and refer for further diagnosis. The system encompasses a few data mining techniques [3], a multilayered feed-forward network and trifles[4][5][6].
number of output nodes is represented as a range showing the disease classification. The most widely used neural-network learning method is the BP algorithm [3][11]. Learning in a neural network involves modifying the weights and biases of the network in order to minimize a cost function. The cost function always includes an error term a measure of how close the network's predictions are to the class labels for the examples in the training set. The activation function considered for each node in the network is the binary sigmoidal function defined (with s = 1) as output = 1/(1+e-x), where x is the sum of the weighted inputs to that particular node. This is a common function used in many BPN. This function limits the output of all nodes in the network to be between 0 and 1.
The OES System enables significant knowledge, e.g. patterns, relationships between medical factors related to heart disease, to be established. OES is Web-based, user-friendly, scalable, reliable and expandable system and it consists of a simple database designed by the Microsoft tool and the system is implemented on the .NET platform using ASP.
II. BACKGROUNDLITEREATUTUREREVIEW
A huge number of prediction algorithms and methodologies are proposed in different literatures which in a way motivated our work. In this section we discuss some of the related research literatures.
A new system Intelligent Heart Disease Prediction System (IHDPS) was proposed by Sellappan Palaniappan et al. [7]. The system was proved to be sturdy as it provides the healthier results and output the decision more accurately than any decision making system. The techniques used in IHDPS are the common techniques like Decision Trees, Naïve Bayes and Neural Network. The system also encompass patterns, relationships amid medical factors connected with heart disease. Anamika Gupta et al.[12] projected an effort that the medical data’s can be analyzed and clustered using the data mining techniques. In this system the medical diagnostic datas are retrieved and passed through a method of formal concept analysis. A model is proposed based on dataming techniques to classify the medical data’s. Basic classification rules and a redundancy algorithm is used which provides more strength to the system.
An effective and novel method of using the datas in the form of trifles was proposed by Bensujin et al. [5][6][9][10]. Soft computing models are used to classify the trifles and for decision making. The system leads to a novel idea of trifles, more technically termed as interactive xml(i-xml). All input datas are converted in the form of trifles and this trifles are given as the input to the system. The trifles are effective to accept the datas of any type. Powerful searching methods and neural networks are implemented in the system. Another novel approach implemented by Bensujin et al. [9] the neural network makes the decision according to the training given and if the accuracy of the decision is not more than 0.7 means the system generates a new hypothesis and train the network accordingly. Using neural networks Niti Guru et al. [13] gave a prototype for predicting the heart disease, blood pressure and sugar. 13 input variables are used in the system from a sample
database for training the network. Back propagation algorithm is used for training the network. The system was said as a doctor assistant as it can provided the type of disease according the patients input.
A well recognized approach projected by Philip Greenland et al. [14] predicting the risk of heart disease in asymptomatic individuals based on Framingham score. The Framingham Risk Score is a multivariable statistical prototype which use the age, sex, smoking history used for diagnosing the heart disease. The system is powerful in its scoring method and makes the decision appropriately based on the FRS score. A Fuzzy Expert System for Heart Disease Diagnosis proposed by Ali Adeli et al .[15] was also a stimulus for this work. The considered risk factors in this work are the input for the fuzzy expert system. The system uses temamdani inference method for the decision making process. The obtained result is compared with the database value and is found to be 94% accuracy.
Eon Gyu Lee et al.[3] Modelled a unique technique for the Heart Disease Prediction using Data Mining techniques. In this model the prediction of heart disease based on HRV features and Carotid Arterial Wall Thickness was proposed. CPAR and SVM classifiers are used in this model and they are outperforming comparing to other classifiers. An application of Data Mining techniques for the prediction of Acute Coronary Syndrome was extended by Tahseen A Jilani et al.[16]. Principal Component models(PCA) and regression models are used in the prediction of the disease. The system seems to be powerful in the classification of the ischemic heart disease such as Unstable angina(UA), Non-ST Elevation(MI) and sudden cardiac death.
III. METHODOLOGY
Figure 1 , Proposed Model of OES Heart Disease Prediction
The risk factors or the datas are obtained from different sources like databases, data warehouses and online web forms. In this proposed system the data required for training the neural networks are extracted from MIT-BIH database and a Chinese database[14][15]. For the prediction of heart disease for any individual, the risk factors or the behavioural traits are input through online using a web form.
A. Pre-Processing:
Data Pre-Processing is often neglected but important stage in the data mining process. Data pre-processing describes any type of processing performed on raw data to prepare it for another processing procedure. Data pre-processing transforms the data into a format that will be more easily and effectively processed for the purpose of using in a neural network. There are a number of different tools and methods used for pre-processing, including: sampling, which selects a representative subset from a large population of data; transformation, which manipulates raw data to produce a single input; denoising, which removes noise from data; normalization, which organizes data for more efficient access; and feature extraction, which pulls out specified data that is significant in some particular context.
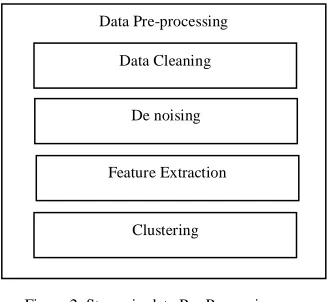
In the proposed system the data pre-processing stages like Sampling, Data cleaning, De noising and Feature extraction are included as shown in Fig 2. Hence the raw data is transformed into a effective data. Finally the pre-processed data is clustered using K- means clustering algorithm. After pre-processing the raw data is transformed in a mode it can be supplied to any type of networks as input. Data pre-processing works based on the term ETL which is Extraction, Transformation and Loading. During this pre-processing stage
the appropriate datas are extracted from the raw data. To perform this transformation the raw data set is normalized using MinMax normalization method. Then the Euclidean distance is found out in the normalized data. Hence the similar datas are passed into the system for training and prediction. The MinMax normalization method is applicable for any type of data sets. The general rule of MinMax Normalization for any data X and the maximum data S the values has to fit into a
The new data set is formed based on the MinMax normalization method. The Euclidean distance is applied on the new data set to find the similar patterns of data. The Euclidean distance is the efficient and simple method to find the similar data patterns. The Euclidean rule for all data set is given below.
The Euclidean distance d for a multi dimensional data set is illustrated below.
The sample dataset on which the MinMax normalization method and the Euclidean distance method are applied is shown in Table 1.
Table 1. Sample raw data set before normalization
Patien
The MinMax normalization method is applied on the sample dataset and the new normalized results are formulated. Table 2 illustrated the normalized vectors. This normalized dataset is forwarded to find the Euclidean distance among all data sets.
Table 2. Normalized data set
Patien
Warehouse Web Forms
There are many other methods such as Pearson coefficient, tanimoto coefficient are available to extract the similar data patterns[16]. The dataset is normalised during the process of data pre-processing. After inculcating the Euclidean distance in the normalized dataset data denoising is applied on the dataset. In denoising the redundant datas are omitted to form a perfect dataset with accurate values. Needed datas are extracted by the process of feature extraction. Finally extracted datas are grouped or clustered using the powerful K-means clustereing algorithm. The flow of data pre – processing is shown in Fig 2.
Figure 2. Stages in data Pre-Processing
B. K- Means Clustering:
K-means is one of the simplest unsupervised learning algorithms that solve the well known clustering problem. On K-means clustering algorithm K centroids are defined one for each cluster. For each data point, the distance from the data point is calculated to each cluster. If the data point is closest to its own cluster, the data point is left as it is otherwise it is moved to the closest cluster. The above said step is repeated until a complete pass is made. Finally, this algorithm aims at minimizing an objective function, in this case a squared error function. The objective function J is
, Where j 2
j i c
x − is chosen
distance measure between a data point xij and the cluster centrecj.
The working procedure of K – means clustering algorithm is given here. Suppose there are n sample feature vectors x1,x2 ...xn all from the same class which belongs to k clusters k<n. Let mi ne the mean of the cluster i.
a) Assign a centroid mean as m1, m2 ....mk. b) Until there are no changes in any mean
a. Use the estimated means to classify the samples into clusters.
b. For i from 1 to k
i. Replace mi with the mean of all the samples for cluster i.
End for End Until
C. Trifle Illustration
Trifle is the piece of information related to every individuals, is an interactive xml (i-xml) data. The proposed system uses the trifles as it can able to accept data from any form from a database, data warehouse or any external sources.
A sample trifle is illustrated below. <assign name =”getPatient ID”>
<copy>
<from variable = “input main”> <age=”inputage”>
<SBP=”inputsbp> <BP=”inputbphr”> <HR =”input”> </copy> </assign>
The above trifle details about the input given from the web forms by an individual. This processed trifle is given against the system for prediction of the heart disease. The trifle tries to match all nodes and populates all the nearby nodes. If the numbers of nearby populated nodes are more the decision will be made. If the numbers of nodes are less then a new hypothesis is formed.
IV. ARCHITECTURE
The proposed system implemented utilize the artificial neural network (ANN) for the decision making process. The multi layered perceptron feed forward network is used in this process. The information are distributed among the nodes and the flow of network is uni directional as it i s a feed forward network. The processing among the nodes are done parallel by the network. All outputs of the first layer will be forwarded to the next layer in an unidirectional way in the feed forward network. An example Multi Layered Perceptron Neural Network is shown in Fig 3.
x1 u1w1
x2
x3
x4
xi uiwi
Input Layer
Hidden Layer Output Layer
Figure 3. A Miluti Layered Feed Forward Network
Each neuron in one layer has directed connections to the neurons of the subsequent layer. The sigmoid function is used as an activation function. Inputs are provided to the Input layer. Output is taken at output layer. In this computation, hidden layers are provided to allow other complex Data Pre-processing
De noising
Feature Extraction
Clustering Data Cleaning
w i
w
w
w h
h h h h
computations. The output value can be determined by the
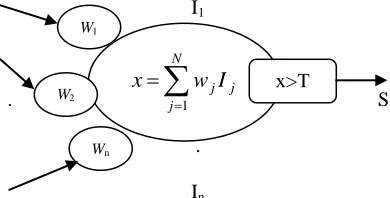
The following section in Fig 4 describes the mathematical representation of a simple perceptron. Same weight adjustments, comparison and calculations are handled in the entire network.
Figure 4. Mathematical Representation of a simple Perceptron
The mathematical representation of the simple perceptron shown in Fig.5 provides an output S as 1 or -1based on the calculated value of x. If x>T , output is 1 other wise output is -1, where T is the threshold value and x is the calculated perceptron value[18]. In a fully connected multilayer feedforward network, each neuron in one layer is connected by a weight to every neuron in the layer downstream it. A bias is also associated with each of these weighted sums. Thus in computing the value of each neuron in the hidden and output layers one must first take the sum of the weighted sums and the bias and then apply f(sum) (the sigmoid function) to calculate the neuron's activation[2][14]. The logistic function is given by
A. Back Propagation Algorithm:
The back propagation learning algorithm is a supervised learning method which requires the training set, the input and output pairs[19]. The network is trained based on the desired output. The error is found out by calculating the difference between the desired output and the actual output. The weights of the network are adjusted based on the relative error value. The output layer error value is calculated and propagated back to the previous layer. The method is primarily concerned with adapting the weights to the calculated error in the presence of input patterns, and the method is applied backward from the network output layer through to the input layer.
In back-propagation, there are two phases in its learning cycle, one to propagate the input pattern through the network and the other to adapt the output, by changing the weights in the network. It is the error signals that are back propagated in the network operation to the hidden layers. The portion of the error signal that a hidden-layer neuron receives in this process is an estimate of the contribution of a particular neuron to the output error. Adjusting on this basis the weights of the
connections, the squared error, or some other metric, is reduced in each cycle and finally minimized.
A weight is initialized for each input plus an additional weight for a fixed bias constant input that is almost always set to 1.0. The activation of a single neuron to a given input pattern is calculated as follows:
0 updates use the delta rule, specifically a modified delta rule where error is backwardly propagated through the network, starting at the output layer and weighted back through the previous layers. The following describes the back-propagation of error and weight updates for a single pattern.
An error signal is calculated for each node and propagated back through the network. For the output nodes this is the sum of the error between the node outputs and the expected outputs[17]. training basically involves feeding training samples as input vectors through a neural network, calculating the error of the output layer, and then adjusting the weights of the network to minimize the error. Each "training epoch" involves one exposure of the network to a training sample from the training set, and adjustment of each of the weights of the network once layer by layer. Selection of training samples from the training set may be random or selection can simply involve going through each training sample in order.
Training can stop when the network error dips below a particular error threshold value of .001 squared error [20]. The performance of the network is evaluated by a validations data set. Tests must be done to confirm that the network is also capable of classifying samples outside of the training set.Fig.5 illustrates the pseudo code of the back propagation algorithm used in our system.
INPUT:
Problem Size, InputPatterns,Iterationmax,Learn rate
OUTPUT: Network
NETWORK Construct Network Layers ( ) NETWORK WEIGHTS :
Initialiaze weights (Network,Problem Size) For ( i = 1 to Iterationmax )
Pattern i = SelectInputPattern(InputPatterns)
Output i = ForwardPropagate(Pattern i, Network)
BackwardPropagateError (Pattern i ,Output i ,Network)
UpdateWeights(Pattern i, Output i, Network, Learn rate)
End End NETWORK
Figure.5. Pseudo code for Back Propagation Algorithm
B. OES Risk Scoring:
The OES risk score is formed based on the Framingham Risk Score Model (FRS). The OES score is a multivariable score that encompass the basic risk factors like age, sex, weight, BMI, Heart rate, Blood Pressure, Systolic Blood
Pressure. Practically 145 patient records were analysed based on the OES Risk Scoring with a median of 6. If the OES score provided less than 20% it is considered to be less risk and greater continues to be the higher risk. The following section illustrates the baseline characteristics stratified for the OES scoring in Table 3.
Table 3: Baseline characteristics stratified for OES Scoring
Risk Factors (n=300) (n=160) (n=220) P Value
Age,mean(SD) 60(6) 65(8) 67(6) <0.01
Cholesterol, mean (SD)
220(40) 232(46) 238(46) >.99
Smoker % 55(16) 45(15) 34(8) .94
SystolicBlood Pressure (SD)
137(20) 140(20) 144(21) .05
Body Mass Index, Mean(SD)
25(3) 27(4) 24(3) .7
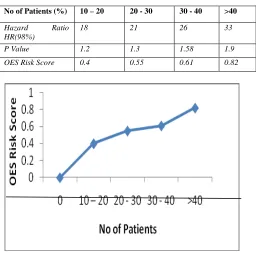
The OES risk scores stated in Table 2 clearly identifies the risk of heart disease in any asymptomatic individual whose behavioural traits are input to the system. This OES risk score assigned as the train data set for the BP training algorithm. The nodes will adjust the weights automatically when the training propagates backward with the OES risk score. Table 4 v defines the analysis of the hazard ratio based on the OES risk score.
Table 4. Analysis of OES Risk Score with hazard ratio
No of Patients (%) 10 – 20 20 - 30 30 - 40 >40
Hazard Ratio HR(98%)
18 21 26 33 P Value 1.2 1.3 1.58 1.9 OES Risk Score 0.4 0.55 0.61 0.82
Figure 6. Analysis of hazard ratio based on risk score
V. EXPERIMENTALRESULTS
The system is evaluated with multiple data sets obtained from MIT BIH Arrhythmia database and some clinical datas obtained from hospitals. The entire data set is divided in three main parts; the training data set, the validation data set and the
test data set. The training data set are used to train the network with aid of validation data set. The test data set is finally used to evaluate the performance of the network. 240 data sets are converted in to trifles and are used to train the network. 82 data sets are validated with the network and an outstanding performance was found out. The below Table 5 and Fig 7 describes the training and validation carried out by the network with real datas.
Table 5. Training data sets carried out in the network
Patient Id
No of training Cycles
Success Failure New hypothesis
1 1000 220 9 1
2 700 194 41 5
3 600 194 43 3
4 450 187 50 3
5 300 179 55 6
6 275 179 55 6
7 100 140 100 0
Figure 7. Success rate Vs No of training
Figure 8. Failure rate Vs No of training
is attracted by equal number of nodes then all node will produce the same sigmoid value and henceforth the decision making will be a trivial task. In this case a new hypothesis formulated by the system and that will be provided in the output followed by the new training of network based on the new hypothesis.
VI. CONCLUSION
In summary, heart disease is a dangerous disease in mankind. In this research a prelude approach is made for the prediction of heart disease. As the system implemented is a web based interactive system all can access to the system easily with little knowledge of their physical fitness. Death from heart failure is substantially underestimated by official statistics. Furthermore, one third or more of deaths currently attributed to coronary heart disease may be related to heart failure and this proportion appears to be increasing. The system encompasses powerful methodologies and algorithms to make sure the system is stable and accurate.
VII.REFERENCES
[1]. Turker Ince*, Serkan Kiranyaz, and Moncef Gabbouj, A Generic and Robust System for Automated Patient-Specific Classification of ECG Signals, IEEE TRANSACTIONS ON BIOMEDICAL ENGINEERING, VOL. 56, NO. 5, MAY 2009.
[2]. R. Hoekema, G. J. H. Uijen, and A. v. Oosterom, “Geometrical aspects of the interindividual variability of multilead ECG recordings,” IEEE Trans.Biomed. Eng., vol. 48, no. 5, pp. 551–559, May 2001.
[3]. Heon Gyu Lee, Ki Yong Noh, and Keun Ho Ryu, A Data Mining Approach for Coronary Heart Disease Prediction using HRV Features and Carotid Arterial Wall Thickness, 2008 International Conference on BioMedical Engineering and Informatics.
[4]. W. Jiang and S. G. Kong, “Block-based neural networks for personalized ECG signal classification,” IEEE Trans. Neural Netw., vol. 18, no. 6,pp. 1750–1761, Nov. 2007.
[5]. B.Bensujin, Karthikeyan marappan, Krishnan Nallaperumal, K.Senthamarai kannan(2008) : A Soft Computing Model to Counter Terrorism, International Journal of Computer Science and Network Security(IJCSNS), Vol.8, No.5, Pp 141-147.
[6]. B.Bensujin, Priyanka sunny, Neethu Joseph (2008) , Knowledge Mining And Trifle Management Using Soft Computing Models, Fisat National Conference
[7]. Sellappan Palaniappan., Rafiah Awang., Intelligent Heart Disease Prediction System Using Data Mining Techniques, IJCSNS International Journal of Computer Science and Network Security, VOL.8 No.8, August 2008.
[8]. Shantakumar B.Patil., Y.S.Kumaraswamy., Intelligent and Effective Heart Attack Prediction System Using Data Mining
and Artificial Neural Network, European Journal of Scientific Research.
[9]. B.Bensujin , M. Karthikeyan, Krishnan Nallaperumal, K.Senthamaraikannan, K.Velu (2007) : A Soft Computing Model for Knowledge Mining and Trifle Management, International Journal of Imaging Science and Engineering ISSN: 1934-9955 Vol. 1, No 4 October 2007.
[10]. B.Bensujin, M.Karthikeyan, Krishnan Nallaperumal, K.Senthamarai Kannan,(2008) : A Novel Technique for Web Page Informative Content Extraction, Journal of Computer Science, Vol.2, No. 4, Pp 646.
[11]. D. Loisance, K. Nakashima, andM. Kirsch, “Computer-assisted coronary surgery: Lessons from an initial experience,” Interactive Cardiovasc.Thorac. Surg., vol. 4, pp. 398–401, 2005.
[12]. Anamika Gupta and Naveen Kumar,”Analysis of Medical Data using Data Mining and Formal Concept Analysis”, World Academy of Science, Engineering and Technology 11 2005
[13]. Niti Guru, Anil Dahiya, Navin Rajpal, "Decision Support System for Heart Disease Diagnosis Using Neural Network", Delhi Business Review, Vol. 8, No. 1 ,January - June 2007.
[14]. Philip Greenland, Laurie LaBree, Stanley P Azen,”Coronory Artery Calcium Score Combined with Framingham score for Risk Prediction in Asymtomatic individuals”, American medical Association, January 2004.
[15]. Ali Adeli and Mehdi Dehsat,” AFuzzy Expert System for Heart Disease Diagnosis”, Proceedings of the Interncational Mulit conference of Engineers Computer Scientist, Hong Kong, Vol I, March 2010.
[16]. Tahseen A Jilani, Huda Yasin and Madiha Yasin,” Acute Coronary Syndrome Prediction using Data Mining Techniques- An Application, World Academy of Science, Engineering & Technology, 2009.
[17]. Modai, I., Israel, A., Mendel, S., Hines, E.L. and Weizman, R., "Neural network based on adaptive resonance theory as compared to experts in suggesting treatment for schizophrenic and unipolar depressed in-patients," Journal of Medical Systems, 20(6): 403–412 (1996).
[18]. Maurizio Bevilacqua (2005), Failure rate prediction with artificial neural networks, Journal of Quality in Maintenance Engineering Vol. 11 No. 3, 2005 pp. 279-294 Emerald Group Publishing Limited 1355-2511.
[19]. O. Bebek and M. Cavusoglu, “Intelligent control algorithms for roboticassisted beating heart surgery,” IEEE Trans. Robot., vol. 23, no. 3,pp. 468–480, Jun. 2007.