MAPPING OF SEA BOTTOM FEATURES USING HIGH RESOLUTION SATELLITE DATA
NURUL NADIAH BINTI YAHYA
MAPPING OF SEA BOTTOM FEATURES USING HIGH RESOLUTION SATELLITE DATA
NURUL NADIAH BINTI YAHYA
A thesis submitted in fulfilment of the requirements for the award of the degree of
Master of Science (Remote Sensing)
Faculty of Geoinformation and Real Estate Universiti Teknologi Malaysia
This work is dedicated with love and passion to
my mother, Puan Hajah Tupiah Binti Robin
my father, Tuan Haji Yahya Bin Atan
my brother and sisters
and not forgotten
ACKNOWLEDGEMENTS
In the completion of this thesis, I have always found myself reflecting on all the people and organizations that have helped me along the way. The list begins with my supervisor, Professor Dr. Mohd Ibrahim Seeni Mohd for his supervision, advice, motivation and guidance. My gratitude also goes to my co-supervisor, Professor Dr. Mazlan Hashim, for his encouragement and moral support. I would like to thank Professor Dr. Teruhisa Komatsu from University of Tokyo, Japan who also taught and guided me all the way through. My lecturers, Dr. Maged Marghany and Encik Samsudin Ahmad, thank you for your help.
My gratitude also goes to the Japan Aerospace Exploration Agency (JAXA) who provided the ALOS AVNIR-2 satellite data. My thanks also goes to the Remote Sensing Laboratory, Department of Remote Sensing, UTM for supplying the Landsat-5 TM satellite data. Finally, a million thanks to Save Our Seahorses (SOS) group for their kindness and willingness to share their field work data at Merambong shoal. Without all these organizations support, this thesis could not be completed on time.
My fellow postgraduate friends, Tam Tze Huay, Jaw Siow Wei, Norsheilla Mohd Johan Chuah, Tan Jia Huan, Yeo Sek Khas and Nur Salisa Che Sab for their help and encouragement. You all are the best.
ABSTRACT
ABSTRAK
TABLE OF CONTENTS
CHAPTER TITLE PAGE
DECLARATION ii
DEDICATION iii
ACKNOWLEDGMENTS iv
ABSTRACT v
ABSTRAK vi
TABLE OF CONTENTS vii
LIST OF TABLES x
LIST OF FIGURES xii
LIST OF SYMBOLS xvi
LIST OF ABBREVIATIONS xix
LIST OF APPENDICES xx
1 INTRODUCTION 1
1.1 Background 1
1.2 Problem Statement 6
1.3 Objectives 7
1.4 Scope of Study 8
1.5 Significance of Research 9
1.6 Study Area 10
2 LITERATURE REVIEW 12
2.1 Introduction 12
2.2 The Basic Concept for Understanding Signal and Light Interference within Marine Features from Space
13
Distribution
2.3.1 Mapping Sea Bottom using Direct Observations 16 2.3.2 Mapping Sea Bottom using Indirect Methods 19 2.4 Algorithms for Sea Bottom Mapping 24
2.5 Summary 29
3 DATA AND METHODOLOGY 30
3.1 Introduction 30
3.2 Data Sources and Materials 30
3.2.1 Satellite Data 31
3.2.2 Ancillary Data 36
3.3 Software 45
3.4 Methodology 45
3.4.1 Pre-processing 47
3.4.1.1 Subset Image 47
3.4.1.2 Geometric Correction 47
3.4.1.3 Masking 48
3.4.1.4 Sun Glint Removal 49
3.4.1.5 Transformation of Digital Number (DN) to Radiance
50
3.4.2 Processing 53
3.4.2.1 Depth Invariant Index Technique 54 3.4.2.2 Bottom Reflectance Index Technique 56
3.4.2.3 Density Slicing 60
3.4.2.4 Supervised Classification 60
3.4.3 Analyses of the Results 61
3.5 Summary 62
4 RESULTS, ANALYSIS AND DISCUSSION 64
4.1 Introduction 64
4.2 Pre-processing Results 65
4.2.1 Results of Subset Images 65
4.2.2 Results of Geometric Correction 67
4.2.3 Results of Image Masking 67
4.2.5 Results of Transformation of Digital Number to Radiance
73
4.3 Results and Analysis of Sea Bottom Mapping Using Depth Invariant Index Technique in Sibu Island and Merambong Shoal
76
4.4 Results and Analysis of Sea Bottom Mapping Using Bottom Reflectance Index Technique in Sibu Island and Merambong Shoal
97
4.5 Discussion 115
4.6 Summary 121
5 CONCLUSIONS AND RECOMMENDATIONS 122
5.1 Conclusions 122
5.2 Recommendations 123
REFERENCES 125
LIST OF TABLES
TABLE NO. TITLE PAGE
1.1 Comparison between Seaweed and Seagrass 2 1.2 Habitat Requirement for Seaweeds, Seagrass and Coral Reefs 5
2.1 Summary of Techniques and Equipment 18
3.1 Characteristics of ALOS AVNIR-2, Quickbird and Landsat-5 TM satellite data Satellite
32
3.2 Description of Images Used for Sibu Island 33 3.3 Description of Image Used for Merambong Shoal 33
3.4 Summary of Equipment Used 37
3.5 Constant Value for Rescaling Gains and Biases for ALOS AVNIR-2
51
3.6 Constant Value for Rescaling Gains and Biases for Landsat-5 TM
52
3.7 Quickbird absCalFactorBand Value 53
3.8 Quickbird effective bandwidth (Δλ) 53
3.9 Level of Agreement of Kappa Coefficient Values 61 4.1 Deep Water Radiance Value for Each Satellite Data and
Study Area
76
4.2 Value of Correlation Coefficient, R2 for Sibu Island 83 4.3 Value of Correlation Coefficient, R2 for Merambong shoal 83
4.4 Ratio of Ki/Kj 83
4.5 Error Matrix for Depth Invariant Index Using Quickbird Satellite Data in Sibu Island
92
4.6 Error Matrix for Depth Invariant Index Using ALOS AVNIR-2 Satellite Data in Sibu Island
94
AVNIR-2 Satellite Data in Merambong Shoal
4.8 Date and Time of Satellite Pass 97
4.9 Value of Attenuation Coefficient for band 1 (blue) and band 2 (green) for ALOS AVNIR-2 and Quickbird Satellite Data
102
4.10 Sun and Satellite Elevation Angle for ALOS AVNIR-2 and Quickbird Satellite Data
103
4.11 Geometric Factor, g Value for ALOS AVNIR-2 and Quickbird Satellite Data
103
4.12 Error Matrix for Bottom Reflectance Index Using Quickbird Satellite Data in Sibu Island
110
4.13 Error Matrix for Bottom Reflectance Index Using ALOS AVNIR-2 Satellite Data in Sibu Island
112
4.14 Error Matrix for Bottom Reflectance Index Using ALOS AVNIR-2 Satellite Data in Merambong Shoal
114
LIST OF FIGURES
FIGURE NO. TITLE PAGE
1.1 Morphological Differences Between Seaweed and Seagrass 2
1.2 Types of Coral Reefs 3
1.3 Location Map of Sibu Island and Merambong Shoal in Johor
11
2.1 Absorption, Scattering and Attenuation of Light in Water 14 2.2 Signal Components of Electromagnetic Radiation Between
Sea and Satellite Sensor
15
2.3 Box Classification for Seven Classes 26
3.1 Full Raw Satellite Scene for (a) ALOS AVNIR-2 (b) Landsat-5 TM and (c) Quickbird of Sibu Island
35
3.2 Full Raw Satellite Scene of ALOS AVNIR-2 of Merambong Shoal
35
3.3 Sea Truth Equipment 37
3.4 Side Scan Sonar Image in Sibu Island 38
3.5 Sea Truth Map of Sibu Island Obtained on 28 September 2011
39
3.6 Sea Truth Map of Merambong Shoal Obtained on 2 July 2010
40
3.7 Topographic Map of Sibu Island 41
3.8 Topographic Map of Merambong Shoal 42
3.9 Hydrographic Chart of Sibu Island and Surrounding Areas 43 3.10 Hydrographic Chart of Merambong Shoal and Surrounding
Areas
44
3.11 Flow Chart of Methodology 46
3.12 Relationship Between Visible Band and NIR Band of Glinted Image
3.13 Graph of Xi Versus Xj 54 3.14 Sun and Satellite Zenith Angles on Air and Below Water 57
3.15 Satellite Zenith Angle 58
3.16 Relationship Between Radiance and Depth for Sand Where is y-Intercept, is Horizontal Asymptote and is
Regression Value
59
4.1 Subset of Satellite Images in Sibu Island 66 4.2 Subset of Satellite Images in Merambong shoal 67
4.3 Masked Images of Sibu Island 68
4.4 Masked Images of Merambong Shoal 69
4.5 Relationship of Sun Glint Digital Number Between Visible Band and NIR Band
70
4.6 Deglinted Image for (a) Band 1 (Blue), (b) Band 2 (Green), (c) Band 3 (Red) and (d) All Bands
72
4.7 Image Radiances for Bands 1, 2 and 3 in Sibu Island 74 4.8 Image Radiances for Bands 1, 2 and 3 in Merambong Shoal 75 4.9 Maps Derived from ALOS AVNIR-2 Imagery of Sibu
Island Using Density Slicing of Bands 1 and 3
77
4.10 Enhanced Methodology Using Maximum Likelihood Supervised Classification
77
4.11 Scatter Plot of Sand Substrate at Various Depths Between Transformed Measured Radiance, X Values from Bands 1 & 3 for Landsat-5 TM, ALOS AVNIR-2 and Quickbird Satellite Data in Sibu Island and Merambong shoal
79
4.12 Scatter Plot of Sand Substrate at Various Depths Between Transformed Measured Radiance, X Values from Bands 2 & 3 for Landsat-5 TM, ALOS AVNIR-2 and Quickbird Satellite Data in Sibu Island and Merambong shoal
81
4.13 Depth Invariant Index Images of Sibu Island 85 4.14 Depth Invariant Index Images of Merambong Shoal 86 4.15 Sea Bottom Map Using Landsat-5 TM Satellite Data (2005)
in Sibu Island Over Sibu Island
87
4.16 Sea Bottom Map Using Quickbird Satellite Data (2007) in Sibu Island
88
(2008) in Sibu Island
4.18 Sea Bottom Map Using ALOS AVNIR-2 Satellite Data (2010) in Merambong Shoal
90
4.19 Qualitative Analysis of Processed Quickbird Satellite Data Using Depth Invariant Index Technique for Sibu Island
91
4.20 Qualitative Analysis of Processed ALOS AVNIR-2 Satellite Data Using Depth Invariant Index Technique for Sibu Island
93
4.21 Qualitative Analysis of Processed ALOS AVNIR-2 Satellite Data Using Depth Invariant Index Technique of Merambong Shoal
95
4.22 Tidal Height During Satellite Passes in Study Areas 98 4.23 Relationship Between Radiance and Depth for Bands 1 and
2 for Quickbird Satellite Data in Sibu Island
99
4.24 Relationship Between Radiance and Depth for Bands 1 and 2 for ALOS AVNIR-2 Satellite Data in Sibu Island
100
4.25 Relationship Between Radiance and Depth for Bands 1 and 2 for ALOS AVNIR-2 Satellite Data in Merambong Shoal
101
4.26 Bottom Reflectance Index from Band 1 and Band 2 Using Quickbird and ALOS AVNIR-2 Satellite Data in Sibu Island
104
4.27 Bottom Reflectance Index from Band 1 and Band 2 Using ALOS AVNIR-2 Satellite Data in Merambong Shoal
105
4.28 Sea Bottom Map from Quickbird Satellite Data (2007) in Sibu Island
106
4.29 Sea Bottom Map from ALOS AVNIR-2 Satellite Data (2008) in Sibu Island
107
4.30 Sea Bottom Map from ALOS AVNIR-2 Satellite Data (2010) in Merambong Shoal
108
4.31 Qualitative Analysis of Processed Quickbird Satellite Data Using Bottom Reflectance Index Technique in Sibu Island
109
4.32 Qualitative Analysis of Processed ALOS AVNIR-2 Satellite Data Using Bottom Reflectance Index Technique in Sibu Island
4.33 Qualitative Analysis of Processed ALOS AVNIR-2 Satellite Data Using Bottom Reflectance Index Technique in Merambong Shoal
113
4.34 Coral Reefs Distribution in Sibu Island in 1997 116
4.35 Location of Pulai estuary 117
4.36 Accuracy Comparison of Sibu Island 120
LIST OF SYMBOLS
absCalFactorBand - Absolute Radiometric Calibration Factor
c - y-intercept
Dn, DNi - Digital Number
FOV - Field of View
g - Geometric Factor Accounting for Path Length Through Water
h - Satellite Height
i - i-th Habitat
M - Number of Habitats
m - Slope of Graph
N - Total Number of Sites
qPixel,Band - Radiometrically Corrected Image Pixels
R - Earth Radius
-RB - Index Substrate Reflectance
SX - Swath Width
T - Tau Coefficient
X, Y - Coordinates on Map x, y - Coordinates on Image
Z - Depth
ΔλBand - Effective Bandwidth for a Given Band Ø - Satellite Zenith Angle
- y-intercept
- Horizontal Asymptote
- Regression Value
Ri’ - Deglinted Image
Øs - Sun Zenith Angle
ai - Wavelength Dependent Constant Accounting for Atmospheric Effects and Water Surface Reflection
a1-a6 - Coefficients
Brescale - LMINλ
b1-b6 - Coefficients
bi - Regression Slope
CalCoefi - In-band Radiance Calibration Coefficient Ki, Kj - Attenuation Coefficient for Bands i and j Li, Lj - Measured Radiance in Bands i and j Lsi, Lsj - Deep Water Radiance in Bands i and j LMAXλ - Spectral Radiance that is Scaled to Qcal max LMINλ - Spectral Radiance that is Scaled to Qcal min Lλ - Spectral Radiance at the Sensors Aperture
LλPixel,Band - Top-of-atmosphere (TOA) Band Integrated Radiance Image Pixels
MinNIR - Minimum Pixel Value in NIR Band na - Air Refraction Index
ni - Total Row for Habitat i nw - Water Refraction Index
P0 - Overall Accuracy
Qcal - Digital Number
Qcal max - Maximum Quantized Calibrated Pixel Value (DN)
Corresponding to LMAX
Qcalmin - Minimum Quantized Calibrated Pixel Value (DN) Corresponding
to LMIN
Rbi - Bottom Reflectance Ri - Pixel Value in Band i RNIR - Pixel Value in NIR Band
ri, rj - Bottom Reflectance in Bands i and j
Xi, Xj - Transformed Measured Radiance in Bands i and j X1 - Transformed Measured Radiance for Band 1 X3 - Transformed Measured Radiance for Band 3 xi - Diagonal Value for Habitat i
LIST OF ABBREVIATIONS
ALOS : Advanced Land Observing Satellite
AVIRIS : Airborne Visible Infrared Imaging Spectrometer
AVNIR-2 : Advanced Visible and Near Infrared Radiometer Type 2 CASI : Compact Airborne Spectrographic Imager
DIB : Depth-invariant Bottom Index
DGPS : Differential Global Positioning System
DN : Digital Numbers
EMR : Electromagnetic Radiation ETM+ : Enhanced Thematic Mapper Plus GCP : Ground Control Points
GIS : Geographic Information System GPS : Global Positioning System IRS : Indian Remote Sensing
JAXA : Japan Aerospace Exploration Agency
LISS III : 1C and 1D Linear Imaging Self-scanning Sensor III MSS : Multispectral Scanner
NIR : Near Infrared
NRE : Ministry of Natural Resources and Environment ROV : Remotely Operated Vehicle
SOS : Save Our Seahorses
SPOT : Systeme Probatoire de I’Observation de la Terre
TM : Thematic Mapper
LIST OF APPENDICES
APPENDIX TITLE PAGE
A Sea Truth Calibration Points for Sibu Island 135 B Sea Truth Validation Points for Sibu Island 137 C Sea Truth Calibration Points for Merambung Shoal 146 D Sea Truth Validation Points for Merambong Shoal 147
E Sea Bottom Features of Sibu Island 152
CHAPTER 1
INTRODUCTION
1.1 Background
Sea bottom features are very significant to the ecosystem of the marine
environment. Seaweed and seagrass are both marine plants that live in the seawater.
Coral reefs are complex, important, beautiful, ancient and striking features of the
marine environment. These marine life are strongly affected by modification of land
changes. They need sunlight for photosynthesis which requires light and carbon
dioxide. Photosynthesis process is the major factor for the exchange of gases among
seawater, and marine plants system (Hermand et al. 2006).
Seagrass are flowering plants with true roots, adapted to live and reproduce in
seawater (Community Environment Network, 2005). Seagrass can be found in
tropical, temperate and at the edge of the artic regions (McKenzie, 2008). It is
located in calm seawaters, shallow waters, bay, protected sea shorelines and on
off-shore islands among coral reef borders where they populate the outer area between
coral reef and semi-open sea. Seaweed which are also referred as macroalgae are
visible to the eyes along most coastal areas. They attach themselves to rocks and
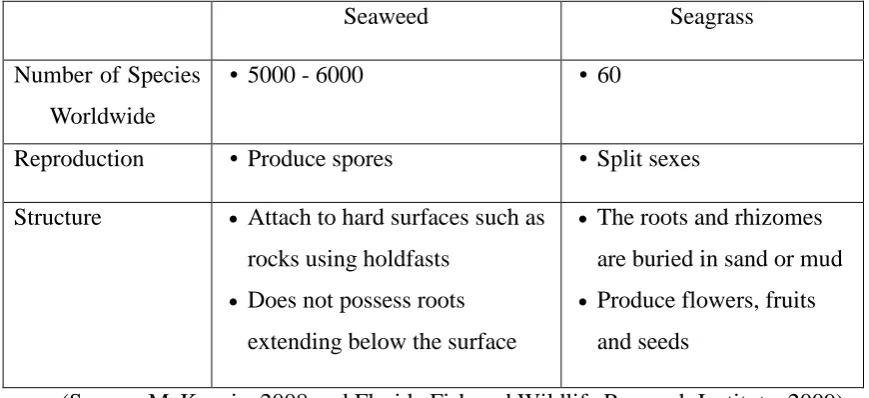
Usually, seagrass are confused with seaweed, but there are many significant
differences between these two different marine species. They also differ in
reproduction, structure, and the methods by which they transport nutrients and
dissolved gases. Figure 1.1 and Table 1.1 show the differences between them.
Figure 1.1: Morphological differences between seaweed and seagrass
(Source: Florida Fish and Wildlife Research Institute, 2009)
Table 1.1: Comparison between seaweed and seagrass
(Source: McKenzie, 2008 and Florida Fish and Wildlife Research Institute, 2009)
Meanwhile, coral reefs are submarine structures that are made from calcium
carbonate unseen by colonies of small animals found in seawaters containing few
nutrients. Coral reefs can be found in tropical regions where they require a water
temperature of 18°C or more (Buddemeier et al., 2004). Also, they are limited to
grow in not deeper than 50 m water as they need clear and warm water and high
Seaweed Seagrass
Number of Species
Worldwide
• 5000 - 6000 • 60
Reproduction • Produce spores • Split sexes
Structure • Attach to hard surfaces such as
rocks using holdfasts
• Does not possess roots
extending below the surface
• The roots and rhizomes
are buried in sand or mud
• Produce flowers, fruits
intensity of sunlight to survive (Nim and Skirving, 2010). Coral reefs eat plankton,
zooplankton and small fishes to survive. Generally, coral reefs can be found close to
land in shallow water since they require sunlight to stay alive. They exist on the outer
edge of the coastal zone with seagrass habitats located between them and mangrove,
from low-tide level to the coral reefs fringe. Fringing, barrier and atoll are types of
coral reefs. Figure 1.2 shows each type of coral reefs.
Figure 1.2: Types of coral reefs
(Source: Coral reefs Facts, 2010)
Fringing reef is a type of reef which is located at edge shorelines of islands and
continents in tropical ocean water while barrier reef can be found far from shoreline.
Finally, atoll reefs are rounded or elliptical shape reefs that surround a middle lagoon
which are created when a small volcanic island vanish under the ocean surface. A
variety of colourful coral reefs offers protection for marine life such as crabs, fishes,
Seagrass, seaweed and coral reefs are particularly important ecologically and
commercially. Nowadays, seagrass and seaweed are crucial and primary producers in
oceanic food webs. Seagrass supply food and habitats for the vulnerable animals like
dugongs, seahorses and green turtles. Meanwhile, seaweed are also valuable sources
of food, micronutrients, and raw materials for the pharmaceutical industry. They are
rich in minerals and vitamins, therefore, they are called medical food of millennium
century. However, seaweed and seagrass had been threatened and the population
decreases yearly. Construction works in the coastal zone, degrading of water quality,
pollution of untreated sewage from accommodation facilities and oil pollution from
motorized boats are several factors that contribute to the decreasing number of
seaweed and seagrass population. In fact, natural threat activities like wave reactions
and soil erosion are also factors of the degradation of these two marine plants.
Human activities are causing the loss of coral reefs through direct and indirect
methods. Over fishing by human is among the factors that contribute to loss of coral
reefs as fishes are among the major food for coral reefs. Pollution such as garbage,
pesticides, oil slicks and other forms of ocean pollution poison coral reefs too.
Physical damage is also one of the major threats to coral reefs. Tourists who damage
the reefs, anchors dropped in coral beds and ships that collide with coral reefs are
examples of physical damage to coral reefs. When mangroves and tropical forests are
cut down to clear the land for cultivation purposes, top soil will be washed by rivers
into coastal ecosystems. Soil which falls on the coral reefs will block the sunlight
needed for coral reefs to live. Harvesting coral reefs itself for food, traditional
medicine and aquaria are also threats to coral reefs loss. These activities will
definitely destroy the reefs as well as their habitats. The characteristics of seaweed,
Table 1.2: Habitat requirement for seaweed, seagrass and coral reefs
Seaweed Seagrass Coral reefs
Habitat Grow around the
shore and attach
themselves one
another
Grow on soft sand
or mud
Grow on hard
substrate
Depth limit 0 m to 50 m
Depends on the
sunlight
penetration
< 70 m
Depends on the
sunlight
penetration
0 m to 50 m
Depends on the
sunlight
penetration
Water temperature 20°C – 30°C 25°C – 38°C 23°C - 29°C
(Source: Campbell et al., 2006, McKenzie, 2008, Florida Fish and Wildlife Research
Institute, 2009 and National Ocean Service, 2012)
A lot of research activities had been made to preserve these sea bottom
features (Lotze et al., 2006, Malnar et al., 2008, Kakuta et al., 2010). Continuous
monitoring will help to preserve sea bottom features from becoming extinct. In fact,
Malaysia also has a group of researchers who specialize in this field (Japar Sidik et
al., 2006 and Phang, 2006). The first checklist of the marine benthic algae in
Malaysia was published by Phang and Wee (1991). Presently 375 taxa of seaweed
(Phang, 2006) and 14 seagrass species (Japar Sidik et al., 2006) have been recorded.
Meanwhile, 323 coral reefs species have been identified during status information on
the coral reefs of the east coast of Peninsular Malaysia (Harbone et al., 2000). Many
researchers have carried out research to map sea bottom features. As regards of sea
bottom features mapping, a number of studies can be found in the literature
combining in situ observations and remote sensing techniques. Remote sensing
provides the most flexible and accurate techniques for sea bottom assessments at
differential scale (up to 0.5 meters), while ground techniques are not suitable to
complete the mission by a certain time (Dekker et al., 2006). The conventional
sensors that are widely used in sea bottom features mapping are medium and high
resolution images that are capable of detecting these features. However,
sea bottom species compared to the usual spaceborne sensors (Dekker et al., 2006).
But in Malaysia, there is a limitation to obtain these data because they are expensive.
Besides satellite data, fieldwork also needs to be done to recognize the
characteristic of substratum types which shows in the image as well as benthic plant
species and other cover types. However, sea truth is frequently performed a few days
to weeks earlier or later than collection of the satellite data (Dekker et al., 2006).
Some of the instrument that had been used by researchers were side scan sonar
measurement (Lucieer, 2008, Sagawa et al., 2008), underwater camera (Sagawa et
al., 2010) and remotely operated vehicle (ROV) (Yamamuro et al., 2002) whereby
they gave accurate sea truth data.
A study was carried out in Sibu Island and Merambong shoal, Johor to
classify different sea bottom features (i.e. seagrass, seaweed and coral reefs). The
Landsat-5 TM, ALOS AVNIR-2 and Quickbird satellite data were used in Sibu
Island while ALOS AVNIR-2 was used in Merambong shoal. Two different
techniques, namely depth invariant index and bottom reflectance index were applied
in order to extract different types of sea bottom features. Sea-truth measurements
were made to verify the results obtained by direct observations using underwater
camera, side scan sonar and handheld Garmin GPS.
1.2 Problem Statement
Seaweed, seagrass and coral reefs features have decreased due to human
activities and natural causes. These factors are dominant and existing threats to
biological and ecological aspects especially to marine life. Sibu Island is already
known as a location of seaweed, seagrass and coral reefs beds, while Merambong
shoal is famous for seagrass beds. These two areas are important because they are
fish breeding areas and supply food especially for the dugongs, turtles and birds.
Marine Park. Pollution, boating activities and construction works are some of the
threats from human activities. Merambong shoal supports nine types of species of
seagrass (Japar Sidik et al., 2006) and supports large tract of intact riverine
mangroves and endangered species such as the seahorse, pipefish, dugong and sea
turtles. However, construction development in the surrounding area has resulted in
the habitat and species loss. In addition, land reclamation for port facilities near
Tanjung Pelepas Port causes sedimentation and burial of seagrass beds (Japar Sidik
et al., 2006). This study investigates the distribution of seaweed, seagrass and coral
reefs in Sibu Island and Merambong shoal.
The existing map of sea bottom features over Sibu Island is not up-to-date.
The map was published in the year 1997 by Jabatan Perancangan Bandar dan Desa.
The map only showed the location of coral reef and sand features. The existing map
of Merambong shoal had just been illustrated by an organization called Save Our
Seahorses in 2009. Although the illustration appears detailed, it was not mapped
according to standards i.e. it lacks projection and scale.
So far, mapping marine plants remains a challenge to researchers. Several
techniques and methods had been proposed, however certain sea bottom features
tends to overlap with other sea bottom features (Edwards et al., 1999, Andrefouet et
al., 2003, Boggs et al., 2009). Therefore, knowledge about the satellite signal and
light interference within atmosphere to marine algae features is very important.
1.3 Objectives
This research will focus on sea bottom features mapping over Sibu Island and
Merambong shoal areas. The specific objectives of the research are as below,
a) To analyse the suitability of depth invariant index and bottom reflectance
b) To identify the most suitable satellite data for sea bottom features mapping
between Quickbird, ALOS AVNIR-2 and Landsat-5 TM satellite data.
c) To produce a new digital map showing the distribution of sea bottom features
for Sibu Island and Merambong shoal using Advanced Land Observing
Satellite (ALOS) Advanced Visible and Near Infrared Radiometer type 2
(AVNIR-2), Landsat-5 TM data and Quickbird satellite data.
1.4 Scope of Study
The scope of the study is as follows:
a) The satellite data used in this study are ALOS AVNIR-2,
Landsat-5 TM and Quickbird data. For Sibu Island, the data used are ALOS
AVNIR-2, Quickbird and Landsat-5 TM data while ALOS AVNIR-2 was
used for Merambong shoal.
b) Equation of depth invariant index (Lyzenga, 1981) and bottom reflectance
index (Sagawa et al. 2010) were used to extract sea bottom features. The
depth invariant index technique is independent of the water depth, while the
bottom reflectance index is dependent of water depth. From these two
techniques, the most suitable algorithm for sea bottom features mapping was
determined by comparing the results with sea truth data. In order to achieve
this, the overall, producer and user accuracy, kappa coefficient and Tau
coefficient were calculated.
c) The sea truth data was obtained by using an underwater camera and side scan
sonar to determine the types of sea bottom features and the locations of these
features were determined by handheld GPS. Hydrographic charts were also
1.5 Significance of Research
This study can contribute to the preservation of endangered marine species
especially seaweeds, seagrass and coral reefs which are the richest and most
productive features of the coastal systems of the world. They shield and improve
water quality, supply shoreline stabilization, essential habitats for fishes, birds, and
other marine life which and now referred to as ecosystem services, that act in several
ways as listed below:
• They are important primary producers, that convert sunlight and
carbon dioxide efficiently into organic form
• They supply organic food to a variety of dependent food webs • They stabilize the seabed in which they grow
• They structure the seabed on which they grow into a complex
environment which provides places for many organisms to exist
• They act as a nursery ground for many commercially-caught species
(Source: Costanza et al., 1997)
The suitability of the algorithms in 1.3 (a) for determination of seagrass,
seaweed and coral reefs in Sibu Island and Merambong shoal area was examined to
accurately map their distribution. Hence, the changes of distribution of seaweed,
seagrass and coral reefs can be monitored precisely. These sea bottom features can
also promote the tourism industry in Malaysia. For fishing industry, the information
of sea bottom features location is essential to identify the possible places of higher
1.6 Study Area
The study was carried out in Johor waters i.e. Sibu Island and Merambong
shoal (Figure 1.3). Sibu Island which is located at latitude of
2⁰ 12’ North and 104⁰ 5’ East has many resorts and chalets surrounded by white
sandy beaches. This area is under the jurisdiction of the Johor Marine Park, a federal
agency of the Ministry of Natural Resources and Environment (NRE). Merambong
shoal which is located at latitude of 1⁰ 20’ North and 103⁰ 36’ East has the largest
seagrass beds in Malaysia which covers Tanjung Adang, Tanjung Kupang,
Merambong and Merambong Island.
Sibu Island was selected due to the obvious annihilation of the seaweed,
seagrass and coral reefs distribution. This island has clear water almost all around the
island. It has shallow water that provide high probability of seaweed, seagrass and
coral reefs distribution. This island which is located in a wide coastal area has low
pollution effects. Furthermore, it is a sandy island which is very suitable for seaweed,
seagrass and coral reefs habitat. The Merambong shoal boasts the most extensive
intertidal seagrass meadows in Malaysia and supports large tract of intact riverine
mangroves and endangered species such as the seahorse, pipefish, dugong and sea
turtles. It contains nine species of seagrass at depths of 2 to 2.7 meter, which is the
maximum number of species in Malaysia (Japar Sidik et al., 2006).
However, developments in the surrounding area during the last decade have
resulted in the marine habitat loss. Threats from human activities such as sand
mining, oil pollution, transportation avenues and land reclamation for port facilities
References
Adeli A. (1992). Penggunaan Teknik Remote Sensing Dalam Perolehan Maklumat
Marin. Tesis Sarjana Sains Ukur, Universiti Teknologi Malaysia, Skudai.
Andrefouet S., Kramer P., Torres-Pulliza D., Joyce K. E., Hochberg E. J.,
Garza-Perez R., Mumby P. J., Riegl B., Yamano H., White W. H., Zubia M., Brock
J. C., Phinn S. R., Nasser A., Hatcher B. G. and Muller-Karger F. E. (2003).
Multi-site Evaluation of IKONOS Data for Classification of Tropical Coral
Reef Environment. Remote Sensing of Environment, 2003. 128–143.
Armstrong R., Guild L., Gilbes F., Lobitz B. and Detres Y. (2007). Water Column
Corrections of AVIRIS Data for Hyperspectral Characterization of Benthic
Marine Communities in Puerto Rico. Proceedings 5th EARSeL Workshop on
Imaging Spectroscopy. April 23-25, 2007. Bruges, Belgium.
Boggs G., Edyvane K., Carvalho D., Penny S., Rouwenhorst J., Brocklehurst P.,
Cowie I., Barreto C., Amaral A., Smit N., Monteiro J., Mau R., Amaral J. and
Fernandes L. (2009). Marine and Coastal Habitat Mapping in Timor Leste
(North Coast) - Final Report. Ministry of Agriculture and Fisheries
Government of Timor Leste.
Boryan C. and Craig M. (2005). Multiresolution Landsat TM and AWIFS Sensor
Assessment for Crop Area Estimation in Nebraska. Pecora 16 “Global
Bouvet M., Chander G., Goryl P., Santer R. and Saunier (2007). Preliminary
Radiometric Calibration Assessment of ALOS AVNIR-2.
23-28 July 2007. 2673-2676.
Bowden D. A. (2004). Quantitative Characterization of Shallow Marine Benthic
Assemblages at Ryder Bay, Adelaide Island, Antarctica. Marine Biology.
2005. 146: 123501249.
Brown C.W., Connor L. N., Lillibridge J.L., Nalli N. R. and Legeckis R.V. (2005).
An Introduction to Satellite Sensors, Observations and Techniques. In Miller
R. L., Castillo C.E.D. and McKee B. A (eds). Remote Sensing of Coastal
Aquatic Environments: Technologies, Techniques and Applications. 21-50.
The Netherlands: Springer.
Buddemeier, R.W., Kleypas J.A. and Aronson R. B. (2004). Coral Reefs and Global
Climate Change: Potential Contributions of Climate Change to Stresses on
Coral Reef Ecosystems. Report prepared for the Pew Centre on Global
Climate Change, Arlington, Virginia, pp. 27.
Bukata R.P., Jerome J.H., Kondratyev K.Y. and Pozdnyakov D.V. (1995). Optical
Properties and Remote Sensing of Inland and Coastal Waters (pp. 1-36).
Florida: CRC Press.
Campbell S.J., McKenzie L.J. and Kerville, S.P. (2006). Photosynthetic responses of
seven tropical seagrasses to elevated seawater temperature.Journal of
Experimental Marine Biology and Ecology, 330 (2). pp. 455-468.
Chander G. and Markham B. (2003). Revised Landsat-5 TM Radiometric Calibration
Procedures and Postcalibration Dynamic Ranges. IEEE Transactions on
Geoscience and Remote Sensing. November 2003. 41 (11).
Chander G., Markham B. and Barsi J. (2007). Revised Landsat-5 Thematic Mapper
Radiometric Calibration. IEEE Geoscience and Remote Sensing Letters. July
Choo C.K., Rahman S. and Khor H. M. (2009). S.O.S Files: A Journey to Sungai
Pulai, Gelang Patah: Save Our Seahorses.
Ciraolo G., Cox E., Loggia G. L. and Maltese A. (2006). The Classification of
Submerged Vegetation using Hyperspectral MIVIS Data. Annals of
Geophysics. February 2006. 49 (1).
Community Environment Network (2005). Watching The Seagrass Grow – A Guide
for Community Seagrass Monitoring in NSW (2nd Ed). The Community
Environment Network, Ourimbah.
Coral reefs Facts. Retrieved on December 2010, from
Costanza R., d’Arge R., De Groot R., Fraber S., Grasso M., Hannon B., Limburg K.,
Naeem S., O’Neill R., Paruelo J., Raskin R., Sutton P., and Van den Belt M.
(1997). The Value of the World’s Ecosystem Services and Natural Capital.
NATURE. 387, 253-260.
Dekker A.G., Brando V. E., Anstee J. M. (2006). Remote sensing of seagrass
ecosystems: Use of spaceborne and airborne sensors. In Seagrass: Biology,
Ecology and Conservation, Larkum A.W.D, Orth R.J and Duarte C.M (eds),
pp. 347 – 359 (Netherlands: Springer).
Department of Survey and Mapping Malaysia (1996). Topographic Map 1:50,000
Sekudai – Sheet No 174.
Department of Survey and Mapping Malaysia (1994). Topographic Map 1:50,000
Pulau Tinggi – Sheet No 160.
Department of Town and Country Planning (1997). Taburan Terumbu Karang.
DigitalGlobe (2007). Quickbird Imagery Products: Product Guide. Longmont,
Colorado.
Edwards A. J., Mumby P. J., Green E. P. and Clark C. D. (1999). Lesson 6: Mapping
the Major Inshore Marine Habitats of the Caicos Bank by Multispectral
Classification using Landsat TM. In Edwards A. J. Applications of Satellite
and Airborne Image Data to Coastal Management. 137-150. France:
UNESCO.
Florida Fish and Wildlife Research Institute. Retrieved on September 2009, from
Green E.P., Mumby P.J., Edwards E.J. and Clark C.D. (2000). Remote Sensing
Handbook for Tropical Coastal Management. Coastal Management Source
Books 3. 121-128. Paris: UNESCO.
Han L. (2002). Spectral reflectance of Thalassia testudinum with varying depths.
Proceedings of Geoscience and Remote Sensing Symposium. Vol. 4, 2123-
2125.
Harborne A., Fenner D., Barnes A., Beger M., Harding S. and Roxburgh T. (2000).
Status Report on the Coral Reefs of the East Coast of Peninsula Malaysia.
United Kingdom: Coral Cay Conservation Ltd.
Hashim M., Rahman R. A., Muhammad M. and Rasib A. W. (2001). Spectral
Characteristics of Seagrass with Landsat TM in Northern Sabah Coastline,
Malaysia. 22nd Asian Conference on Remote Sensing. 5-9 November 2001.
Singapore.
Hashim M., Rasib A. W. (1997). Mapping Seagrass from Satellite Remote Sensing
Data. Asian Conference on Remote Sensing. 20 – 25 October 1997.
Hedley J. D., Harborne A. R. and Mumby P. J. (2005). Technical Note: Simple and
Robust Removal of Sun Glint for Mapping Shallow-water Benthos.
International Journal of Remote Sensing. 26:10, 2107 — 2112.
Hermand J. P.(2006). Continuous Acoustic Monitoring of Physiological and
Environmental Processes in Seagrass Prairies with Focus on Photosynthesis.
In Caiti A., Chapman N.R., Hermand J.-P. and Jesus S.M. Acoustic Sensing
Techniques for the Shallow Water Environment. 183-196. Netherland:
Springer.
Hochberg, E.J., Andre´Foue¨T. S. and Tyler, M.R. (2003). Sea Surface Correction of
High Spatial Resolution IKONOS Images to Improve Bottom Mapping in
Near-shore Environments. IEEE Transactions on Geoscience and Remote
Sensing. 41, 1724–1729.
Japan Aerospace Exploration Agency (2008). ALOS Data Users Handbook:
Revision C.
Japan Association on Remote Sensing. Retrieved on September 2009, from
Japar Sidik B., Muta Hara Z. and Arshad A. (2006). Distribution and Significance of
Seagrass Ecosystems in Malaysia. Aquatic Ecosystem Health and
Management. 9(2), 203-214. Taylor and Francis Group.
Jensen J.R. (1996). Introductory Digital Image Processing. (2nd ed.) NewJersey:
Prentice Hall.
Kakuta S., Hiramatsu T., Numata Y., Yamano H. and Aramaki M. (2010).
Satellite-Based Mapping of Coral Reefs in East Asia, Micronesia and Melanesia
Regions. International Archives of Photogrammetry, Remote Sensing and
Kirk J.T.O. (1994). Estimation of the Absorption and the Scattering Coefficients of
Natural Waters by Use of Underwater Irradiance Measurements. Applied
Optics. 33 (15), 3276-3278.
Komatsu T., Mikami A., Sultana S., Ishida K., Hiraishi T. and Tatsukawa K. (2003).
Hydro-acoustic Methods as a Practical Tool for Cartography of Seagrass
Beds. Otsuchi Marine Science. 28: 72-79.
Krause K. (2003). Radiance Conversion of Quickbird Data. Technical Note
DigitalGlobeTM. 7 July 2003. Colorado, USA.
Lee Long W.J., Mckenzie L.J., Rasheed M. A. and Coles R.G. (1996). Monitoring
Seagrasses in Tropical Ports and Harbours. In Kuo J., Phillips R. C., Walker
D.I. and Kirkman H. (eds). Seagrass Biology: Proceedings of an
International Workshop Rottnest Island, Western Australia. 25-29 January
1996. Faculty of Science, University of Western Australia, Nedlands.
345-350.
Levings C. D., North M. S., Piercey G. E., Jamieson G. and Smiley B. (1999).
Mapping Nearshore and Intertidal Marine Habitats with Remote Sensing and
GPS: The Importance of Spatial and Temporal Scales. OCEANS; 99
MTS/IEEE. 3, 1249 – 1255.
Lotze, H.K., Lenihan, H.S., Bourque, B.J., Bradbury, R.H., Cooke, R.G., Kay, M.C.,
Kidwell, S.M. Kirby, M.X., Peterson, C.H. and Jackson, J.B.C. (2006).
Depletion, Degradation and Recovery Potential of Estuaries and Coastal Seas.
Science 312: 1806-1809.
Lucieer V. L. (2008). Object-oriented Classification of Sidescan Sonar Data for
Mapping Benthic Marine Habitats. International Journal of Remote Sensing.
Lyons M. B., Phinn S. R. and Roelfsema C. M. (2011). Intergrating Quickbird
Multi-Spectral Satellite and Field Data: Mapping Bathymetry, Seagrass Cover,
Seagrass Species and Change in Moreton Bay, Australia in 2004 and 2007.
Remote Sensing. 2011; 3(1):42-64.
Lyons M. B., Phinn S. R. and Roelfsema C. M. (2010). Long Term Monitoring of
Seagrass Distribution in Moreton Bay, Australia, from 1972-2010 Using
Landsat MSS, TM, ETM+. International Geoscience and Remote Sensing
Symposium Proceedings. 30th IEEE International Geoscience and Remote
Sensing Symposium (IGARSS 2010), Honolulu, HI, United States,
(5-8). 25-30 July 2010.
Lyzenga D.R. (1981). Remote Sensing of Bottom Reflectance and Water Attenuation
Parameters in Shallow Water using Aircraft and Landsat Data. International
Journal of Remote Sensing. 2 (1), 71-82.
Lyzenga D. R. (1978). Passive Remote Sensing Techniques for Mapping Water
Depth and Bottom Features. Applied Optics. 17, 379 – 383.
Ma Z. and Redmond R.L. (1995). Tau Coefficient for Accuracy Assessment of
Classification of Remote Sensing Data. Photogrammetric Engineering and
Remote Sensing, 61, 435 – 439.
Malnar N., Landek I., Grubic I. (2008). Protected Coastal Area (PCA): Why? How?.
The International Archives of Photogrammetry, Remote Sensing and Spatial
Information Sciences, Vol. XXXVII, Part B8. 2008. Beijing.
McKenzie L. (2008). Seagrass Educators Handbook. Seagrass-Watch. February
2008.
Miller R. L., Castillo C.E.D. and McKee B. A. (2005). Remote Sensing of Coastal
Aquatic Environments: Technologies, Techniques and Applications (pp. xvii).
Mumby P. J., Green E. P., Edwards A. J. and Clark C. D. (1997). Measurement of
Seagrass Standing Crop using Satellite and Digital Airborne Remote Sensing.
Marine Ecology. 159, 51-60.
National Hydrographic Center (1999). Hydrographic Chart 1:30,000 Tanjung
Pelepas Port – Sheet No MAL 5123.
National Hydrographic Center (1996). Hydrographic Chart 1:200,000 Teluk
Mahkota – Pulau Tioman – Sheet No MAL 625.
National Ocean Service. Retrieved on October 2012, from
Newman C. M. and LeDrew E. F. (2001). Assessment of Beer’s Law of Logarithmic
Attenuation for Remote Sensing of Shallow Tropical Waters
Nim C.J. and Skirving W. (2010). Satellite Monitoring of Reef Vulnerability in a
Changing Climate. NOAA Technical Report CRCP 1. NOAA Coral Reef
Conservation Program. Silver Spring, MD. pp 72.
Norris J. G., Wyllie-Echeverria S., Mumford T., Bailey A. and Turner T. (1997).
Estimating Basal Area Coverage of Subtidal Seagrass Beds using Underwater
Videography. Aquatic Botany 58 (1997) 269-287.
Phang S.M. (2006). Seaweed Resources in Malaysia: Current Status and Future
Prospects. Aquatic Ecosystem Health & Management. 9 (2), 185–202.
Taylor and Francis Group.
Phang S.M., Wee Y. C. (1991). Benthic Marine Algae. In: R. Kiew (Ed). The State of
Nature Conservation in Malaysia. 51-56. Malayan Nature Society. Kuala
Robinson I.S. (2004). Measuring the Oceans from Space: The Principles and
Methods of Satellite Oceanography. 11-26. United Kingdom: Springer and
Praxis Publishing.
Rossiter D. G. (2001). Assessing the Thematic Accuracy of Area-class Soil Maps.
Unpublishe
Sagawa T., Mikami A., Komatsu T., Kosaka N., Kosako A., Miyazaki S. and
Takahashi M. (2008). Mapping Seagrass Beds using IKONOS Satellite Image
and Side Scan Sonar Measurements: A Japanese Case Study. International
Journal of Remote Sensing. 29, 281-291.
Sagawa T., Boisnier E., Komatsu T., Mustapha K.B., Hattour A., Kosaka N. and
Miyazaki S. (2010). Using Bottom Surface Reflectance to Map Coastal
Marine Areas: A New Remote Sensing Method. International Journal of
Remote Sensing. 31:12, 3051-3064.
Schimel A. C. G., Healy T. R., Johnson D. and Immenga D. (2010). Quantitative
Experimental Comparison of Single-beam, Sidescan and Multibeam Benthic
Habitats Maps. ICES Journal of Marine Science. 67, 1766 – 1779.
Smithsonian Environmental Research Center. Retrieved on September 2009,
from
Thangaradjaou T., Sridhar R., Senthilkumar S. and Kannan S. (2007). Seagrass
Resource Assessment in the Mandapam Coast of the Gulf of Mannar
Biosphere Reserve, India. Applied Ecology and Environmental Research
6(1), 139-146.
U.S. Army Corps of Engineers (2008). General Mapping Guidelines for Terrestrial
Invasive Plant Species. Public Works Technical Bulletin. 1 July 2008.
Vanderstraete T., Goossens R. and Ghaboir T. K. (2004). Coral reefs Habitat
Mapping in the Red Sea (Hurghada, Egypt) Based on Remote Sensing.
EARSel eProceedings. 3 (2).
Walker D. I. and Kendrick G.A. (2006). Decline and Recovery of Seagrass
Ecosystems – The Dynamics of Change. In Larkum A.W.D, Orth R.J and
Duarte C.M (eds). Seagrass: Biology, Ecology and Conservation. 551 – 565.
Netherlands: Springer.
Yamamuro M., Nishimur K., Kishimoto K., Nozaki K., Kato K., Negishi A., Otani
K., Shimizu H., Hayashibara T., Sano M., Tamaki M. and Fukuoka K.
(2002). Mapping Tropical Seagrass Beds with an Underwater Remotely
Operated Vehicle (ROV). Proceedings of Techno-Ocean 2002 International
Symposium.
Zimmermann N.E. (2001). SimTest. Swiss Federal Research Institute WSL,
Birmensdorf, Switzerland. Retrieved on May 2011 from,