ABSTRACT
COOK, ELIZABETH SUZANNE BOYETTE. Differential Phenotypes in Response to Developmental Leflunomide Exposure. (Under the direction of Dr. Carolyn
Mattingly).
Zebrafish are a powerful animal model for toxicological studies; however, due
to various factors, there is much genetic variation, which could lead to confounding
results. This project investigated the effects of exposure to the pharmaceutical,
leflunomide (lef), on zebrafish embryos. Lef is a drug commonly used to treat
rheumatoid arthritis. Its therapeutic effects are attributed to its metabolite,
teriflunomide (ter), which inhibits an enzyme important in de novo pyrimidine
biosynthesis and T cell function. In addition, lef activates the aryl hydrocarbon
receptor (AhR), a receptor important for drug metabolism but also implicated in the
toxicity of some of its ligands. Due to neurological disturbances by other AhR
ligands, we hypothesized that lef would induce behavioral changes in zebrafish
larvae. After exposure to lef for 5 days, larvae were found to be hypoactive in the
dark when compared to controls and this effect was not abrogated by a mutation of
the aryl hydrocarbon receptor 2 (ahr2) gene. In the future, we will use fish with
additional knockouts to determine whether the behavioral toxicity is mediated
through other AhR paralogs.
Previous studies have shown that lef also interferes with neural crest cell
function, leading to a lack of melanin. Concurrent with behavioral studies, we noticed
that lef exposure delayed the onset of melanin in some, but not all, embryos within a
clutch. This delayed onset of melanin was not recapitulated in ter-exposed embryos.
embryos lacking melanin vs. those with melanin. These data suggest that lef may
interfere with melanin synthesis via the AhR pathway.
These findings provide novel insights into a) the role of the AhR pathway in
the modulation of neural crest cell migration by lef, b) the complex and diverse
effects of exposure to AhR ligands, c) a cautionary tale about potential neurological
phenotypes of developmental exposure to lef, and d) the importance of considering
© Copyright 2017 Elizabeth Cook
Differential Phenotypes in Response to Developmental Leflunomide Exposure
by
Elizabeth Suzanne Boyette Cook
A thesis submitted to the Graduate Faculty of North Carolina State University
in partial fulfillment of the requirements for the degree of
Master of Science
Comparative Biomedical Sciences
Raleigh, North Carolina
2017
APPROVED BY:
__________________________ __________________________ Carolyn Mattingly, PhD Antonio Planchart, PhD
Committee Chair
ii
DEDICATION
I would like to dedicate this thesis to my parents, David and Dianne Boyette.
They have been instrumental in my educational success through their unconditional
iii
BIOGRAPHY
Elizabeth Cook was born and raised in Raleigh, North Carolina. She attended
Meredith College for her undergraduate degree where she received her Bachelor of
Science in Biology. From there she worked one year at a pharmaceutical company,
Hospira, where she was responsible for creating an organized system for receiving
and distributing batch records for chemical testing of the drugs which were
manufactured. After her brief stint at Hospira, she began her graduate degree at
North Carolina State University where she hopes to receive her Masters of Science
in Comparative Biomedical Sciences while working under the supervision of Carolyn
iv
ACKNOWLEDGMENTS
I would like to acknowledge my advisors, Carolyn Mattingly and Antonio
Planchart. Through their guidance and direction, in addition to allowing me the
freedom to think for myself, they have shaped my scientific mind. I am thankful to my
committee for the time and effort they’ve given towards guiding my project. I would
also like to thank the past and present members of the Planchart-Mattingly lab
including D. Chris Cole, Stefanie Denning, Adrian Green, Carson Heck, Carson
Lunsford, and Lindsey St. Mary.
I am also overwhelmingly grateful for Andrew Cook, my husband, and his
v
TABLE OF CONTENTS
LIST OF FIGURES ... vi
LITERATURE REVIEW ... 1
1.1 Aryl Hydrocarbon Receptor ... 1
1.2 Lef Background ... 4
1.3 Lef and Dihydroorotate dehydrogenase (DHODH) ... 8
1.4 Behavior ... 9
1.5 Zebrafish ... 9
EXPOSURE TO LEFLUNOMIDE INDUCES A HYPOACTIVE PHENOTYPE IN LARVAL ZEBRAFISH ... 12
2.1 Introduction ... 12
2.2 Methods ... 12
2.3 Results ... 15
2.4 Conclusions ... 17
THERE IS A DIFFERENTIAL SUSCEPTIBILITY TO THE LEFLUNOMIDE-MEDIATED DELAY IN ONSET OF MELANIN IN ZERBAFISH POPULATIONS .... 24
3.1 Introduction ... 24
3.2 Methods ... 25
3.3 Results ... 26
3.4 Conclusions ... 31
vi
LIST OF FIGURES
Figure 1. The aryl hydrocarbon receptor pathway activation by ligand. ... 2
Figure 2. Diagrams reporting originally identified (top) and more recently
discovered (bottom) lef metabolites. ... 7
Figure 3. Lef exposure alters behavior. ... 19
Figure 4. Lef exposure produces two different behavioral responses. ... 20
Figure 5. Total distance moved by lef-exposed wild type larvae in the first dark period of a light-dark behavioral assay. ... 21
Figure 6. Total distance moved by lef-exposed AhR2-null larvae in the first dark period of a light-dark behavioral assay. ... 22
Figure 7. Lef exposure affects dopaminergic cells. ... 23
Figure 8. Lef exposure causes a delay in the onset of melanin in some
embryos and this delay in melanin is correlated with increased toxicity at 5 dpf. ... 35
Figure 9. Lef, but not ter, exposure causes a delay in the onset of melanin in a dose dependent manner.. ... 36
Figure 10. Exposure of Tg(sox10:eGFP) embryos to lef causes craniofacial malformations in zebrafish larvae. ... 37
Figure 11. Differential melanin expression is coupled with differential
upregulation of cyp1a. ... 38
Figure 12. Lef-exposed AhR2-null fish are not more susceptible to a delay in the onset of melanin than WT. ... 39
Figure 13. The resistance to lef-induced lack of melanin is heritable. ... 40
1
LITERATURE REVIEW
There are more than 80,000 chemicals that have been registered for use with
the United States Environmental Protection Agency (EPA); however, very few of
those have been tested for neurotoxic effects [1]. The list of neurotoxic chemicals
includes categories such as heavy metals, endocrine disruptors, pesticides, and
industrial waste products. Some well-known examples of neurotoxicants include
lead, dichlorodiphenyltrichloroethane (DTT), phthalates, and benzo[α]pyrene (BaP)
[2-7].
1.1 Aryl Hydrocarbon Receptor
Our lab has a long-standing interest in the aryl hydrocarbon receptor (AhR) and
the effects of its aberrant activation during development. The AhR is classically
known as a xenobiotic sensor because many of its ligands are environmental
toxicants.
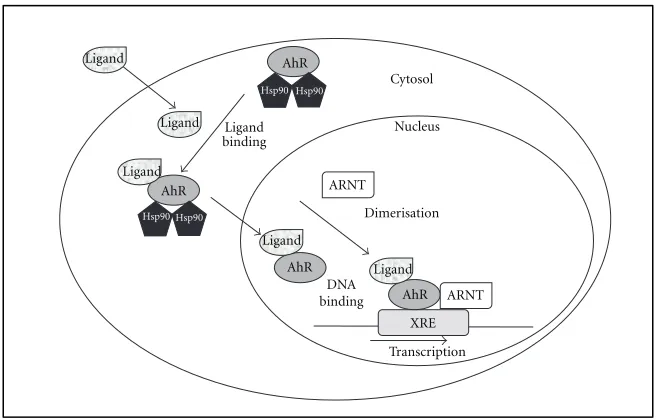
Upon ligand binding, AhR dissociates from its chaperone proteins and enters
the nucleus where it binds to the aryl hydrocarbon receptor nuclear translocator
(ARNT). Together, AhR and ARNT function as a transcription factor, initiating
transcription of target genes including several that are important for drug
metabolism, such as genes encoding cytochrome P450 enzymes (CYPs) [8, 9] (Fig.
2
Drosophila proteins, period circadian protein (PER) and single-minded protein (SIM) [10]. AhR is the only member yet to be identified as ligand-activated [11]. The
AhR/ARNT complex binds the xenobiotic response element (XRE), consisting of a
core pentanucleotide (5’-GCGTG-3’) located upstream of promoters regulated by
AhR/ARNT [12]. Binding of XREs by AhR/ARNT results in changes in expression of
the associated gene.
Figure 1. The aryl hydrocarbon receptor pathway activation by ligand.
CYPs are responsible for 95% of phase I metabolism of nearly all marketed
drugs [13]. There are 57 human CYPs but only 5 of them are involved in drug
metabolism. CYPs are either involved in detoxification of drugs, making them ready
for excretion, or their conversion into an active form. One example of this is the
CYP-mediated conversion of the carcinogen, BaP. BaP is metabolized in the human
2 International Journal of Breast Cancer
Cytosol XRE Transcription AhR ARNT Dimerisation DNA binding ARNT AhR AhR Ligand Ligand Ligand Ligand Ligand Hsp90 Hsp90 Hsp90 Hsp90 AhR bindingLigand Nucleus
Figure1: The aryl hydrocarbon signaling pathway.
complex and to AhR nuclear translocation. Within the nucle-us, AhR interacts with ARNT forming a heterodimer that binds to specific DNA sequences called xenobiotic response elements (XREs). This binding leads to the transcriptional activation of genes that possess these XREs in their promoter sequences. Some of the genes activated by AhR encode phase I and II metabolic enzymes such as cytochrome P450 (CYP) 1A1, CYP1A2, and CYP1B1. AhR activation was first described as a cellular response to promote elimination of ambient contaminants and xenobiotics [8–10]. In humans, AhR is localized in liver, lungs, kidneys, placenta, lympho-cytes, ovary, and breast. AhR/ARNT complex activation is tissue-specific and depends on co-regulators present in dif-ferent cell types [9].
3. Estrogen Receptor-Aryl Hydrocarbon Receptor Crosstalk
It was demonstrated that in breast cancer cells, AhR ligands have the capacity to bind to ER and potentially interfere with ER signaling [11]. Also, it has long been known that estrogen can be metabolized by AhR-driven genes such as CYP1B1 to yield toxic metabolites that in some cases have been proposed to act as genotoxins [12]. This has led to the hypothesis that mutual modulation of AhR and ER signaling functions may be possible. Indeed, previous publications have shown that certain AhR ligands can have antiproliferative effects alone or in conjunction with ER antagonist administration with evidence of antitumor activity in breast cancer models [13]. How estrogen and its antagonist will agonize, have no effect, or amplify AhR-related signaling functions is a key unresolved question.
zoles (Bzs) [14–18] and aminoflavone (AF) [19], which are noteworthy for differential cytotoxicity. “Sensitive” cell lines have total growth inhibition (TGI) between 0.1 and 1µM, while “resistant” cell lines are refractory to Bz and AF concentrations<10µM. Among the consistently sensitive cell lines to both compound classes were the ER(+) breast cancer cell lines MCF-7 and T47D [18,19]. While certain other cell types in this screen did show susceptibility, for example, renal cancer, in the breast cancer panel, optimal cytotoxicity of these drugs was seen in cell lines expressing estrogen receptor (ER(+)) [18]. Detailed mechanistic studies for both Bzs and AF have revealed that “sensitive” cells can activate AhR signaling, as might be expected from their planar nature [20]. This causes expression of CYP1A1 and in certain cell lines CYP1B1. Prior work had shown that CYP1A1 can metabolize Bzs and AF to produce DNA-damaging metabolites [14–19].
5. Benzothiazoles’ Mechanism of Action
Previous results from our research group have demonstrated that the antitumor effect of compounds of the 2-(4-amino-3-methylphenyl) benzothiazole group (DF 203, NSC 674495; 5F 203, NSC 703786) (Figure 2) is mediated by AhR in MCF-7 breast tumor cells [15,17,21]. Currently Phortress, the lysine amide prodrug of 2-(4-amino-3-methylphenyl)-5-fluorobenzothiazole (5F 203), is under Phase I clinical evaluation sponsored by the Cancer Research UK [21–29].
DF 203 preceded 5F 203 in the development of Phortress. A fluorine atom was introduced to thwart deactivating metabolism of DF 203 by CYP1A1 to inactive hydroxy-lated biotransformation products [23]. We observed that treatment of MCF-7 with Bzs resulted in activation of
3
liver into eight different metabolites by various CYPs. Some CYPs have the ability to
activate BaP, leading to a toxic metabolite, and other CYPs detoxify BaP [14]. The
amount of toxic metabolite of BaP is affected by the concentrations of the different
CYPs within the liver; these concentrations can be affected by SNPs in the
corresponding gene and their induction or inhibition by other exogenous or
endogenous compounds. CYPs can be induced through mechanisms other than the
AhR pathway. For example, in humans, CYP1A1 and CYP1A2 can be
transcriptionally regulated through the constitutive androstane receptor [15].
The AhR pathway is regulated by diverse mechanisms. One mechanism is by
induction of the aryl hydrocarbon receptor repressor (AhRR) by the AhR/ARNT
complex. AhRR competes with ARNT for AhR but the AhR/AhRR complex is not
transcriptionally active so the pathway is shut down [16-18]. An additional
mechanism includes the AhR/ARNT-mediated upregulation of genes involved in
drug metabolism, leading to a decrease in the amount of ligand present, acting as a
negative feedback mechanism due to decreasing levels of ligand present to activate
the AhR. Lastly, it has been reported that compounds such as TCDD are able to
induce the degradation of AhR through its ubiquitination and proteosomal
degradation [19].
The majority of compounds that activate AhR are polycyclic aromatic
hydrocarbons (PAHs) [20]. The AhR pathway has been implicated in processes such
as drug metabolism, immunity, development, and behavior [21-23]. The role of AhR
4
Both BaP and 2,3,7,8-tetrachlorodibenzo-p-dioxin (TCDD) are agonists of the
AhR that produce neurotoxic phenotypes, such as cytotoxicity of neurons [2, 24].
TCDD, BaP, and FICZ, the tryptophan metabolite that is one of a few identified
endogenous AhR agonists, all induce a novelty-induced fear response towards food
items in mice [25, 26]. BaP exposure in mice leads to decreased motor activity and
sensitivity to sensory stimuli, such as tail pinch and click response [27, 28]. TCDD
exposure in rats leads to increases in tyrosine hydroxylase (Th) mRNA expression
and the number of dopaminergic neurons of the midbrain via AhR/ARNT binding to
the XRE III site upstream of the Th promoter [29, 30].
After a battery of screening experiments we became interested in leflunomide
(lef), a pharmaceutical, which is a known ligand of AhR [31-33].
1.2 Lef Background
Lef is a pharmaceutical used for the treatment of rheumatoid arthritis (RA), a
disease characterized by inflammation in the synovial tissue of joints. Lef is a
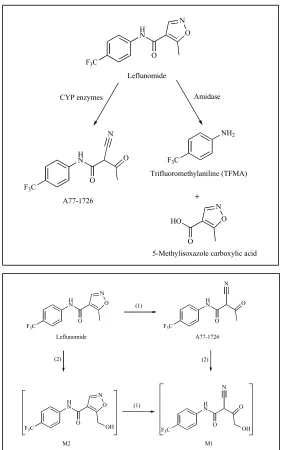
pro-drug that contains an isoxazole ring, which is cleaved by CYPs to produce the
metabolite, teriflunomide (ter). This conversion is thought to be rapid and mediated
by CYP1A2, CYP2C19, and CYP3A4 [34].
Lef is normally prescribed at a dose of 10-20 mg per day and has a half-life of
approximately two weeks. The most frequent adverse events reported during clinical
trials involving lef were diarrhea, elevated liver enzymes, alopecia, skin rash,
5
may become pregnant due to its teratogenic effects [36, 37]. The teratogenic effects
of lef include craniofacial malformations such as cleft palate, neural tube defects, tail
deformities, and skeletal malformations [38].
Lef-induced toxicity has been correlated with single nucleotide polymorphisms
(SNPs) in genes involved in the drug’s metabolic pathway. One study reported an
association between a SNP in the CYP1A2 gene and higher metabolic activity of the
enzyme. It is unknown if this SNP, which is in a non-coding region, leads to
differential binding of transcriptional regulatory proteins or if it is in linkage
disequilibrium with other mutations that affect the inducibility of the enzyme. This
SNP is associated with a 9.7-fold increased risk of toxicity, including diarrhea,
nausea, abdominal pain, puritis, and transaminase elevation following treatment with
lef [39, 40]. Another study showed the CYP2C19*2 loss-of-function allele correlated
with an increased risk for lef toxicity [41]. This CYP2C19*2 allele was also
associated with a lower ter plasma concentration indicating that the adverse effects
may be due to lef, but not its metabolite ter [39, 41].
Furthermore, lef-induced hepatocytotoxicity was prevented by the pan-CYP
inhibitor, 1-ABT; whereas, ter-induced toxicity in the same cells was not rescued by
1-ABT [42]. In addition, this study used liquid chromatography (LC)-mass
spectrometry (MS) analysis to show that the levels of ter detected in hepatocytes
after exposure to lef were lower than the levels of lef that were degraded, suggesting
an additional metabolite(s) other than ter which could produce some of the known
6
and MS revealed two additional hydroxylated lef metabolites, M1 and M2. M1 was
formed after incubation of microsomes with lef and ter; however, M2 was only
formed after incubation with lef suggesting it is synthesized from lef, not ter [43] (Fig.
2).
The fact that some SNPs in CYPs lead to increased activity of the enzyme
and others lead to loss-of-function while both may lead to lef-induced toxicity may be
confusing; however, lef can be transformed into different metabolites, some of which
7
Figure 2. Diagrams reporting originally identified (top) and more recently discovered (bottom) lef metabolites.
Drug Metabolism Letters,2007, 1,299-305 299
1872-3128/07 $50.00+.00 ©2007 Bentham Science Publishers Ltd.
In Vitro
Metabolism of Leflunomide by Mouse and Human Liver
Microsomes
Eric C.Y. Chan* and Lee-Sun New
Department of Pharmacy, Faculty of Science, National University of Singapore, 18 Science Drive 4, Singapore 117543
Abstract: Leflunomide was found to be metabolized predominantly to A77-1726 and two novel hydroxylated metabo-lites, M1 and M2, in microsomes while A77-1726 was only biotransformed to M1. M1 and M2 were proposed to be the hydroxylated -cyanoenol form of A77-1726 and the hydroxylated 5 methyl-isoxazole form of leflunomide, respectively.
Key Words: Leflunomide, A77-1726, microsomes, metabolic profiling, UPLC, QTOFMS.
INTRODUCTION
Leflunomide (LEF), N-[(4-Trifluoromethyl)phenyl]-5-methylisoxazole-4-carboxamide, is approved in the United States, the European Union and other countries around the world as an orally active disease-modifying anti-inflammatory agent for the treatment of advanced rheumatoid arthritis [1]. Interestingly, current research also explored LEF as a poten-tial anticancer agent [2-3]. The immunomodulatory function of LEF is mediated primarily through the effect of its bioac-tive metabolite termed A77-1726, 2-cyano-3-hydroxy-N- (4-trifluoromethylphenyl)-crotonamide. Orally administered LEF is almost completely converted into A77-1726 and the circulating concentrations of LEF are mostly below the limit of detection [1]. The research conducted on the biotransfor-mation of LEF to its bioactive metabolite, A77-1726, was extensive. In a recent study [4], a mechanism for the P450-mediated ring scission of LEF was proposed. According to Kalgutkar et al. [4], no other metabolite, besides A77-1726, was discernible in the rat and human microsomal reaction mixtures incubated with LEF. Another metabolite of LEF that had been mentioned in the literatures is trifluoromethy-laniline (TFMA) [5-6]. However, the research and discussion on TFMA was not substantial. Besides A77-1726 and TFMA, no other metabolite of LEF has been reported in the litera-tures to date. Fig. (1) shows the chemical struclitera-tures of LEF, A77-1726 and TFMA.
LEF has been associated with serious hepatotoxicity leading to serious liver failure and death. WHO issued an Alert (number 101) in March 2001 where the drug was asso-ciated with 129 cases of serious liver reactions, including 15 cases of liver failure and 9 cases with fatal outcome [6]. Be-sides liver injury, the other adverse reactions related to LEF include sepsis, haematological and respiratory reactions [7-8]. LEF’s toxic mechanism is unknown thus far. In contrast, it was demonstrated recently that LEF protects immobilized human hepatocytes and mice from mitochondria-mediated toxic cell injury induced by the known hepatotoxicant, acet-aminophen [9-10]. Other studies also indicated LEF’s cyto-protective effects on liver cells [11-12]. Although the hepa-toprotective mechanism of LEF had been proposed [9-10],
*Address correspondence to this author at Department of Pharmacy, Faculty of Science, National University of Singapore, 18 Science Drive 4, Singapore 117543; Tel: (65) 65166137; Fax: (65) 67791554;
E-mail: [email protected]
Fig. (1). Chemical structures of LEF and its known metabolites, A77-1726, trifluromethylaniline (TFMA) and 5-methylisoxazole carboxylic acid.
the chemical species responsible for this action remains un-known. While there is no evidence currently suggesting the relationship of LEF’s toxicity or hepatoprotective effect to its metabolism, an understanding of the metabolites of LEF is pertinent in the elucidation of its effects on hepatic me-tabolism. In our laboratory, in vitro metabolic profiling of LEF was performed using mouse (MLM) and human liver microsomes (HLM). In this paper, two hydroxylated metabo-lites of LEF formed via in vitro MLM and HLM incubation studies were described. To date and to the best of our knowl-edge, these metabolites of LEF have not been reported in the literature.
MATERIALS AND METHODS Chemicals
HPLC grade acetonitrile and methanol were purchased from Tedia Company Inc. (Fairfield, OH, USA). Ammonium acetate of 99% purity was obtained from VWR International Ltd. (Leicestershire, UK). Water was purified using a
Milli-H
N O
N
O F3C
Leflunomide
H
N O
O F3C
N
A77-1726
F3C
NH2
Trifluoromethylaniline (TFMA)
CYP enzymes Amidase
HO O
N
O
5-Methylisoxazole carboxylic acid
304 Drug Metabolism Letters, 2007, Vol. 1, No. 4 Chan and New
metabolic hydroxylation occurred at the isoxazole and -cyanoenol functional groups of LEF and A77-1726. To date, there is limited literature that discusses the metabolism of drug containing the isoxazole moiety except the hallmark metabolism of valdecoxib, a COX-2 inhibitor [14-15]. Simi-lar to LEF, valdecoxib contains a 5-methylisoxazole moiety. The major biotransformation pathway of valdecoxib was shown to involve the oxidation at the 5-methyl group of the isoxazole moiety to form a 5-hydroxymethyl metabolite. Based on our CID MS results indicating the hydroxylation of the isoxazole and -cyanoenol functional groups and the metabolism of valdecoxib, we proposed that M1 and M2 corresponded to the 5-hydroxymethyl metabolites of A77-1726 and LEF, respectively (Fig. 5). For both MLM and HLM samples, the elution profiles of M1 (RT 3.81 min) and M2 (RT 5.25 min) on the C18 column corresponded well with
their cLogP values of 0.85 and 1.41, respectively. Consider-ing the chromatographic selectivity based on C18 column
chemistry and taking into account the RT and cLogP values of LEF and A77-1726, the linear regression of cLogP values against RT of all four compounds (LEF, A77-1726, M1 and M2) demonstrated a positive correlation (r2 = 0.683) (Prism
4, GraphPad Software Inc., San Diego, CA, USA). This fur-ther supported our proposals on the chemical structures of M1 and M2.
QTOFMS Metabolic Profiling
To aid structural elucidation of M1 and M2, UPLC/ QTOF/MS/MS experiments were performed on both MLM and HLM incubation samples of LEF and A77-1726. For LEF and A77-1726 analysis, full scan experiments were per-formed whereas for M1 and M2, MS/MS experiments were conducted. The results on accurate mass, double bond equivalent (DBE, total number of rings and double bonds in a molecule) and i-FIT (the likelihood that the isotopic pattern of the elemental composition matches a cluster of peaks in the spectrum) measurements of the ions of LEF, A77-1726,
M1 and M2 and their associated key product ions are illus-trated in Table 1. As shown in Table 1, the mass accuracy of the majority of the measured parent and product ions of LEF, A77-1726, M1 and M2, was equivalent to or below 5 ppm. These data supported our proposal that M1 and M2 were the hydroxylated metabolites of LEF. The DBE values described the number of unsaturated bonds of M1, M2 and their asso-ciated product ions accurately. For example, for the product ions at m/z 98 of both M1 and M2, the DBE values remained at 3 (Table 1), suggesting an aliphatic hydroxylation that did not influence the aromaticity or unsaturation of these ions. The low i-FIT values (close to 1.0) of the measured ions fur-ther supported the proposed elemental composition of the two metabolites and ruled out other proposed compounds in the MassLynx software. Finally, the accurate mass meas-urement of the product ions of both M1 and M2 at m/z 98, supported our proposal that hydroxylation occurred at the -cyanoenol and isoxazole functional groups of A77-1726 and LEF, respectively.
In summary, the results supported the proposed structures of M1 and M2. Our findings suggested that M1 was structur-ally related to the isoxazole ring scission of M2 (similar to the relationship between A77-1726 and LEF). Since M1 was formed when both A77-1726 and LEF were incubated inde-pendently, we proposed that M1’s formation was potentially the result of dual pathways: (1) isoxazole ring scission of M2 and (2) direct aliphatic hydroxylation of A77-1726 (Fig. 5). This explained the 10-fold higher abundance of M1 when LEF was incubated in microsomes as both pathways were involved in its formation. In this study, two novel hydroxy-lated metabolites of LEF were detected and their preliminary structures were proposed. In order to confirm the chemical structures of these metabolites, further isolation followed by NMR analysis is necessary. While the nature of these me-tabolites in terms of toxicity and safety is unknown, our study shows the direction for future metabolism research of LEF.
Fig. (5). Proposed metabolism pathways of LEF to its two hydroxylated metabolites, M1 and M2. The pathways are namely, (1) isoxazole ring scission and (2) aliphatic hydroxylation.
H
N O
N
O
F3C
Leflunomide
H
N O
O
F3C
N A77-1726 (1) H N O N O
F3C OH
H
N O
O
F3C
N
OH
M2 M1
(2) (2)
8
1.3 Lef and Dihydroorotate dehydrogenase (DHODH)
Ter is an inhibitor of DHODH [44], an enzyme important for de novo pyrimidine (Y) biosynthesis. Most cells can use the salvage pathway for Y
biosynthesis, but T cells cannot. T cells infiltrate joints in patients with RA and cause
inflammation. Inhibition of DHODH by ter prevents T cell proliferation and reduces
inflammation. [45-47].
In addition to SNPs in CYPs being correlated with increased lef toxicity, the
DHODH A40C polymorphism has been linked to increased risk of discontinuation of
lef treatment due to adverse effects including diarrhea, nausea, weight loss, rashes,
and increased transaminase levels [48].
Other potential applications of lef include its use in the treatment of
melanoma. Melanocytes are derived from neural crest cells; when exposed to lef,
self-renewal of neural crest progenitor cells is abrogated. It was hypothesized that
DHODH inhibition by ter in these cells leads to reduced transcriptional elongation of
genes important for neural crest development. Lef has been proposed as a
treatment for melanoma due to its ability to inhibit DHODH and therefore inhibit
neural crest cell proliferation [49]. However, in contrast to the hypothesis that lef may
combat melanoma through DHODH inhibition, it was shown that AhR expression is
important for lef-mediated inhibition of melanoma cell growth [50]. Lef inhibited
growth of A375 melanoma cells and knockdown of AhR by short hairpin RNA
rescued this effect. In addition, this study showed that the anti-proliferative effects of
9
biosynthesis of pyrimidines, which would be expected if the effect of lef on
melanoma proliferation were solely due to DHODH inhibition.
1.4 Behavior
Exposure-mediated behavioral changes can be used as an indicator of
neurotoxic compounds. Numerous assays have been developed to assess specific
types of behaviors. For example, the anxiolytic-like effects of a compound on
mammals can be determined using behavioral assays such as the elevated plus
maze (EPM) and hole-board test (HBT) [51]. EPM is a test that is used to examine
the exploratory nature of rodents by quantifying how long they spend exploring an
elevated, open, and bright space [52], whereas, HBT measures anxiety by
quantifying how many times a rodent will dip its head in a hole [53]. Although there is
a range of methods and longer history for measuring complex behavior in rodents,
mammalian models are limited by the cost of upkeep and the numbers of chemicals
needing to be tested.
1.5 Zebrafish
Zebrafish are an excellent complementary model to measure neurotoxic
effects associated with chemical exposures [54]. Their many experimental
advantages include high fecundity (200 eggs/female), external and transparent
development, and ease of genetic manipulation. Around 70% of human genes have
10
Zebrafish have three paralogs of AhR, AhR1a, AhR1b, and AhR2, due to a
genome duplication in the teleost fish lineage approximately 400 million years ago
[56, 57]. Although TCDD-mediated toxicity is through AhR2, lef is able to activate all
three paralogs [58].
Numerous features/characteristics make the zebrafish particularly valuable for
studying neurodevelopment. To begin, the effects of chemicals on neurogenesis can
be studied with temporal ease; neurulation is complete after 24 hours of
development and the basic central nervous system (CNS) is formed by 5 days
post-fertilization [59]. In addition, zebrafish posses many of the same neurotransmitters
as mammals including dopamine, serotonin, noradrenaline, glutamate, histamine,
and GABA [60]. The architecture of the zebrafish brain is conserved with humans
and this model is being increasingly used to study neurodegenerative diseases such
as Parkinson’s [61] and Huntington’s [62-66]. Finally, zebrafish present an excellent
way to study neurogenesis or degeneration in vivo due to the many transgenic lines
that express fluorescent proteins in specific cell types [67-70].
Moreover, zebrafish also exhibit many of the same behavioral phenotypes as
mammals and these behaviors can be measured for toxicological purposes.
Increasing interest in the use of the zebrafish model for determining the neurotoxic
effects of xenobiotics has led to the compilation of a catalog describing many of the
behaviors displayed by zebrafish [71]. The different behavioral endpoints that can be
measured include locomotor changes, sensorimotor responses, and learning and
11
developmental neurobehavioral changes is to evaluate locomotor response in
zebrafish larvae at 5-6 days post fertilization (dpf) in response to alternating cycles
of light and dark within an enclosed system [73]. Zebrafish typically exhibit increased
12
EXPOSURE TO LEFLUNOMIDE INDUCES A HYPOACTIVE PHENOTYPE IN LARVAL ZEBRAFISH
2.1 Introduction
As was mentioned in section 1, ligands of the AhR, including TCDD and BaP,
are known to produce neurotoxic side effects. There is an XRE in the tyrosine
hydroxylase (Th) promoter and TCDD has been shown to upregulate Th through
induction of the AhR pathway [30]. TH is an enzyme important for the synthesis of
dopamine from tyrosine and alterations in this pathway lead to anxiety-like
phenotypes [74].
Given that lef binds and activates the AhR and other AhR ligands have led to
neurological defects, we hypothesized that lef-exposed zebrafish embryos would
exhibit behavioral abnormalities at 5 dpf.
2.2 Methods
Zebrafish maintenance and strains.
Zebrafish breeding and maintenance were carried out under standard
conditions at 28.5˚C in the embryos were housed in 0.5x E2 media [75]. Embryos
were staged according to Kimmel et al. [76]. The ahr2 knockout line, ahr2hu3335, was
developed by Targeting Induced Local lesions IN Genomes (TILLING) and was a
generous gift of Robert Tanguay (Oregon State University, USA). The line contains a
TTG to TAG point mutation in codon 534, which generates a LeuàSTOP premature
13
zebrafish line was a gift from Marc Ekker (University of Ottawa, Canada) [77]. This
transgenic fish expresses green fluorescent protein (GFP) under the control of the
dopamine transporter promoter. The fluorescent cells in these fish were imaged with
the Zeiss Light Sheet Z.1 microscope with a 488 nm laser and a 504-545 nm band
pass emission filter. The AB strain of zebrafish was used as the wild-type fish [78].
Chemicals and exposures
Stock solutions of lef (75 mM; Sigma Aldrich Catalog #L5025) and ter (75
mM; Sigma Aldrich Catalog # SML0936) were prepared in dimethyl sulfoxide
(DMSO). Working solutions for chemicals were prepared fresh on the day of
exposure by dilution in DMSO from 1000X secondary stock concentrations. Stock
solutions were stored at -20˚C.
Zebrafish adults were allowed to spawn and embryos were collected and
scored for viability based on developmental stage. Exposure media was replenished
daily. Embryos were checked daily for morphological differences and dead embryos
were removed. For behavioral assays, zebrafish embryos were exposed from six
hours post-fertilization (hpf) to five dpf with daily exchanges of exposure media.
Behavioral studies
At four dpf, after exposure replenishment, embryos were transferred, one per
well, to a 96-well (round wells), flat-bottom plate (Olympus #25-104). On the day of
the behavioral analysis, plates were transferred to the DanioVision observation
chamber (Noldus Information Technology, Leesburg VA) and embryos were allowed
14
infrared light sources that allow measurement of activity during both light and dark
conditions, respectively. Darkness is simulated by infrared light, which zebrafish
cannot see. Behavior was monitored during five alternating 20-minute cycles of light
(5.1 lux) and dark. Movement was sampled at a rate of 25 frames/second and
quantified for distance moved using Ethovision XT 10.0 software. Following testing,
larvae were examined under a dissecting microscope to identify fish that died or
exhibited abnormalities; these larvae were excluded from all analyses.
Quantitative reverse transcription polymerase chain reaction.
RT-qPCR analysis was performed on an Mx3000P Real-Time PCR system
(Stratagene) using the Brilliant SYBR Green qPCR reagent (Stratagene) according
to the manufacturer’s protocol. The cycling parameters were 95 °C for 10 min,
followed by 40 cycles of 95 °C for 30 s, 55 °C for 60 s, and 72 °C for 60 s. Threshold
cycles (Ct) and dissociation curves were determined with MxPro software
(Stratagene). Expression levels were normalized to glyceraldehyde-3-phosphate
dehydrogenase (Gapdh), which was invariant in every experiment performed
regardless of the age of embryos or exposure condition. Fold-change (FC) was
calculated using FC = 2−ΔΔCt where ΔΔCt = ΔCt,GOI−ΔCt,norm (GOI, gene of interest;
norm, Gapdh). All analyses were performed in triplicate. Primer sequences are as
follows: Tyrosine hydroxylase, TGCTGTTCAGCCATACCAAG-3’ (F) and
5’-CAGGCCTTTCTGGATCTTCA-3’ (R); gapdh, 5’-TGGGCCCATGAAAGGAAT-3’ (F)
15
Statistics
Statistical analyses were performed using JMP Pro 11 statistical analysis
software. The Shapiro-Wilk W test was used to determine the goodness-of-fit for the
behavioral data. A p-value <0.05 indicated a non-normal data set. A t-test was used
to determine statistical significance of the difference in means for the behavioral
data. A p-value <0.05 was used to determine statistical significance. Effect size was
represented by the Cohen’s d coefficient. Cohen’s d > 0.8 was used to consider the
effect size to be large.
2.3 Results
Light-dark zebrafish behavioral assay analysis produces varying results. In order to determine whether lef causes behavioral abnormalities, zebrafish
embryos were exposed to either 0.1% DMSO or 500 nM lef and evaluated using the
light-dark assay. In some circumstances, lef exposure lead to hypoactivity in the
dark as compared to controls (Fig.3a); however, in other experiments this lack of
movement was not seen (Fig. 3b). It became apparent that the results were not
reproducible even when the methods were repeated exactly the same way each
time To resolve the paradox, we pooled results across all experiments and plotted
data as shown in Figure 4. As seen, the control data are distributed normally
whereas the lef exposure data are bimodally distributed, indicating two different
16
A new method of the light-dark zebrafish behavioral assay analysis shows reproducible results in WT larvae.
Due to the variability in lef-mediated movement in the dark, we decided to
analyze these behavioral data differently. We previously noticed that some
experiments showed lef-exposed larvae were hypoactive in the first dark cycle but
responded similar to controls by the final dark cycle. This behavior was consistent
with learning. Therefore, we increased our starting number of larvae
(n=48/treatment) to obtain a better estimate of the population mean and only
analyzed the first dark cycle to control for possible habituation. Using this approach,
larvae exposed to lef were consistently hypoactive when compared with controls
(Fig. 5). Furthermore, data from the first dark cycle were normally distributed. It is
hypothesized that the non-normality determined by the previous analysis was due
habituation.
A new method of the light-dark zebrafish behavioral assay analysis shows reproducible results in ahr2-null larvae.
Since AhR has been shown to be important in mediating neurotoxicity of other
AhR ligands, we decided to see if lef produced a hypoactive phenotype in ahr2-null
larvae. Ahr2-null larvae were exposed to either DMSO or 500 nM lef for 5 days and
analyzed for behavioral changes as described above. Lef exposure caused
hypoactivity in the first dark period in Ahr2 null larvae suggesting that the behavioral
17
Lef exposure affects dopaminergic biology.
TCDD is known to increase the number of th immunoreactive neurons in mice
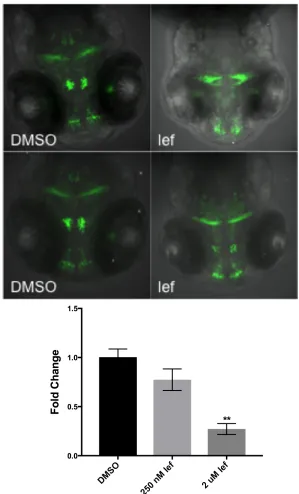
as well as induce the upregulation of Th mRNA [29]. We exposed our Tg(dat:EGFP)
zebrafish to 500 nM lef at 6 hpf and imaged them at 96 hpf to characterize the
effects of lef exposure on dopaminergic neurons. Lef exposure decreased the
number of EGFP+ neurons in the ventral diencephalon (Fig. 7 top). In addition, we
interrogated th mRNA expression at 48 hpf and found that there was a decrease in
th mRNA at 250 nM (0.8 fold change) and 2 µM lef (0.3 fold change) (Fig. 7 bottom). Lef exposure interferes with dopaminergic biology in zebrafish, although the mechanism may be different than other AhR ligands due to lef-exposure causing
downregulation of Th, whereas TCDD exposure causes upregulation of Th.
2.4 Conclusions
After acclimation and one light period, larvae that were exposed to lef were
hypoactive in the dark as compared to control fish; however, by the 5th cycle of light
and dark both treatment groups responded to the dark equally.
Habituation is a form of learning and refers to a decrease in the reaction to a
single stimulus over time as the stimulus is administered repeatedly [79]. The
lef-exposed larvae were hypoactive during the initial dark cycle but we hypothesize that
they learn over time and begin responding to the dark in a similar way as the control.
Contrary to our expectations, a mutation in Ahr2 causing a premature stop
18
hypoactivity could still be mediated through the activation of Ahr1a or Ahr1b instead
of Ahr2. In the future, we will use fish with additional knockouts to determine whether
the behavioral toxicity is mediated through other AhR paralogs.
In contrast to a TCDD-induced upregulation of Th in mice, lef exposure resulted in downregulation of th in zebrafish embryos. This could be attributed to the
difference in models as well as the difference in the structure of the two AhR ligands.
These data further prove the necessity to understand how activation of the AhR by
19
Figure 3. Lef exposure alters behavior. Lef (500 nM) reduced larval (5 dpf) response to the dark when compared with control in one experiment (A) but not the other (B). Both experiments used AB wild-type embryos (n=12 per experiment) with the same exposure regimen and assay parameters. Black bars represent dark intervals in a light-dark cycle. Ticks on x-axes represent 1-minute marks.
0" 500" 1000" 1500" 2000" A ve ra g e D is ta n ce Mo ve d (m m ) Time (minutes) DMSO
500 nM leflunomide
0" 500" 1000" 1500" 2000" A ve ra g e D is ta n ce Mo ve d (m m ) Time (minutes) DMSO
500 nM leflunomide
A
20
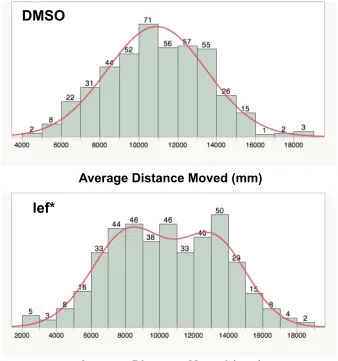
Figure 4. Lef exposure produces two different behavioral responses. Graphs represent histograms of average distance moved for DMSO-exposed (top) and lef-exposed (bottom). Numbers on top of bars represent total fish that swam in the corresponding interval for average distances moved as represented on x-axis. Histogram of average distance move for DMSO-exposed was normally distributed whereas histogram for lef-exposed was not normally distributed (*p-value <0.05, Shapiro-Wilk W-test).
DMSO
lef*
21
Figure 5. Total distance moved by lef-exposed wild type larvae in the first dark period of a light-dark behavioral assay. The lef-exposed larvae swam significantly less in the first dark period than the DMSO controls. n=184 larvae/treatment, *** p-value <0.001, t-test. Black lines represent mean +/- SEM. Cohen’s d = 0.54.
DMSO
500 nM
Lef
0 10000 20000 30000
To
ta
l D
is
ta
n
ce
M
o
ve
d
in
D
ar
k
(m
m
)
22
Figure 6. Total distance moved by lef-exposed AhR2-null larvae in the first dark period of a light-dark behavioral assay. The lef-exposed larvae swam significantly less in the first dark period than the DMSO controls. These data were normally distributed and analyzed using a t-test (n=133 larvae/treatment). *** p-value <0.001. Black lines represent mean +/- SEM. Cohen’s d = 0.67.
DMSO
500 nM
Lef
0 10000 20000 30000
To
ta
l D
is
ta
n
ce
M
o
ve
d
in
D
ar
k
(m
m
)
23
24
THERE IS A DIFFERENTIAL SUSCEPTIBILITY TO THE LEFLUNOMIDE-MEDIATED DELAY IN ONSET OF MELANIN IN ZERBAFISH POPULATIONS
3.1 Introduction
Similar to other lef-induced phenotypes, exposure resulted in a significant
reduction in melanin in some, but not all, embryos. In addition to binding and
activating the AhR, lef inhibits DHODH [44] and it is thought that this inhibition is
what leads to inhibition of neural crest cell self-renewal, and therefore loss of
melanocytes. However, in our preliminary studies, ter exposure had no effect on the
number and distribution of differentiated melanocytes as lef exposure. This
observation led us to believe that, contrary to a previous report [49], DHODH may
not be involved in the inhibition of neural crest cell self-renewal.
In addition to our preliminary observation, another lab has published that the
AhR is required for lef-mediated inhibition of melanoma cell growth [50]. This group
used a melanoma cell line with an inducible short hairpin RNA for AhR to show that,
when AhR expression was knocked down, lef was not able to inhibit T cell
proliferation.
We hypothesized that the variation in melanin phenotype in lef-induced fish
may be due to underlying genetic variation in the zebrafish population and is
25
3.2 Methods
Zebrafish maintenance and strains
See maintenance methods from chapter 2. The [Tg(-4.9sox10: EGFP)ba2]
(also known as Tg(sox10: EGFP)) line of zebrafish was generated by injecting 4.9
kB of DNA upstream of the sox10 transcriptional start site into the 1-cell stage of a
zebrafish embryo. These fish express EGFP under the control of the Sox10
promoter. This transgenic line was a gift from Thomas F. Schilling [80].
Epifluorescent images were taken using a LEICA MZFLIII microscope equipped with
an arc lamp and appropriate filters.
Chemicals and exposures
Refer to chapter 2 for chemical information.
Zebrafish adults were allowed to spawn, and embryos were collected, scored
for viability, and sorted by developmental stage. For all exposures, except for the
Tg(sox10:EGFP) exposures, exposure medium was replenished daily. The
Tg(sox10:egfp) embryos were exposed for 24 hours, washed with E2 medium, and
then reared in an incubator until 96 hpf. Embryos were checked daily for
morphological differences and dead embryos were removed.
Melanin scoring
The effect of a chemical on the production of melanin was scored by exposing
the embryos to the chemical at six hpf. Treatment was replenished at 24 hpf and at
32 hpf the number of embryos with and without melanin were counted and relative
26
DMSO control embryos have melanin by 32 hpf so comparisons could be made with
the chemical of interest. Images were taken with a LEICA MZFLIII microscope for a
visual representation of melanin at 48 hpf. This time point was chosen due to robust
melanin expression.
Quantitative reverse transcription polymerase chain reaction.
qRT-qPCR analysis was performed as described in Chaper 2. Primer
sequences are as follows: Tyr, 5’-CGGACACAACGACGGATACT-3’ (F) and 5’
CCAGATACGGCGTCAGGAA-3’ (R), Cyp1a, 5’-GGATATCAACGAACGCTTCA-3’
(F) and TTCTCATCGGACACTTGCAG-3’ (R), Gapdh
5’-TGGGCCCATGAAAGGAAT-3’ (F) and 5’-ACCAGCGTCAAAGATGGATG-3’ (R).
Statistics
Refer to chapter 2.
3.3 Results
Lef exposure delays the onset of melanin in some, but not all, embryos of a clutch.
Lef exposure has been shown to impede neural crest cell self-renewal [49].
Pigment-producing melanocytes are a lineage derived from the neural crest and lef
exposure causes a lack of melanin that can be easily visualized and quantified.
Consistent with variability observed in mediated behavior, we noticed that
27
matched DMSO-exposed counterparts had normal pigmentation. The presence of
melanin at 48 hpf inversely correlated with morphological toxicity at 5 dpf (Fig. 7).
Next, we exposed the embryos to increasing levels of lef and saw that as the
dose of lef increased, the amount of melanin decreased. The number of embryos
with melanin were counted at 32 hpf and presented as percent of embryos in a
clutch with melanin (Fig. 8 bottom) and the embryos were imaged at 48 hpf (Fig. 8
top). To rule out the possibility that in a group exposure design, embryos would be exposed to varying concentrations of lef, we repeated the experiment, except each
embryo was exposed individually in a 96-well plate. The same effect was observed,
which allowed us to conclude that the variation seen in a group exposure was not
due to some embryos being exposed to more lef than others as a function of location
in the petri dish (data not shown).
A previous report used a chemical screen and structural similarity analysis to
conclude that lef could interfere with neural crest cell migration and differentiation via
DHODH inhibition by its active metabolite, ter (Reference). To determine whether
lef-mediated reduction in melanin was due to ter, we exposed zebrafish embryos at
concentrations equivalent to our lef exposures as well as at a much higher dose (10
µM). Notably, ter exposure had no effect on melanin production at either
28
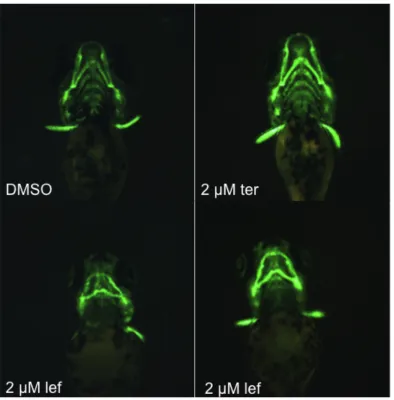
Exposure of Tg(sox10:EGFP) embryos to lef reveals craniofacial malformations in zebrafish larvae.
In order to tease out the mechanism through which lef-exposure delays
melanin synthesis, we decided to characterize the effects of lef exposure on sox10
expressing neural crest cells. The sox10 gene codes for a transcription factor that is
a common marker of neural crest cells [81]. Sox10 is expressed in multipotent neural
crest cells and is downregulated as the cells begin to differentiate [82].
Tg(sox10:EGFP) embryos were exposed to 0.1% DMSO, 2 µM lef, or 2 µM
ter. Embryos were visualized at 24 hpf and imaged at 96 hpf to look for
neurocristopathies (define this…). No major differences were seen at 24 hpf (data
not shown); however, while ter-exposed larvae were indistinguishable from
DMSO-exposed controls, lef-exposure caused aberrant jaw patterning (Fig.9). These data
show that lef exposure causes craniofacial malformations, most likely as a result of
interfering with neural crest cell proliferation.
Variability in melanin is reflected in expression levels of tyr and cyp1a. Tyrosinase (tyr) is an enzyme that catalyzes the production of melanin from
tyrosine. We explored whether the variability in melanin reflected changes in tyr
transcription expression levels. Embryos were exposed to DMSO or lef at 500 nM or
2 µM from six to 48 hpf. The percentage of embryos exhibiting pigmentation was
concentration-dependent, resulting in 100% of 500nM lef-exposed with melanin and
70% of 2 uM lef-exposed with melanin. We harvested RNA from pooled control
29
2 uM with and without melanin. Similar to pigmentation, tyr levels correlated with the
degree of pigmentation. Tyr expression was downregulated 0.7 fold in the 2 uM
lef-exposed melanin-positive embryos and 0.4 fold change in the 2 uM lef-lef-exposed ;
however, tyr downregulation was only significant in the 2 uM lef-exposed
melanin-negative embryos (Fig. 11a). Despite knowing that lef exposure results in a
downregulation of tyr, we still do not know if this is due to transcriptional regulation of
the gene or the lack of melanocytes altogether.
In addition, we investigated whether AhR activation, as measured by cyp1a
expression, was similarly variable. At 48 hpf cyp1a was upregulated in 500 nM (25
fold change) and 2 µM lef-exposed embryos with (100 fold change) and without
melanin (80 fold change); however, upregulation was significantly greater in the 2
µM lef-exposed embryos with melanin than without (Fig. 11b).
The link between the two remains unclear; however, there are differences in
expression of genes involved in the melanin synthesis pathway and the AhR
activation pathway.
A mutation in the ahr2 gene does not lead to increased susceptibility to lef-mediated delay in onset of melanin.
After discovering a difference in cyp1a upregulation between lef-exposed
embryos with or without melanin at 48 hpf, we hypothesized that the AhR pathway is
involved in regulating this phenotype. Since AhR2 is important for the conversion of
lef into ter through the upregulation of CYPs, AhR2 null fish would be less efficient at
30
percentages of embryos without melanin after exposure to lef. The ahr2-null line,
ahr2hu3335, was exposed to DMSO or 1 µM lef and scored for the presence of
melanin. The average percentage of AhR2 null embryos with melanin after exposure
to lef was not significantly different than the percentages of WT embryos (Fig. 12).
These data suggest that the AhR2 is not necessary for the lef-mediated delay in the
onset of melanin.
The leflunomide-induced lack of melanin is a heritable trait.
Since the 2 µM lef-exposed group that did not have melanin also had
changes in the expression of cyp1a and tyr when compared to the group that did
have melanin, we hypothesized that there was a genetic basis in susceptibility to lef
resulting in a variable melanin phenotype. We exposed embryos to 1 uM lef and at
48 hpf, we recorded the percentage of embryos with melanin, removed them, rinsed
them multiple times, and reared them to sexual maturity in the absence of lef. Next,
we intercrossed these individuals (F0) to determine whether we had selected for
resistance to lef-mediated reduction in melanin. Their offspring (F1) were then
exposed to 1 uM lef and at 32 hpf the percentage of embryos with melanin was
recorded and compared to the F0 generation. Among the F0 embryos, 72% were
melanin positive at 32 hpf compared to 92% in the F1 generation (Fig. 13). These
31
Scoring system for presence of melanin designed for future genomic sequencing assays.
In order to further characterize the genetic alterations between embryos that
are resistant to lef and the ones that are susceptible, we decided to sequence their
genomes. So far, the embryos had been classified as “with melanin” or “without
melanin”. However, for the purpose of discovery of genetic differences, we
developed a more granular scoring system for determining five levels of lef-mediated
delay in the onset of melanin. At 32 hpf, lef-exposed embryos are split into three
groups including “unpigmented”, “partially pigmented”, and “pigmented”. At 48 hpf,
the “partially pigmented” and “pigmented” groups are left alone due to their general
lack of change in pigment status. The “unpigmented” group from 32 hpf are split into
three groups again including “unpigmented”, “partially pigmented”, and “pigmented”.
This results in 5 distinct groups of melanin-based responses to lef; representative
images for each of these groups can be seen in Fig. 14.
3.4 Conclusions
Through this work we have shown that lef, not ter, causes a delay in the onset
of melanin in zebrafish. Ter, not lef, is able to inhibit DHDOH so these findings
suggest that the inhibition of DHODH by ter is not responsible for the delay in the
onset of melanin by lef.
One caveat to our research is that given that ter is structurally distinct from
32
has been shown to inhibit the proliferation of CD4+, CD8+, and CXCR5+ T-cells [83].
In the future, embryos could be exposed to lef and ter and stimulated with
lipopolysaccharide to illicit an immune response. Theses embryos could then be
homogenized to form a single cell suspension and flow cytometry could be used to
count the numbers of T-cells present in lef and ter when compared with controls.
Supporting the hypothesis that the AhR pathway is involved in the
lef-mediated delay in the onset of melanin, our work has shown that the embryos, which
were sensitive to the lef-induced delay in melanin, exhibited lower induction of cyp1a
than the ones that were resistant to the lef-induced delay in the onset of melanin.
Even though levels of cyp1a seem to correlate to the amount of melanin present
after exposure to lef, the mechanistic role of this enzyme in this phenotype is
unclear. The diminished levels of cyp1a in the lef-exposed embryos without melanin
could be due to SNPS in the cyp1a promoter in that group of embryos.
Furthermore, the delay in the onset of melanin due to lef exposure was not
exacerbated in Ahr2 null embryos as was expected. In the future, we will use fish
with additional knockouts to determine whether the melanin phenotype is mediated
through other AhR paralogs.
Using our Tg(sox10:EGFP) larvae we showed that lef exposure caused
craniofacial malformations in the jaw at 96 hpf. Similarly, TCDD causes these
craniofacial malformations [84] and it is mediated through activation of AhR [85].
These data suggest that the lef-induced delay in the onset of melanin is due to
33
alterations in the biosynthesis of melanin. Additionally, the AhR-mediated
TCCD-induced craniofacial malformations provides more evidence that the effects of lef
exposure on the neural crest is mediated through AhR, not inhibition of DHODH by
ter. In the future, we will repeat the Tg(sox10:EGFP) experiment, but inhibit AhR
activation during exposure, and look for craniofacial malformations at 96 hpf. We will
use mutants for all three of the different paralogs for zebrafish AhR to determine
which AhR is responsible.
Not all embryos of a clutch were equally susceptible to lef-mediated delay in
the onset of melanin. We attribute this to genetic diversity in zebrafish. Zebrafish are
an outbred animal model and have significant inter-individual genetic variation. One
study has examined the genomes of several different zebrafish strains (AB, Tu, and
WIK, n=80 per strain) and found high levels of intra- and inter-strain copy number
variants (CNVs) [86]. They also confirmed that the CNVs led to changes in the
gene’s expression. To confirm that the genetic differences between zebrafish might
contribute to the variation in the melanin phenotype, we intercrossed fish that had
been embryonically exposed to lef and found to be resistant to the lef-mediated
delay in onset of melanin. The percentage of embryos exposed to lef with melanin
was higher in the offspring of this intercross than in the offspring of naïve, wild-type
fish. These results led us to conclude that there are alleles segregating in some of
our fish that influence an embryo’s susceptibly to lef and we plan to sequence the
34
Leflunomide is in clinical trials to be used as a treatment for melanoma.
Further studies on the genetic differences in zebrafish that make them differentially
susceptible to lef-mediated alterations in the neural crest could provide insight into
35
36
Figure 9. Lef, but not ter, exposure causes a delay in the onset of melanin in a dose dependent manner. (A) Images are representative of 48 hpf embryos
continuously exposed to DMSO, lef, or ter. (B) Percent of embryos with melanin at 32 hpf under varying experimental conditions. n=3 experiments with 100
embryos/experiment, **p-value <0.05, One-way ANOVA with Tukey post hoc.
DMSO 500 nM lef 1 uM lef 2 uM lef
4 uM lef 1 uM ter 2 uM ter 10 uM ter
A
DMSO 500
nM Lef
1 µM Lef
2 µM Lef
1 µM Ter
2 µM Ter
10 µ M Te
r 0
50 100 150
Percent of embryos with melanin
**
37
38
Figure 11. Differential melanin expression is coupled with differential
upregulation of cyp1a. Graphs represent fold change for tyr (left) and cyp1a (right) at 48 hpf in response to lef-exposure. The 2 µM lef-exposed group was split into groups based on presence of melanin. Cyp1 is a gene classically known to be upregulated in response to AhR activation and the difference in upregulation (2 µM) indicates a difference in some part of the AhR pathway. n=3, *p-value <0.05
compared with DMSO, ***p-value <0.0001 compared with DMSO, # p-value <0.01, One-way ANOVA with Tukey post hoc.
DMSO 500 nM
2 uM w ith m
elanin
2 uM w ithou
t mela nin 0.0 0.5 1.0 1.5 Fold Change
*
DMSO 500 nM
2 uM w ith m
elanin
2 uM w ithou
39
Figure 12. Lef-exposed AhR2-null fish are not more susceptible to a delay in the onset of melanin than WT. Graph reports percent of embryos with melanin at 32 hpf. Embryos were homozygous for ahr2 mutation. n=3 experiments with 100 embryos/experiment, NS, One-way ANOVA with Tukey post hoc.
DMSO
1 µM Lef (A
HR)
1 µM Lef (W
T) 0
50 100 150
40
Figure 13. The resistance to lef-induced lack of melanin is heritable. Graph reports percent of embryos with melanin at 32 hpf. 1 µM lef group is naïve exposed WT and 1 µM lef (resistant) group is the offspring of fish that were selected for their resistance to lef-induced delay in melanin onset when exposed developmentally. They were reared to determine if the resistance could be passed to the next generation. n=3 experiments with 100 embryos/experiment, p-value <0.001, one way ANOVA with Tukey post hoc.
DMSO
1 µM Lef
1 µM Lef (r
esis tant) 60
70 80 90 100 110
Percent
41
Figure 14. Lef-exposed embryos are separated for genomic sequencing based on amount of melanin. The schematic above represents how the embryos are divided into groups based on the presence of pigment. On day 2, genomic DNA was extracted and will be sequenced to look for genetic variations that could affect the susceptibility to lef-induced delay in the onset of melanin.
Day 1
Day 2
Pigmented
Extract gDNA Pigmented Unpigmented
Extract gDNA
Partially pigmented Pigmented
Extract gDNA Unpigmented
Extract gDNA
Pigmented
42
References
1. Krewski, D., et al., Toxicity testing in the 21st century: a vision and a strategy. J Toxicol Environ Health B Crit Rev, 2010. 13(2-4): p. 51-138.
2. Chepelev, N.L., et al., Neurotoxicity may be an overlooked consequence of benzo[a]pyrene exposure that is relevant to human health risk assessment. Mutat Res Rev Mutat Res, 2015. 764: p. 64-89.
3. Gonzalez-Alzaga, B., et al., A systematic review of neurodevelopmental effects of prenatal and postnatal organophosphate pesticide exposure. Toxicol Lett, 2014. 230(2): p. 104-21.
4. Johnson, M.K., Organophosphorus esters causing delayed neurotoxic effects: mechanism of action and structure activity studies. Arch Toxicol, 1975. 34(4): p. 259-88.
5. Laessig, S.A., M.M. McCarthy, and E.K. Silbergeld, Neurotoxic effects of endocrine disruptors. Curr Opin Neurol, 1999. 12(6): p. 745-51.
6. Mason, L.H., J.P. Harp, and D.Y. Han, Pb neurotoxicity: neuropsychological effects of lead toxicity. Biomed Res Int, 2014. 2014: p. 840547.
7. Ross, S.M., et al., Neurobehavioral problems following low-level exposure to organophosphate pesticides: a systematic and meta-analytic review. Crit Rev Toxicol, 2013. 43(1): p. 21-44.
8. Beischlag, T.V., et al., The aryl hydrocarbon receptor complex and the control of gene expression. Crit Rev Eukaryot Gene Expr, 2008. 18(3): p. 207-50.
9. Callero, M.A. and A.I. Loaiza-Perez, The role of aryl hydrocarbon receptor and crosstalk with estrogen receptor in response of breast cancer cells to the novel antitumor agents benzothiazoles and aminoflavone. Int J Breast
43
10. Swanson, H.I., W.K. Chan, and C.A. Bradfield, DNA binding specificities and pairing rules of the Ah receptor, ARNT, and SIM proteins. J Biol Chem, 1995. 270(44): p. 26292-302.
11. Bersten, D.C., et al., bHLH-PAS proteins in cancer. Nat Rev Cancer, 2013. 13(12): p. 827-41.
12. Sogawa, K., et al., Location of regulatory elements responsible for drug
induction in the rat cytochrome P-450c gene. Proc Natl Acad Sci U S A, 1986. 83(21): p. 8044-8.
13. Saad, M., et al., Xenobiotic metabolism in the zebrafish: a review of the spatiotemporal distribution, modulation and activity of Cytochrome P450 families 1 to 3. J Toxicol Sci, 2016. 41(1): p. 1-11.
14. Sulc, M., et al., The impact of individual cytochrome P450 enzymes on oxidative metabolism of benzo[a]pyrene in human livers. Environ Mol Mutagen, 2016. 57(3): p. 229-35.
15. Yoshinari, K., et al., Constitutive androstane receptor transcriptionally
activates human CYP1A1 and CYP1A2 genes through a common regulatory element in the 5'-flanking region. Biochem Pharmacol, 2010. 79(2): p. 261-9.
16. Haarmann-Stemmann, T. and J. Abel, The arylhydrocarbon receptor repressor (AhRR): structure, expression, and function. Biol Chem, 2006. 387(9): p. 1195-9.
17. Hahn, M.E., L.L. Allan, and D.H. Sherr, Regulation of constitutive and inducible AHR signaling: complex interactions involving the AHR repressor. Biochem Pharmacol, 2009. 77(4): p. 485-97.