University of Windsor University of Windsor
Scholarship at UWindsor
Scholarship at UWindsor
Electronic Theses and Dissertations Theses, Dissertations, and Major Papers
2017
Solid-state NMR of Complex Nano- and Microcrystalline Materials
Solid-state NMR of Complex Nano- and Microcrystalline Materials
David Hirsh
University of Windsor
Follow this and additional works at: https://scholar.uwindsor.ca/etd
Recommended Citation Recommended Citation
Hirsh, David, "Solid-state NMR of Complex Nano- and Microcrystalline Materials" (2017). Electronic Theses and Dissertations. 7361.
https://scholar.uwindsor.ca/etd/7361
This online database contains the full-text of PhD dissertations and Masters’ theses of University of Windsor students from 1954 forward. These documents are made available for personal study and research purposes only, in accordance with the Canadian Copyright Act and the Creative Commons license—CC BY-NC-ND (Attribution, Non-Commercial, No Derivative Works). Under this license, works must always be attributed to the copyright holder (original author), cannot be used for any commercial purposes, and may not be altered. Any other use would require the permission of the copyright holder. Students may inquire about withdrawing their dissertation and/or thesis from this database. For additional inquiries, please contact the repository administrator via email
Solid-state NMR of Complex Nano- and Microcrystalline Materials
By
David A. Hirsh
A Dissertation
Submitted to the Faculty of Graduate Studies through the Department of Chemistry and Biochemistry
in Partial Fulfillment of the Requirements for the Degree of Doctor of Philosophy
at the University of Windsor
Windsor, Ontario, Canada
2017
Solid-state NMR of Complex Nano- and Microcrystalline Materials
by David Hirsh
APPROVED BY:
_____________________________ E. Munson, External Examiner
University of Kentucky
_____________________________ C. Weisener
Great Lakes Institute for Environmental Research
_____________________________ C. Macdonald
Department of Chemistry and Biochemistry
_____________________________ H. Eichhorn
Department of Chemistry and Biochemistry
_____________________________ R. Schurko, Advisor
Department of Chemistry and Biochemistry
iii
DECLARATION OF CO-AUTHORSHIP / PREVIOUS PUBLICATION
I am the primary author of all of the publications resulting from, and the text of this thesis. I performed all of the primary characterization experiments and interpretation of data described herein. However, each project was conducted in collaboration with researchers at other Universities and/or in Industry. Their contributions were the synthesis of the materials studied, acquisition of supporting characterization data (e.g., TEM, XRD, and ICP-MS results), and assistance in proof-reading. I also acknowledge the significant contributions of my supervisor, Professor R.W. Schurko, who aided in the analysis of spectroscopic data, planning of experiments, and writing.
I am aware of the University of Windsor Senate Policy on Authorship and I certify that I have properly acknowledged the contribution of other researchers to my thesis, and have obtained written permission from each of the co-author(s) to include the above material(s) in my thesis. I certify that, with the above qualification, this thesis, and the research to which it refers, is the product of my own work.
Two of the chapters in this thesis have been previously published in peer-reviewed journals:
Chapter 2: Hirsh, D. A.; Johnson, N. J. J.; Van Veggel, F. C. J. M.; Schurko, R. W. Chem. Mater. 2015, 27, 6495.
Chapter 5: Hirsh, D. A.; Rossini, A. J.; Emsley, L.; Schurko, R. W. Phys. Chem. Chem. Phys. 2016, 18, 25893.
I certify that I have obtained written permission from the copyright owners to include the above published materials in my thesis. I certify that the above material describes work completed during my registration as a graduate student at the University of Windsor.
iv
Chapter 3: Hirsh, D.A.; Zhang, X.; van Veggel, F.C.J.M.; Schurko, R.W.; Structural Characterization of NaYF4 Nanocrystals Containing
Paramagnetic Ln3+ Dopants.
Chapter 6: Hirsh, D.A.; Su, Y.; Stueber, D.; Schurko, R.W.; Quantifying Disproportionation in Pharmaceutical Formulations with 35Cl Solid-State NMR.
Chapters 4 and 7 are also being prepared for publication, and will be submitted in January/February 2018.
I declare that, to the best of my knowledge, my thesis does not infringe upon anyone’s copyright nor violate any proprietary rights and that any ideas, techniques, quotations, or any other material from the work of other people included in my thesis, published or otherwise, are fully acknowledged in accordance with the standard referencing practices. Furthermore, to the extent that I have included copyrighted material that surpasses the bounds of fair dealing within the meaning of the Canada Copyright Act, I certify that I have obtained a written permission from the copyright owner(s) to include such material(s) in my thesis.
v
ABSTRACT
The work in this thesis demonstrates the utility and broad applicability of solid-state nuclear magnetic resonance (SSNMR) spectroscopy to the study of complex materials containing mixtures of multiple structures and/or disparate local environments. Multinuclear SSNMR is particularly well-suited to the
characterization of such systems, and can provide a wealth of information that cannot be obtained with other instrumental methods. Studies involving two classes of materials are detailed herein, namely rare-earth nanoparticles and active
pharmaceutical ingredients.
The first three projects described involve the study of inorganic rare-earth (RE, RE = Y, Sc, La-Lu) nanoparticles (NP), which have unique optical and magnetic properties that are desirable for a diverse range of applications. Many of the properties of these materials are related to the incorporation of dopants into the host structures. The chemical reactions necessary to prepare these materials are complex and challenging to optimize; however, careful structural analysis of these materials is imperative to inform and to improve their rational design. Herein, we first use multinuclear (i.e., 19F, 23Na, 89Y, 1H, 13C, 45Sc) SSNMR to establish the molecular-level structure of a widely used undoped host material, β-NaYF4,
resolving a longstanding debate regarding the crystal structure. Similar
experiments are used to probe the structures of NaYF4 nanomaterials formed with
advanced core/shell structures containing multiple RE-materials and having oleates bound to their surfaces. Expanding on this foundation, the structural effects of the incorporation of paramagnetic dopant ions in NaYF4 NPs is described in a second
vi
NP cores and surfaces. The final project in this area pertains to a distinct class of zeolitic RE-doped nanomaterials, where the structural effects of different dopants are compared using numerous characterization techniques, including multinuclear SSNMR spectroscopy, powder X-ray diffraction (PXRD), transmission electron microscopy (TEM), and electron paramagnetic resonance (EPR) spectroscopy.
The second half of this thesis concerns a prominent class of materials found in everyday life, active pharmaceutical ingredients (APIs). The identification of solid forms of APIs plays an important role in drug development, both in the discovery of new forms and quality assurance in manufacturing. Herein, three important areas of pharmaceutical research are addressed using multinuclear SSNMR methods, with a primary focus on the application of ultra-wideline 35Cl SSNMR. (35Cl is a spin-3/2 quadrupolar nucleus). First, methods to improve the lower detection limit of Cl in low wt-% dosage formulations through the use of dynamic nuclear polarization (DNP) enhanced ultra-wideline 35Cl SSNMR spectra are presented. Next, a new method using 35Cl SSNMR for the quantification of APIs in dosage formulations with a high level of accuracy is detailed. In this proof-of-concept study, it is also shown how quantification methods can be used to measure the amount of disproportionation (i.e., conversion of cationic APIs to neutral free-base forms with distinct structures and properties) that occurs in a model dosage formulation. Finally, a case study of a variable hydrate HCl salt API is presented. Such materials form stable structures over a continuous range of non-stoichiometric hydration levels. This work demonstrates how 35Cl SSNMR is well-suited to characterize such materials, given the ability of this technique to probe the sites of hydration and detect changes in the hydrated Cl− anion environments as the material is dehydrated or rehydrated. For each of these projects, 35Cl SSNMR data are supported by additional multinuclear experiments (e.g., 1H, 2H, 13C, 19F,
vii DEDICATION
In memory of
William A. Hass, and Albert “Red” Hirsh May 8, 1986
viii
ACKNOWLEDGEMENTS
I would like to thank the many people who have made one of the many contributions to the production of this thesis. To those of you whom I have unintentionally omitted from the following, my negligence is inexcusable, yet certain, and for that I apologize.
I must begin by thanking my supervisor, Professor R.W. Schurko (or is it spelled Shurko, Sharko, or Roob?). Rob has helped me become an independent spectroscopist, encouraging me to pursue projects I was passionate about and helping me find new areas to explore. Though he rarely sets foot in the lab
anymore, Rob's supervising style still manages to be extremely hands-on. His care and attention to daily research developments made me feel like what I was doing mattered, and encouraged me to press on even when I got stuck. I have enjoyed the casual, yet productive work environment Rob fosters, and I think it helped
alleviate much of the stress that would have otherwise permeated my graduate career.
ix
Andrew Namespetra, to whom I am also indebted) laid a lot of the groundwork for my pharmaceutical studies.
Thank you to those who trained me on the spectrometer and in the theory of NMR. Dr. Bryan Lucier, who was the graduate student in charge of making sure I didn't break stuff. Thank you for teaching me to be efficient, careful, and to not be paralyzed by a fear of breaking stuff. Now, in the late stages of my PhD, I can appreciate the time you took during yours; I know I must have been a nuisance when all you wanted to do was finish up. To Professor Karen Johnston, thank you for helping me to become an independent spectroscopist; I vividly remember your telling me to acquire a 23Na nutation curve by myself and when I continued to ask you questions you ultimately told me that "you're going to have to learn how to do this by yourself at some point, might as well be today." Also, thank you for your companionship and constant support; sorry I asked so many questions, especially about my "team-written" CSC poster.
x
I am severely indebted to the many collaborators involved in the production of materials studied in this thesis, including students, faculty supervisors and industrial contacts. Their expertise has made this thesis possible and allowed me to learn about and study exotic materials I never would have been able to otherwise. Furthermore, thank you to Dr. Victor Terskikh for help acquiring high field data at the National Ultrahigh-field NMR Facility in Ottawa.
There are numerous members of the staff at the University of Windsor who have helped me extensively over the years. Matt Revington for support with the 500 MHz instrument, Joe Lichaa for technical support (especially with the PXRD equipment), Sinisia Jezdic for electronics repairs to probes and the VT stack. Finally the department secretaries, Marlene Bezaire (for going above-and-beyond her duties to help me, especially when I first moved to Windsor), Cathy Wilson (for her incredibly supportive and sincere concern for my well-being), and Beth Kickham (for her incredible schedule skills, and tolerance for bureaucracy).
Also, thank you to my committee members, for reading this thesis and challenging me to improve my understanding of my own work, and the field of chemistry as a whole.
I would also like to thank my family for their constant love and support (even when we are separated across different countries and continents). To Steph, thank you for taking this journey with me and accepting me despite/in spite of my faults. Your perseverance in the face of adversity has galvanized me to address my own burdens, which seem surmountable by comparison. There is no-one I would rather share in this accomplishment with.
xi
TABLE OF CONTENTS
DECLARATION OF CO-AUTHORSHIP / PREVIOUS PUBLICATION ... iii
ABSTRACT ...v
DEDICATION ... vii
ACKNOWLEDGEMENTS ... viii
LIST OF TABLES ... xvi
LIST OF FIGURES ... xix
LIST OF ABBREVIATIONS ... xxvii
LIST OF SYMBOLS ... xxxi
Chapter 1 : Introduction, Background, and Context ...1
1.1 Nuclear Magnetic Resonance Spectroscopy (NMR) ...1
1.1.1 Thence Spin ...2
1.2 NMR Interactions ...4
1.2.1 Quadrupolar Interaction (ĤQ) ...5
1.2.2 Chemical Shielding Interaction (ĤCS) ...10
1.2.3 Dipolar Interaction (ĤD) ...13
1.2.4 Paramagnetic Interaction (Ĥue) ...14
1.3 NMR Methods ...16
1.3.1 Single-Resonance Pulse Sequences ...16
1.3.2 Ultra-wideline NMR Techniques ...19
1.3.3 Double-Resonance Pulse Sequences ...21
1.3.4 Dynamic Nuclear Polarization (DNP) ...23
1.3.5 Additional Methods ...27
1.4 “Real-World” Materials ...28
1.4.1 Nanomaterials ...29
1.4.2 Active Pharmaceutical Ingredients ...33
1.5 References ...39
Chapter 2 : The Local Structure of Rare-Earth Fluorides in Bulk and Core/Shell Nanocrystalline Materials ...47
xii
2.2 Methods ...51
2.2.1 Chemicals ...51
2.2.2 Synthesis of sacrificial nanocrystals (SNCs) ...51
2.2.3 Synthesis of core−shell nanocrystals ...52
2.2.4 Synthesis of bulk NaYF4 and NaLuF4 powders ...53
2.2.5 Transmission Electron Microscopy ...54
2.2.6 Powder X-ray Diffraction ...54
2.2.7 Solid-State NMR ...54
2.3 Results and Discussion ...56
2.3.1 Transmission Electron Microscopy ...56
2.3.2 Powder X-ray Diffraction ...57
2.3.3 23Na MAS NMR ...59
2.3.4 23Na MQMAS NMR ...62
2.3.5 19F-89Y CP/MAS NMR ...63
2.3.6 19F MAS NMR ...65
2.3.7 19F UFMAS NMR ...67
2.3.8 1H-23Na and 19F-23Na CP/MAS NMR ...72
2.4 Conclusions ...76
2.5 References ...77
Chapter 3 : Structural Characterization of NaYF4 Nanocrystals Containing Paramagnetic Ln3+ Dopants ...80
3.1 Introduction ...80
3.2 Experimental Methods ...82
3.2.1 Chemicals ...82
3.2.2 Synthesis of NCs ...83
3.2.3 Synthesis of Bulk Materials ...83
3.2.4 Transmission Electron Microscopy (TEM) ...84
3.2.5 Powder X-ray Diffraction (PXRD) ...84
3.2.6 Inductively Coupled Plasma Mass Spectrometry (ICP-MS) ...84
3.2.7 SSNMR Characterization ...85
3.3 Results and Discussion ...86
3.3.1 Transmission Electron Microscopy (TEM) ...86
3.3.2 Powder X-ray Diffraction (PXRD) ...87
xiii
3.3.4 Solid-State NMR ...88
3.3.5 Effects of NC Dopant Level and Identity ...88
3.3.6 NC Surfaces ...98
3.3.7 Particle Size effects ...103
3.4 Conclusions ...107
3.5 References ...109
Chapter 4 : Multinuclear Solid-State NMR as a Probe of the Molecular-Level Structure in Rare Earth-Doped Yttrium Fluoride Nanoparticles ...112
4.1 Introduction ...112
4.2 Methods ...116
4.2.1 Chemicals ...116
4.2.2 Synthesis of the Yttrium Fluoride Nanoparticles (YF NPs) ...116
4.2.3 Purification of the Yttrium Fluoride Nanoparticles ...117
4.2.4 Transmission Electron Microscopy (TEM) Experiments ...117
4.2.5 Solid-State NMR (SSNMR) Experiments ...118
4.2.6 Powder X-ray Diffraction (PXRD) Experiments ...120
4.2.7 Electron Paramagnetic Resonance (EPR) Experiments ...120
4.3 Results and Discussion ...120
4.3.1 Undoped NP Material, YF ...120
4.3.2 Preparation of Samples with Other RE Elements ...125
4.3.3 Sc-Containing NPs ...126
4.3.4 Er-Containing Samples ...135
4.3.5 Eu-Containing Samples ...146
4.3.6 General Structural Discussion (All Dopants) ...153
4.4 Conclusions ...155
4.5 References ...157
Chapter 5 : 35Cl Dynamic Nuclear Polarization Solid-State NMR of Active Pharmaceutical Ingredients ...160
5.1 Introduction ...160
5.2 Methods ...164
5.2.1 Sample Preparation ...164
5.2.2 VT PXRD ...165
5.2.3 NMR ...165
xiv
5.3 Results and Discussion ...167
5.3.1 Histidine HCl ...167
5.3.2 Ambroxol HCl ...171
5.3.3 Isoxsuprine HCl ...173
5.3.4 Diphenhydramine HCl ...177
5.3.5 Cetirizine HCl ...180
5.4 Conclusions ...182
5.5 References ...185
Chapter 6 : Quantifying Disproportionation in Pharmaceutical Formulations with 35Cl Solid-State NMR ...190
6.1 Introduction ...190
6.2 Experimental Methods ...195
6.2.1 Chemicals ...195
6.2.2 Sample Preparation ...196
6.2.3 Solid-State NMR (SSNMR) Experiments ...198
6.2.4 Powder X-ray Diffraction (PXRD) Experiments ...199
6.3 Results and Discussion ...199
6.3.1 Pioglitazone HCl ...199
6.3.2 PiogHCl:NaSt mixture ...200
6.3.3 PiogHCl:MgSt Mixture ...204
6.3.4 Quantification of 35Cl SSNMR Spectra ...207
6.3.5 Quantification of Disproportionation ...211
6.4 Conclusions ...213
6.5 References ...216
Chapter 7 : In Situ Characterization of Water in a Channel Hydrate API using 35Cl SSNMR ...219
7.1 Introduction ...219
7.2 Methods ...223
7.2.1 Chemicals ...223
7.2.2 Sample Preparation ...223
7.2.3 Solid-State NMR Experiments ...224
7.2.4 NMR Tensor Calculations ...225
7.3 Results and Discussion ...226
xv
7.3.2 Thermogravimetric Analysis (TGA) ...228
7.3.3 35Cl SSNMR of GNE-A ...228
7.3.4 DFT-Calculations using CASTEP ...231
7.3.5 Variable-Temperature 35Cl NMR of GNE-A ...233
7.3.6 Characterization of Samples with Different Hydration Levels ...235
7.3.7 35Cl SSNMR of a Partially Deuterated sample ...238
7.3.8 Multinuclear NMR ...239
7.3.9 13C SSNMR ...239
7.3.10 1H SSNMR ...241
7.3.11 2H SSNMR ...243
7.4 Conclusions ...247
7.5 References ...250
Chapter 8 : Conclusions and Future Outlook ...253
8.1 General Overview ...253
8.2 Nanoparticles ...254
8.2.1 Future work - Nanomaterials ...255
8.3 Active pharmaceutical ingredients ...257
8.3.1 Future Work - APIs ...258
8.4 Final Thoughts ...260
8.5 References ...262
Appendix A : Supporting Tables and Figures for Chapter 2 ...263
Appendix B : Supporting Tables and Figures for Chapter 3 ...276
Appendix C : Supporting Tables and Figures for Chapter 4 ...289
Appendix D : Supporting Tables and Figures for Chapter 5 ...303
Appendix E : Supporting Tables and Figures for Chapter 6 ...316
Appendix F : Supporting Tables and Figures for Chapter 7 ...329
xvi
LIST OF TABLES
Table 2.1. Experimental 23Na EFG Tensor Parameters corresponding to Site 2.a 60
Table 2.2. Summary of Experimental 19F MAS NMR Parameters (ν
rot = 25 kHz, B0 = 9.4 T). ... 68 Table 2.3. Summary of Experimental 19F UFMAS NMR Parameters (νrot = 65
kHz, B0 = 11.7 T). ... 68 Table 3.1. Particle sizes of the NC NaYF4 samples obtained from TEM
measurements. ... 87 Table 3.2. Er and Tm content of the doped samples obtained from ICP-MS
measurements.a ... 88 Table 3.3. Experimental values of the span of the DS tensor (Δaniso) and
corresponding calculated nuclear-Ln3+ distances obtained from fits of the SSNMR data. ... 92 Table 4.1. Ionic radii of different RE ions with various coordination numbers as
reported by Shannon et al.63 ... 112 Table 4.2. Particle sizes measured using TEM (Figure C1). ... 118 Table 4.3. List of observed 19F, 89Y, and 1H NMR chemical shifts and peak
assignments for the undoped YF NP sample, as discussed in the text. ... 122 Table 4.4. List of observed 45Sc, 19F, 89Y, and 1H NMR chemical shifts and peak
assignments for the Sc-containing samples, as discussed in the text. ... 133 Table 4.5. List of observed 19F, 89Y, and 1H NMR chemical shifts and peak
assignments for the Eu-containing samples, as discussed in the text. ... 139 Table 4.6. Experimental values of the span of the DSA tensor (Δaniso) and
corresponding calculated nuclear-Ln3+ distances obtained from fits of the 19F and 1H SSNMR data. ... 140 Table 6.1. Sample masses used to prepare materials for quantification with 35Cl
SSNMR. ... 197 Table 6.2. Experimental and calculated amounts of PiogHCl in the standard
samples. ... 210 Table 6.3. Experimental and calculated amounts of PiogHCl in the stearate
mixture samples. ... 212 Table 7.1. Close H…Cl contacts (< 2.2 Å) for the two crystallographically distinct
Cl sites in GNE-A. ... 228 Table 7.2. Experimental and calculated 35Cl NMR tensor parameters of GNE-A.a
xvii
Table 7.3. Experimental T2eff(35Cl) constants obtained from the WURST-CPMG spectra of GNE-A acquired at different temperatures before and after heating in the magnet.a ... 235 Table 7.4. Experimental 2H EFG tensor parameters from the spectrum of
Rehydrate-D2O acquired at −125 °C.a,b ... 244
Table 2.1. Experimental 23Na EFG Tensor Parameters corresponding to Site 2.a 60
Table 2.2. Summary of Experimental 19F MAS NMR Parameters (ν
rot = 25 kHz, B0 = 9.4 T). ... 68 Table 2.3. Summary of Experimental 19F UFMAS NMR Parameters (νrot = 65
kHz, B0 = 11.7 T). ... 68 Table 3.1. Particle sizes of the NC NaYF4 samples obtained from TEM
measurements. ... 87 Table 3.2. Er and Tm content of the doped samples obtained from ICP-MS
measurements.a ... 88
Table 3.3. Experimental values of the span of the DS tensor (Δaniso) and
corresponding calculated nuclear-Ln3+ distances obtained from fits of the SSNMR data. ... 92 Table 4.1. Ionic radii of different RE ions with various coordination numbers as
reported by Shannon et al.63 ... 112 Table 4.2. Particle sizes measured using TEM (Figure C1). ... 118 Table 4.3. List of observed 19F, 89Y, and 1H NMR chemical shifts and peak
assignments for the undoped YF NP sample, as discussed in the text. ... 122 Table 4.4. List of observed 45Sc, 19F, 89Y, and 1H NMR chemical shifts and peak
assignments for the Sc-containing samples, as discussed in the text. ... 133 Table 4.5. List of observed 19F, 89Y, and 1H NMR chemical shifts and peak
assignments for the Eu-containing samples, as discussed in the text. ... 139 Table 4.6. Experimental values of the span of the DSA tensor (Δaniso) and
corresponding calculated nuclear-Ln3+ distances obtained from fits of the 19F and 1H SSNMR data. ... 140 Table 6.1. Sample masses used to prepare materials for quantification with 35Cl
SSNMR. ... 197 Table 6.2. Experimental and calculated amounts of PiogHCl in the standard
samples. ... 210 Table 6.3. Experimental and calculated amounts of PiogHCl in the stearate
mixture samples. ... 212 Table 7.1. Close H…Cl contacts (< 2.2 Å) for the two crystallographically distinct
xviii
Table 7.2. Experimental and calculated 35Cl NMR tensor parameters of GNE-A.a ... 230 Table 7.3. Experimental T2eff(35Cl) constants obtained from the WURST-CPMG
spectra of GNE-A acquired at different temperatures before and after heating in the magnet.a ... 235
Table 7.4. Experimental 2H EFG tensor parameters from the spectrum of
xix
LIST OF FIGURES
Figure 1.1 The effects of increasing external magnetic field strength (B0) on the
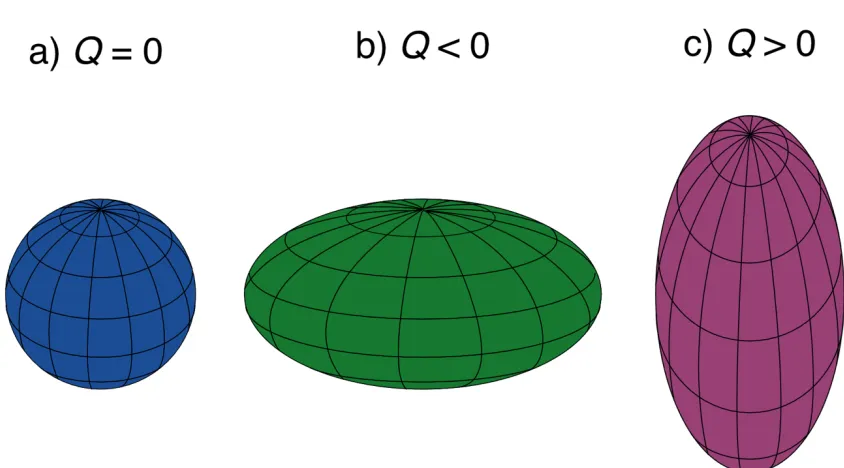
spin energy levels of a spin-3/2 nucleus. Allowed transitions between the non-degenerate spin states are labeled as satellite transitions (ST) and the central transition (CT), which have equal transition energies (∆" = ℏ%&0). ... 3 Figure 1.2 Representations of nuclei with spherical (Q = 0), and non-spherical
(oblate, Q < 0 or prolate, Q > 0) distributions of positive charge. ... 6 Figure 1.3 The effects of the a) Zeeman interaction, b) FOQI, and c) SOQI on the
energy levels of an isolated spin-3/2 quadrupolar nucleus in an external magnetic field, where ω0 is the Larmor frequency and (Q = (3,Q)/[4121 −
1] is the quadrupolar frequency. The relative magnitudes of the interaction are not to scale. ... 7 Figure 1.4 Analytical simulations of 35Cl central transition (+1/2 ↔ −1/2) NMR
spectra under static sample conditions at B0 = 9.4 T. a) ηQ = 0.4, CQ ranges
from 8 to 2 MHz; b) CQ = 6 MHz, ηQ ranges from 1.0 to 0.2. These spectra
represent typical ranges of the quadrupolar parameters for the Cl− anions described herein. ... 9 Figure 1.5 Calculated quadrupole coupling constants, CQ, of different
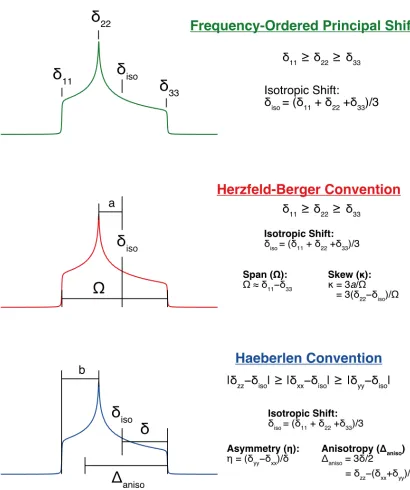
sodium-oxygen coordination environments having different symmetry and coordination numbers. Created by the author based on the adaptation of a figure from Koller, H. J. Phys. Chem. 1994, 98, 1544. ... 10 Figure 1.6 Different conventions used to describe the CS tensor. Top (green) the
frequency-ordered principal shift convention,29 middle (red) the Herzfeld-Berger convention,30 and the Haeberlen-Mehring-Spiess convention.31–
33Unlike the quadrupolar interaction, this tensor is non-traceless, and the
average of the three PAS components produces the isotropic chemical shift, δiso = (δ11 + δ22 + δ33)/3. The isotropic chemical shift is the primary NMR
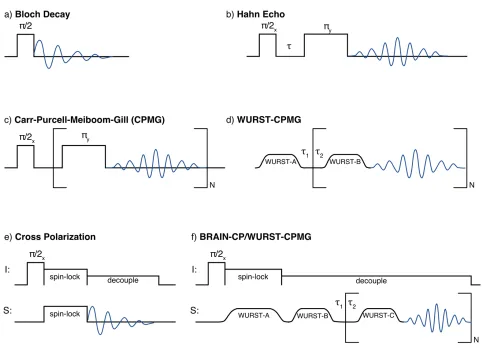
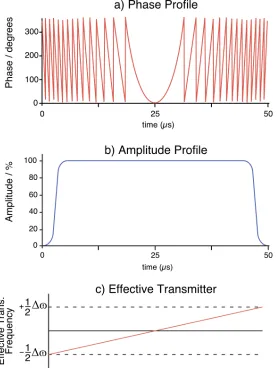
observable in the spectra of solutions. In solids, however, the CSA provides additional information on the orientation of the constituent atoms with respect to the magnetic field. ... 12 Figure 1.7 NMR pulse sequences used in this work. See text for details. ... 18 Figure 1.8 The a) phase profile, b) amplitude profile, and c) effective linear
xx
Figure 1.9 Schematic three-spin energy level diagrams detailing the key steps in the cross effect DNP mechanism a) at thermal equilibrium (e.g., without DNP), b) after saturation of one of the electron EPR transitions, and c) the result of DNP-enhancement. The energy levels are labeled with the spin states (+ or −) of the dipolar-coupled electrons (red, s1, or green, s2) and proton (blue, I), respectively. The areas of the purple circles indicate the relative populations of the energy levels. Red dashed lines correspond to EPR transitions that are saturated during the experiment (i.e., ΔE = (0, 71, the Larmor frequency of one of the electrons), and blue arrows indicate the NMR transitions that are enhanced as a result of the process. ... 24 Figure 1.10 Schematic depictions of different solid forms of APIs (shown in
different colors). Different shapes correspond to distinct types of molecules in the solid-state structures. ... 34 Figure 2.1. TEM images of the a) 27 nm NC b) 37 nm NC samples used to
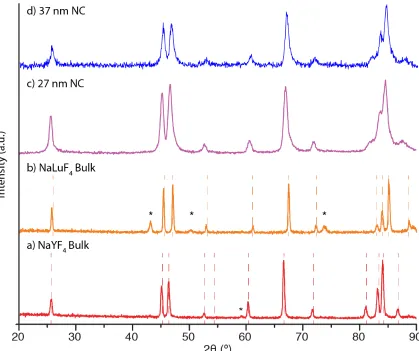
measure the particle sizes. ... 57 Figure 2.2. PXRD diffraction patterns of a) bulk NaYF4, b) bulk NaLuF4, c) 27
nm NC, and d) 37 nm NC. The red and orange dashed lines indicate features in the JCPDS reference patterns of hexagonal phase β-NaYF4 (JCPDS:
16-0334) and β-NaLuF4 (JCPDS: 27-0726), respectively. Asterisks denote
impurities, see text for details. ... 58 Figure 2.3. 23Na{19F} MAS NMR spectra of a) bulk NaYF4, b) bulk NaLuF4,c) 27
nm NC, and d) 37 nm NC (νrot =12 kHz). The inset shows the low frequency
regions of the spectra. ... 61 Figure 2.4. 23Na MQMAS NMR spectrum of bulk NaYF4 (νrot = 12 kHz). The two
23Na powder patterns indicate the presence of two magnetically distinct Na
sites. Asterisks denote spinning sidebands from Site 1. ... 63 Figure 2.5. 19F-89Y CP static NMR spectra of a) bulk NaYF4, b) 27 nm NC, and c)
37 nm NC. ... 64 Figure 2.6. 19F-89Y CP/MAS NMR spectra of a) bulk NaYF4, b) 27 nm NC, and c)
37 nm NC (νrot = 6 kHz). ... 65
Figure 2.7. 19F MAS NMR spectra of a) bulk NaYF4, b) bulk NaLuF4,c) 27 nm
NC, and d) 37 nm NC (νrot = 25 kHz). ... 66
Figure 2.8. 19F UFMAS NMR spectrum of the 27 nm NC (ν
rot = 65 kHz, B0 = 11.7
T). ... 69 Figure 2.9. A supercell (1×1×3) of Structure II,36 showing a possible arrangement
of the fractional site occupancies in the disordered structure. Yellow = Na, Green = F, Blue = Y. The six-coordinate Na sites are along the cell-edges (in yellow). ... 71 Figure 2.10. 23Na MAS NMR spectra of the 27 nm NC (νrot = 6 kHz), under the
xxi
Figure 3.1. 19F UFMAS (νrot = 60 kHz) NMR spectra of a) undoped NaYF4 NCs,
b)-d) Er-doped NaYF4 NCs and e)-g) Tm-doped NaYF4 NCs. Percentages
indicate the at.% Ln3+ dopant present in each sample. Arrows indicate the isotropic peaks; all other features in the spectra are spinning sidebands. The insets highlight the isotropic features of the spectra. ... 89 Figure 3.2. 23Na{19F} MAS (νrot = 12 kHz) NMR spectra of a) undoped NaYF4
NCs, b)-d) Er-doped NaYF4 NCs and e)-g) Tm-doped NaYF4 NCs. The
insets highlight the isotropic features of the spectra. ... 96 Figure 3.3. 19F-89Y CP/MAS (νrot = 5 kHz) NMR spectra of a) undoped NaYF4
NCs, b)-d) Er-doped NaYF4 NCs and e)-g) Tm-doped NaYF4 NCs.
Percentages indicate the at.% Ln3+ dopant present in each sample. Asterisks denote spinning sidebands. ... 98 Figure 3.4. 1H UFMAS (νrot = 60 kHz) NMR spectra of a) undoped 19 nm NaYF4
NCs, b)-d) Er-doped NaYF4 NCs and e)-g) Tm-doped NaYF4
NCs. Percentages indicate the at.% Ln3+ dopant present in each sample.
Arrows indicate the isotropic peaks; all other features in the spectra are spinning sidebands. The insets highlight the isotropic features of the spectra. ... 99 Figure 3.5. 13C{1H} MAS (νrot = 12 kHz) NMR spectra of a) 19 nm and b) 33 nm
undoped NaYF4 NCs, c)-e) Er-doped NaYF4 NCs and f)-h) Tm-doped NaYF4
NCs. Percentages indicate the at.% Ln3+ dopant present in each sample. Asterisks denote spinning sidebands. Daggers indicate signal from an impurity of trifluoroacetate, as discussed in the text. The insets on the right highlight the difference in relative intensity of the SSBs, and are scaled such that the intensities of the isotropic peaks are the same. The inset on the left contains an expansion of the alkene region of the spectra of the Er-doped samples. ... 101 Figure 3.6. 1H-89Y CP/MAS (ν
rot = 5 kHz) NMR spectra (green, top row) of NC
samples and 19F-89Y CP/MAS (νrot = 5 kHz) NMR spectra of bulk samples
(red, middle row) and NC samples (blue, bottom row). Each column contains spectra of samples with the same amount of dopant: a) undoped samples, b) with 2 at.% Er3+ dopant, c) with 2 at.% Tm3+ dopant. Dashed lines indicate features that are present in the spectra of the NC samples. ... 102 Figure 3.7. 19F UFMAS (νrot = 60 kHz) NMR spectra of the undoped NaYF4
samples with different particle sizes: a) bulk samples (> 2 µm), b) NC (33 nm), c) NC (19 nm). Single and double daggers denote peaks from minor NaF and NH4F impurities, respectively. Asterisks denote spinning sidebands. The
xxii
Figure 4.1. Crystal structure of YF shown from two views (rotated 90º from one another, as indicated by the crystallographic axes). This representation highlights the void spaces produced by the pores (yellow spheres) in the dual channel structure. The void spaces are connected by H3O+ ions, shown as red
spheres. The [Y6F32]14− UOA octahedral-like building units are represented by
green polyhedra. ... 115 Figure 4.2. Multinuclear SSNMR spectra of the undoped YF NPs: a) 19F UFMAS
(vrot = 60 kHz) (inset shows an expansion of the isotropic peaks), b) 19F-89Y
CP/MAS (vrot = 5 kHz) (inset shows the peaks with increased vertical
scaling), and c) 1H UFMAS (vrot = 60 kHz). These spectra are reproduced in
the subsequent figures for comparison with those of the other samples. ... 121 Figure 4.3. 45Sc{19F} UFMAS (vrot = 60 kHz) NMR spectra of the Sc-containing
samples. The inset shows the full spectral window and low intensity spinning sidebands. ... 127 Figure 4.4. 19F UFMAS (v
rot = 60 kHz) NMR spectra of the Sc-containing
samples. The inset shows an expansion of the isotropic peaks. Dashed lines indicate distinct features that are not present in the spectrum of YF. The dagger symbol denotes a F− impurity. All of the other features are spinning
sidebands. ... 129 Figure 4.5. 19F-89Y CP/MAS (vrot = 5 kHz) NMR spectra of the Sc-containing
samples and YF. The inset shows an expansion of the same spectra with the spectra scaled to have same maximum intensity. The corresponding scaling factors are listed in the inset. ... 131 Figure 4.6. 1H UFMAS (vrot = 60 kHz) NMR spectra of the Sc-containing samples
and YF. ... 135 Figure 4.7. 19F UFMAS (vrot = 60 kHz) NMR spectra of the Er-containing samples
and YF. The inset shows an expanded view of the isotropic peaks. The dagger and double dagger symbols denote a F– impurity and background signal from
the probe, respectively (see Figure C11). All of the other features are
spinning sidebands. ... 136 Figure 4.8. 19F-89Y CP/MAS (vrot = 5 kHz) NMR spectra of the Er-containing
samples and YF. The inset shows the spectra scaled to the same maximum intensity. Asterisks denote spinning sidebands. ... 142 Figure 4.9. 1H UFMAS (vrot = 60 kHz) NMR spectra of the Er-containing samples
and YF. The insets show expansions of the isotropic peaks. All other features are spinning sidebands. ... 143 Figure 4.10. 19F UFMAS (vrot = 60 kHz) NMR spectra of the Eu-containing
samples and YF. The inset shows an expanded view of the isotropic peaks, dashed lines indicate the locations of signals from YF3. The dagger symbol
xxiii
Figure 4.11. 19F-89Y CP/MAS (vrot = 5 kHz) NMR spectra of the Eu-containing
samples (solid lines) and YF (dashed line). The latter is shown in the outset with ca. 0.25 vertical scaling, so that the lower intensity features from
impurities in the Eu-containing samples can be seen. The right inset shows an expanded view of the most intense features in the spectra vertically scaled to have the same maximum intensity. The left inset shows the full spectrum of YF:Eu50 with increased vertical scaling. ... 149 Figure 4.12. 1H UFMAS (v
rot = 60 kHz) NMR spectra of the Eu-containing
samples and YF. The inset shows the full spectrum of YF:Eu50 with
increased vertical scaling. ... 152 Figure 5.1. Molecular structures of APIs. ... 164 Figure 5.2. 13C and 35Cl SSNMR spectra of finely ground hist impregnated with a
15 mM TEKPol/TCE solution acquired at 100 K and B0 = 9.4 T. a) 1H-13C CP/MAS spectra acquired with and without microwaves. The top inset shows the two 13C spectra scaled to the same maximum intensity. Asterisks denote
spinning sidebands. b) 1H-35Cl CP-CPMG spectra acquired with microwaves and rotation during part of the recycle delay period (SOSO conditions, red), with microwaves and a stationary sample (blue), and a stationary sample without microwaves (black). The inset shows a vertical expansion of the 35Cl SSNMR spectra. ... 168 Figure 5.3. a) DNP-enhanced 35Cl SSNMR spectra of finely ground hist
impregnated with a 15 mM TEKPol/TCE solution acquired with the CP-Echo pulse sequence under continuous slow MAS (νrot = 250 Hz) (red) and with the
sample stationary at all times (blue). b) 2D 13C-35Cl D-HMQC-R3 correlation
spectrum of hist acquired under MAS (νrot = 8 kHz) with a projection of the
2D data along the direct dimension axis and the 35Cl CPMAS-echo spectrum shown along the indirect dimension axis. ... 169 Figure 5.4. 13C and 35Cl SSNMR spectra of finely ground ambr impregnated with
15 mM TEKPol/TCE solution acquired at 100 K and B0 = 9.4 T. a) 1H-13C CP/MAS spectra acquired with and without microwaves to drive DNP. The top inset shows the two 13C spectra scaled to the same maximum intensity. The asterisks denote spinning sidebands. b) 1H-35Cl BCP spectra acquired with microwaves and slow MAS rotation during most of recycle delay period (SOSO condition, red), with microwaves and with the sample stationary at all times (blue), and with the sample stationary without microwaves (black). .. 172 Figure 5.5. SSNMR spectra of the bulk and dosage forms of isox impregnated
with a 15 mM TEKPol/TCE solution acquired at 100 K and B0 = 9.4 T. The left column has 1H-13C CP/MAS spectra of a) the bulk API and b) the dosage
samples acquired with microwaves on and off. The bottom inset shows the full spectra of the dosage form without vertical clipping. The right column has
1H-35Cl BCP spectra of c) the bulk API with and without microwaves and d)
xxiv
Figure 5.6. 13C and 35Cl SSNMR spectra of the bulk and dosage forms of diph impregnated with a 15 mM TEKPol/1,3-dibromobutane solution acquired at 100 K and B0 = 9.4 T. The left column has 1H-13C CP/MAS spectra of a) the bulk API and b) the dosage samples acquired with microwaves on and off. Asterisks denote spinning sidebands. The right column has 1H-35Cl BCP
spectra of c) the bulk API with and without microwaves and d) the bulk API and dosage samples with DNP enhancement. The lineshape in c) is lopsided to the high frequency side because only one sweep direction of the BCP contact pulse was used (see Figure D11 for more details). ... 178 Figure 5.7. 13C and 35Cl SSNMR spectra of the bulk and dosage forms of ceti
impregnated with 15 mM TEKPol/1,3-dibromobutane solution acquired at 100 K and B0 = 9.4 T. The left column has 1H-13C CP/MAS spectra of a) the bulk API and b) the dosage samples acquired with and without microwaves. Asterisks denote spinning sidebands. The right column shows the 1H-35Cl BCP spectra of c) the bulk API with and without microwaves and d) the bulk API and dosage samples with DNP enhancement. ... 180 Figure 6.1. Proposed disproportionation reactions of PiogHCl with a) MgSt and b)
NaSt. ... 195 Figure 6.2. Experimental 35Cl{1H} WURST-CPMG NMR spectra of pure
PiogHCl under static sample conditions, a) and b), and the corresponding analytical simulation, c). Experimental data were processed by a) applying a Fourier transform (FT) to the entire echo train (blue), or b) coadding the echoes together before performing a FT (red), see details in the text. ... 200 Figure 6.3. 35Cl{1H} WURST-CPMG NMR spectra of PiogHCl samples mixed
with NaSt (9:1 wt/wt), a) is the spectrum of the untreated control sample, and b) is the spectrum of the sample treated at 40 °C/75% RH for 5 days. The difference between the spectra (control – treated) is shown in c) and d). When calculating the latter, the intensity of the spectrum of the control (a) was decreased to produce only positive signal (see text for details). ... 201 Figure 6.4. 23Na{1H} MAS (νrot = 12 kHz) NMR spectra of a) NaSt_C, b)
NaSt_X, and c) pure NaSt. The inset shows the NaSt region of the spectrum of NaSt_X with increased intensity. ... 204 Figure 6.5. 35Cl{1H} WURST-CPMG NMR spectra of PiogHCl samples mixed
with MgSt (9:1 wt/wt), a) the untreated control sample, b) the sample treated at 40 °C/75% RH for 5 days, and c) the treated sample immediately after being rehydrated at 20 °C/75% RH for 4 hours. The difference between the spectra (control – treated) is shown in d) and e). When calculating the latter, the intensity of the spectrum of the control (a) was decreased to produce only positive signal. ... 205 Figure 6.6. 35Cl{1H} WURST-CPMG NMR spectra of the PiogHCl/PiogFB
mixtures. The data are shown after processing by either (i) applying a FT to the entire echo train (“spikelet spectrum”) or (ii) combining the echoes
xxv
Figure 6.7.Plots of PiogHCl wt-% measured experimentally using 35Cl SSNMR (y-axis) and the wt-% determined from the salt : free base mass ratio of the sample (x-axis). Data were obtained from spikelets in the spectra by
measuring a) the peak intensity or b) the integrated intensity of each spikelet. The plotted values are the average measurement obtained from the spikelets in a given spectrum between 39 and −84 kHz, and the error bars represent the root mean square deviation (RMSD). Standard deviations, σ, in the measured values (not shown) are smaller than the point markers. (See Table 6.2 for definitions of these two statistical values). ... 211 Figure 7.1. Molecular structure of GNE-A. ... 222 Figure 7.2. Crystal structure of GNE-A shown in two perpendicular orientations,
as indicated by the orientation of the crystallographic b-axis. Shading highlights features of the structure that are discussed in the text. The crystal structure of GNE-A was solved by A. DiPasquale at Genentech. A full accounting of the solution of this structure will be released with the
submission of a manuscript on this topic. ... 227 Figure 7.3. a) Experimental 35Cl{1H} WURST-CPMG NMR spectrum of GNE-A
acquired under static sample conditions at 22 °C and b) the corresponding two-site analytical simulation. A deconvolution of the simulated spectrum is shown in c). ... 229 Figure 7.4. Experimental 35Cl{1H} WURST-CPMG NMR spectra of GNE-A
acquired at various temperatures. Spectra were acquired on the same sample in the order shown from left to right. The spectra have been vertically scaled to account for the Boltzmann enhancement of the spin energy level
populations due to temperature (i.e., scaling factor = T×(295.15 K)-1). ... 234
Figure 7.5. 35Cl{1H} WURST-CPMG NMR spectra of the GNE-A samples prepared with different hydration levels acquired at −40 °C (see text for details of the sample preparations). The left and right columns show spectra acquired before and after heating in the magnet, respectively. Overlaid on top of the experimental spectra are simulated spectra generated with three distinct
35Cl NMR tensor parameters. The subspectra are shown as solid shapes (Site I
= purple, Site II = green, Site III = orange). ... 236 Figure 7.6. 1H-13C CP/MAS (vrot = 12 kHz) NMR spectra of the GNE-A samples
prepared with different levels of hydration. See text for details of the sample preparations. ... 240 Figure 7.7. 1H MAS (vrot = 12 kHz) NMR spectra of the GNE-A samples prepared
xxvi
Figure 7.8. 2H quadrupolar-echo spectra of the Rehydrate-D2O sample acquired
xxvii
LIST OF ABBREVIATIONS
ABMS Anisotropic bulk magnetic susceptibility
AOT Aerosol OT (Docusate sodium)
API Active pharmaceutical ingredient
BRAIN-CP BRoadband Adiabatic INversion Cross-Polarization
BRAIN-CP/WURST-CPMG BRoadband Adiabatic INversion Cross-Polarization with WURST-CPMG CASTEP Cambridge serial total energy package
CP Cross-polarization
CP/MAS Cross-polarization magic-angle spinning
CPMG Carr-Purcell Meiboom-Gill
CS Chemical shielding
C/S Core/shell
CSA Chemical shift anisotropy
CT Central transition
D-HMQC Dipolar heteronuclear multiple-quantum coherence
DS Dipolar shift
DSA Dipolar shift anisotropy
DBB 1,3,-dibromobutane
DFT Density functional theory
DNP Dynamic nuclear polarization
DSC Differential scanning calorimetry
xxviii
EPR Electron paramagnetic resonance
FID Free induction decay
FOQI First-order quadrupolar interaction
FT Fourier transform
GGA Generalized gradient approximation
GIPAW Gradient-including projector augmented wave algorithm
HE Hahn-echo
ICP-MS Inductively-coupled mass spectometry
JCPDS Joint Committee on Powder Diffraction Standards
MAS Magic-angle spinning
MQMAS Multiple-quantum magic-angle spinning
NC Nanocrystal
NMR Nuclear magnetic resonance
NMS Nuclear magnetic shielding
NP Nanoparticle
NQM Nuclear quadrupole moment
o.d. Outer diameter
PA Polarizing agent
PAS Principal axis system
ppm Parts per million
PXRD Powder X-ray diffraction
xxix
QY Quantum yield
RE Rare-earth
rf Radiofrequency
rPBE Revised Perdew, Burke, and Ernzerhof
S/N Signal-to-noise ratio
SOLA Solid Lineshape Analysis
SOQI Second-order quadrupolar interaction
SOSO Spinning-on spinning-off
SSB Spinning sideband
SSNMR Solid-state nuclear magnetic resonance
ST Satellite Transition
sw-TPPM Swept-field two-pulse-phase-modulated
TCE 1,1,2,2-tetrachloroethane
TEM Transmission electron microscopy
TGA Thermogravimetric analysis
TMS Tetramethylsilane
TPPM Two-pulse-phase-modulated
UC Upconversion
UFMAS Ultra-fast magic-angle spinning
UW Ultra-wideline
UWNMR Ultra-wideline Nuclear Magnetic Resonance
xxx
VOCS Variable Offset Cumulative Spectra
VT Variable temperature
WURST Wideband Uniform Rate Smooth Truncation
XRD X-ray diffraction
xxxi
LIST OF SYMBOLS
a, b, c Crystal lattice parameters
B0 Static external magnetic field
B1 Applied oscillating magnetic field
CQ Quadrupolar coupling constant s Chemical/magnetic shielding δiso Isotropic chemical shift
Δaniso Span of the DSA tensor
s11, s22, s33 Principal axis components of the MS tensor
δ11, δ22, δ33 Principal axis components of the CS tensor
δiso Isotropic chemical shift
ɛ DNP enhancement
siso Isotropic chemical shielding
g Gyromagnetic ratio
e Elementary charge
g Isotropic electron g-factor
gJ Isotropic lanthanide g-factor
h Plank’s constant
Plank’s constant in radians
I Nuclear spin
J Total electron angular momentum quantum number
kB Boltzmann constant
κ Skew
L Electron orbital angular momentum quantum number
mol-% Mole percent
mI Nuclear spin state
Ω Span
xxxii
Q Nuclear quadrupole moment
RDD Dipolar coupling constant
r Internuclear distance
S Electron spin quantum number
si Electron spin i
T Temperature
T1 Longitudinal relaxation time constant
T2 Transverse relaxation time constant
T2* Transverse relaxation time constant, including effects from B0 inhomogeneity
T2eff Effective transverse relaxation time constant µ Nuclear spin magnetic moment
µ0 Vacuum permeability constant
µB Bohr magneton
ν0 Larmor frequency (in MHz)
νQ Quadrupolar frequency
νrot Sample spinning rate (in Hz)
V Electric Field Gradient tensor (EFG)
V11,V22, V33 Principal axis components of the EFG tensor ω0 Larmor frequency (in rad s−1)
wt-% Weight percent
xxxiii
When I heard the learn’d astronomer,
When the proofs, the figures, were ranged in columns before me,
When I was shown the charts and diagrams, to add, divide,
and measure them,
When I sitting heard the astronomer where he lectured with
much applause in the lecture-room,
How soon unaccountable I became tired and sick,
Till rising and gliding out I wander’d off by myself,
In the mystical moist night-air, and from time to time,
Look’d up in perfect silence at the stars.
1
Chapter 1: Introduction, Background, and Context
1.1Nuclear Magnetic Resonance Spectroscopy (NMR)
Nuclear magnetic resonance (NMR) spectroscopy has become one of the premier methods for routine structural characterization in all branches of chemistry.1 NMR spectra are exquisitely sensitive to subtle differences in chemical structure, bonding, and dynamical motion (NMR is the only technique capable of detecting motions on the time scale ranging from ca. 10-2 to 1010 Hz). NMR signals are inherently quantitative, and provide direct information on the relative amounts of nuclei in chemically or
magnetically equivalent environments in a sample. Such experiments are non-destructive, and usually do not require extensive sample preparation. Finally, NMR spectroscopy can be used to study almost any type or phases of matter; while the specifics of the experimental design, hardware, and sample preparation may differ, the fundamental principles are the same.
2
spectroscopy is a particularly useful method to study materials, and is the primary characterization technique used in this work.
Nearly every element of the periodic table has at least one NMR-active nuclide, which could enable the study of a wide range of compounds and materials containing these elements. In practice, many nuclides are unreceptive to the NMR experiment due to (i) low natural abundances or dilutions, (ii) broad spectral widths, (iii) unfavorable relaxation properties, (iv) low gyromagnetic ratios, or (v) a combination of these factors; such nuclides require specialized techniques, hardware, and/or sample preparation to obtain their NMR spectra (vide infra). In the following sections, a brief discussion of the theory of NMR is presented, with a particular focus on areas that are relevant to the projects in this thesis. Due to the breadth of the field, no text on NMR can be
comprehensive; fortunately, there are numerous excellent summaries of different aspects of NMR that have been published elsewhere.2–5
1.1.1Thence Spin
NMR relies on an intrinsic property of elementary particles called spin.6 Spin is a form of angular momentum (e.g., spin angular momentum of an electron, denoted S, or nuclear spin angular momentum, denoted I) that behaves analogously to the rotational angular momentum of a spinning object. However, spin is an intrinsic property that does
not result from the spinning or rotational motions of the elementary particles. In a
3
The nuclear spin is proportional to the nuclear magnetic moment, µ, according to:
8 = %ℏ9 1. 1
where % is the gyromagnetic ratio in rad T−1 s−1 (N.B. variables in boldface type correspond to vector quantities in this work). In the presence of an external magnetic field, B0, the interaction of the nuclear magnetic moment and the magnetic field breaks
the degeneracy of the nuclear spin states, such that each has an energy described by
" = −8 ∙ =>= %ℏ1?&@ = ℏ(@1? 1. 2
where Iz is the z-component of the spin angular momentum vector, and (0 is the Larmor frequency (in rad s−1), (
@ = −%&@. The lifting of this degeneracy (called the Zeeman
splitting) produces non-degenerate energy levels (Figure 1.1). Transitions between these energy levels are allowed for ΔmI = ±1, and it is these transitions that create the signals that are observed with NMR spectroscopy.
Figure 1.1 The effects of increasing external magnetic field strength (B0) on the spin
4 1.2NMR Interactions
NMR-active nuclides also interact with their surroundings: that is, NMR spectra are sensitive to several NMR interactions that change the relative energies of the spin energy levels and are the source of the rich structural information encoded in NMR spectra. There are numerous interactions that affect appearance of SSNMR spectra, each of which has different physical origins, distinct magnitudes, and an array of secular and non-secular effects on the spectra. It is these interactions that give rise to a large class of observable and measurable NMR parameters that can be correlated to structure and dynamics. The total Hamiltonian describing the interaction between an NMR-active nucleus with its surroundings can be represented using a sum of the energies calculated from each of the individual Hamiltonians:
ABCBDE= AF+ AHI+ AJ+ AKL+ AM+ ANO+ AP+ ⋯ 1. 3
These terms correspond to interactions of nuclei with external factors (magnetic fields, ĤZ, and oscillating radiofrequency (rf) fields, Ĥrf), single spin interactions that are
internal to the sample (the quadrupolar, ĤQ, and chemical shielding, ĤCS interactions),
and two-spin interactions that are internal to the sample (direct dipolar, ĤD, unpaired
electron ĤUE, and indirect spin-spin, ĤJ , coupling interactions). The exact forms of these
Hamiltonians are described well elsewhere, and are not further discussed herein.2,11–14
5
quadrupolar interaction in solution NMR experiments), such interactions are still
important as they can be major sources of nuclear relaxation mechanisms.3,15 In general, the Zeeman interaction (ĤZ) that breaks the degeneracy of the spin energy levels is
significantly stronger than the other NMR interactions. As such, each interaction can be treated as a perturbation of the Zeeman states. The NMR interactions necessary for the understanding of this work are discussed in more detail in the following subsections. 1.2.1Quadrupolar Interaction (ĤQ)
6
the chemical shielding interaction, which is more complicated in its origins and interpretation, vide infra).16,17
Figure 1.2 Representations of nuclei with spherical (Q = 0), and non-spherical (oblate,
Q < 0 or prolate, Q > 0) distributions of positive charge.
The QI can be very large compared to most other NMR interactions, and is often the dominant NMR interaction in many materials containing quadrupolar nuclei. In fact, as is the case for several nuclides studied in this work, its effects on SSNMR spectra must be modeled with consideration of both first- and second-order perturbations of the
7
Figure 1.3 The effects of the a) Zeeman interaction, b) FOQI, and c) SOQI on the energy levels of an isolated spin-3/2 quadrupolar nucleus in an external magnetic field, where ω0
is the Larmor frequency and (J = (3,J)/[41 21 − 1 ] is the quadrupolar frequency. The relative magnitudes of the interaction are not to scale.
Like most NMR interactions, the QI is anisotropic, and can be described by the EFG tensor within the molecular frame as:
R =
STT STU STV SUT SUU SUV SVT SVU SVV
1. 4
Typically, it is more convenient to diagonalize the matrix and express it with its own principal axis system (PAS) as:
RWXY =
SZZ 0 0
0 S[[ 0
0 0 S\\ 1. 5
8
The quadrupolar interaction is often reported using two parameters: the quadrupolar coupling constant (CQ) and the asymmetry parameter (ηQ). The CQ = V33eQ/h, and is usually reported in MHz or kHz, and ηQ = (V11 − V22)⁄V33 is
dimensionless. The former is typically used as a measure of the local spherical symmetry of the ground state, with small values indicating high spherical symmetry (vide infra); the latter is simply a measure of the axial symmetry of the EFG tensor, which often reflects the axial symmetry of certain bonding environments (e.g., an atom involved in a bond along an axis of C3 symmetry or higher will have an EFG tensor at its nuclear origin with ηQ = 0).18 Values of CQ can range from zero to tens or hundreds of MHz depending on
the nucleus and sample. Values of ηQ range from zero (perfect axial asymmetry) to one
(perfect axial symmetry).
The effects of a large quadrupolar interaction on SSNMR spectra can be very dramatic. In many cases, SSNMR spectra of quadrupolar nuclei feature broad patterns that can be tens of kHz to tens of MHz in breadth, depending on the magnitude of the nuclear quadrupolar frequency, νQ = 3CQ/(2I(2I−1)), which is dependent upon I; in
9
Figure 1.4 Analytical simulations of 35Cl central transition (+1/2 ↔ −1/2) NMR spectra under static sample conditions at B0 = 9.4 T. a) ηQ = 0.4, CQ ranges from 8 to 2 MHz; b) CQ = 6 MHz, ηQ ranges from 1.0 to 0.2. These spectra represent typical ranges of the
quadrupolar parameters for the Cl− anions described herein.
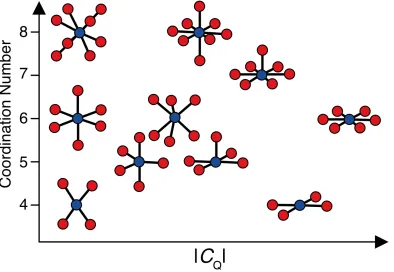
For certain molecular geometries, the magnitude of the EFG at the nucleus is small (≈ 0), meaning that the quadrupolar interaction is either very small or absent. However, for other geometries, the EFG can be quite large. This relationship between the EFG magnitude and local symmetry about the quadrupolar nucleus has been discussed in several publications,22,23,18 including a particularly elegant demonstration in a work by Koller et al. using 23Na NMR of sodium oxides with different coordination numbers and geometries (Figure 1.5).18,24 Such relationships between local molecular structure and the
10
Figure 1.5 Calculated quadrupole coupling constants, CQ, of different sodium-oxygen coordination environments having different symmetry and coordination numbers. Created by the author based on the adaptation of a figure from Koller, H. J. Phys. Chem. 1994, 98, 1544.
1.2.2Chemical Shielding Interaction (ĤCS)
11
shift and associated richness of structural information derived therefrom. The local fields that are either parallel or anti-parallel to B0 effectively increase (i.e., deshielding) or decrease (i.e., shielding) the external field experienced by the nucleus, causing positive or negative frequency shifts, respectively. Chemical shielding is almost always reported in parts per million relative to the external magnetic field, which means that pure chemical shifts are the same in spectra acquired using magnets of different field strengths.
The term chemicalshielding is often used interchangeably with the term chemical shift. Strictly speaking, the chemical shielding describes the amount of shielding relative to a bare nucleus (i.e., one without surrounding electron density). Given the
impracticality of conducting experiments on a bare nucleus, the chemical shift values are measured experimentally, and correspond to the frequency produced by a given site relative to that of some reference compound. The chemical shielding and shift are related by
^ ≡`abc − `
1 − `abc 1. 6
where σref and σ are the nuclear magnetic shieldings of a reference standard and the
sample of interest, respectively. If the shifts are not too far apart, Eq. 1.6 can be written as δ ≈ σref – σ.
The chemical shielding/shift interaction is anisotropic, and, like the QI, can be described by a second-rank tensor in its own PAS:
eWXY =
^ZZ 0 0
0 ^[[ 0
0 0 ^\\
1. 7
12
(i.e., using the frequency-ordered principal shift values convention, Figure 1.6).28
Figure 1.6 Different conventions used to describe the CS tensor. Top (green) the frequency-ordered principal shift convention,29 middle (red) the Herzfeld-Berger
convention,30 and the Haeberlen-Mehring-Spiess convention.31–33Unlike the quadrupolar interaction, this tensor is non-traceless, and the average of the three PAS components produces the isotropic chemical shift, δiso = (δ11 + δ22 + δ33)/3. The isotropic chemical
13
Chemical shift anisotropy (CSA) can be described using combinations of the components of the CS tensor.29,34,35 Two conventions for expressing CSA are used in this work, as demonstrated in Figure 1.6. Like the QI, CSA produces broadening of the experimental NMR patterns, and characteristic lineshapes that depend on the magnitudes of the principal components of the CS tensor, as well as the tensor orientation.36
1.2.3Dipolar Interaction (ĤD)
The nuclear magnetic moments of nuclear spins interact with each other in a mutual, through-space interaction known as direct dipolar coupling. The strength of this interaction is expressed by the dipolar coupling constant
ghijj = k@ 4l
%h%iℎ
nhi\ 1. 8
which is related to the gyromagnetic ratios, %, of two spins, j and k, separated by an internuclear distance, r.
Both homonuclear and heteronuclear dipolar couplings can be major sources of broadening in SSNMR spectra. The former interaction can be particularly problematic for acquiring NMR spectra of high-gamma nuclides (e.g., 1H, 19F), especially in samples featuring high concentrations of these nuclides in close proximity. For example, in common solid organic molecules, homonuclear dipolar couplings with magnitudes on the order of tens of kHz are typical. Fortunately, the influence of dipolar couplings can be reduced or eliminated in many cases by the use of carefully designed decoupling schemes and/or MAS (vide infra).
14
like cross polarization (vide infra), or for correlating signals from distant nuclei through-space, without the mediation of bonds, and measuring their bond lengths (e.g., the REDOR family of pulses sequences).37,38 Even in systems where the dipolar coupling
does not affect the appearance of the spectra (e.g., in the majority of solution NMR spectra), it is still important, as dipolar coupling is most often the dominant mechanism of nuclear relaxation, without which many NMR experiments would not be possible.
1.2.4Paramagnetic Interaction (Ĥue)
Materials that contain unpaired electron spins (i.e., those with paramagnetic centers) have strong magnetic properties that can influence the appearance of NMR spectra. Such materials include organic radicals, transition-metal ions, and lanthanides (the latter of which are important for the current work). As with nuclei (see Section 1.1), unpaired electrons have magnetic moments (S = ½ particles), which interact with those of nuclei through the unpaired electron (UE) interaction (or often simply the "paramagnetic" interaction). The magnitudes of such interactions can be extremely large, and can reach over large nuclear-electron distances because the electron magnetic moment is ca. 650 times larger than that of a nucleus (recall that magnetic spin dipole-dipole interactions scale as r−3).
15
can affect multiple nuclei in the sample, not merely that of the paramagnetic center that is the source of the unpaired spin density. The second contribution to the paramagnetic interaction is the through-space dipolar interaction between the nuclear spins and
unpaired electron spin density. The pseudocontact interaction is often modeled using the point-dipole approximation (where the unpaired spin density is envisioned to be localized at the paramagnetic center). With this approximation, the interaction can be treated as a dipole-dipole interaction between a nucleus and the surrounding unpaired electrons (analogous to the dipolar interaction of two nuclei). For more details on the specifics of these interactions, the reader is directed to the excellent work of Bertini et al., as well as several recent review articles.39–41
Both mechanisms of the paramagnetic interaction are anisotropic, and can be described by tensors. For some samples, these tensors are non-traceless and can produce large paramagnetically induced shifts (on the order of 10s or 100s of ppm). The
anisotropies of these interactions are also manifest in SSNMR spectra, and produce similar effects to the CSA, though they have different physical origins (see Chapters 3 and 4 for a detailed description of these interactions).
The paramagnetic interaction can provide a relaxation mechanism that dominates the rate of longitudinal relaxation (T1). In turn, rapid relaxation resulting from
16
impossible.42,43 In some cases, such broadening can be eliminated or reduced with the use of modern magic-angle spinning (MAS) hardware that is capable of spinning at speeds of over 100 kHz.44–47 Rapid relaxation can be beneficial for the acquisition of some NMR
spectra, as it can shorten the longitudinal relaxation time constant, decrease the recycle delay, and increase the number of scans that can be acquired in a given time frame. Such relaxation enhancements are commonly used in solution studies, where a small amount of a paramagnetic material can be added to a sample with slow longitudinal relaxation (i.e., one with a large T1 relaxation constant).48–50 The effects of paramagnetic rare-earth ions
on NMR spectra of nanomaterials are discussed in Chapters 3 and 4.
1.3NMR Methods
NMR experiments are conducted using a series of rf pulses, collectively known as a pulse sequence, that manipulate the nuclear spins in a sample. With modern NMR hardware, the frequency, amplitude, phase, and timing of these pulses can all be manipulated according to the needs of the experiment. The choice of pulse sequence depends on the available nuclei, properties of the sample being studied, and the structural information that is desired. As such, many different sequences have been used for the current work, as summarized in Figure 1.7.
1.3.1Single-Resonance Pulse Sequences
17
before it can be detected. Bloch decays are particularly ineffective for acquiring the spectra of broad patterns (like those present in many of the spectra in this work); some of these patterns are associated with nuclides with inherently fast nuclear relaxation, while others feature FIDs that decay rapidly due to inhomogeneous broadening. The Hahn echo (also known as a spin-echo) sequence (Figure 1.7b) is an improvement to the basic Bloch decay sequence, as it can refocus some of the signal that would otherwise be lost to decay or relaxation, and provides additional time for the NMR probe electronics to
prepare for acquisition of the signal.53 While they are not discussed further here, practical
details of these (and numerous other) NMR pulse sequences are discussed in several excellent books.2,4,54
A common extension of the Hahn echo sequence is the Carr-Purcell-Meiboom-Gill (CPMG) sequence (Figure 1.7c), which consists of a chain of repeated π pulses that continually refocus the NMR signal to produce a series of echoes known as an echo train.55,56 Originally designed for measuring T2 constants, CPMG can also be used for signal enhancement in numerous SSNMR experiments on samples that have
inhomogeneously broadened powder patterns, including both spin-1/2 and quadrupolar nuclides. Of relevance to the experiments reported herein is the frequent necessity to apply high-power 1H decoupling (vide infra), in order to reduce contributions to T2
18
![Figure 1.3 The effects of the a) Zeeman interaction, b) FOQI, and c) SOQI on the energy levels of an isolated spin-3/2 quadrupolar nucleus in an external magnetic field, where ω0 is the Larmor frequency and (J = (3,J)/[41 21 − 1 ] is the quadrupolar freque](https://thumb-us.123doks.com/thumbv2/123dok_us/1372428.1169965/41.612.111.441.69.317/interaction-isolated-quadrupolar-external-magnetic-larmor-frequency-quadrupolar.webp)