Clinical Interventions in Aging
Dovepress
O r I g I n A l r e s e A r C h
open access to scientific and medical research
Open Access Full Text Article
Jwa-Kyung Kim1
Young rim song1
Young-Jun Kwon2
hyung Jik Kim1
sung gyun Kim1
Young-su Ju2
1Department of Internal Medicine, Kidney research Institute, 2Department of Occupational and environmental Medicine, hallym University sacred heart hospital, Anyang-si, south Korea
Correspondence: Young-su Ju Department of Occupational and environmental Medicine, hallym University sacred heart hospital, 896, Pyeongchon-dong, Dongan-gu, Anyang-si, 431-070, south Korea Tel +82 31 380 6035
Fax +82 31 380 1583 email [email protected]
sung gyun Kim
Department of Internal Medicine and Kidney research Institute, hallym University sacred heart hospital, 896, Pyeongchon-dong, Dongan-gu, Anyang-si, 431-070, south Korea Tel +82 31 380 3720
Fax +82 31 386 2269 email [email protected]
Increased body fat rather than body weight
has harmful effects on 4-year changes of renal
function in the general elderly population
with a normal or mildly impaired renal function
Background: With increasing age, body fat increases and muscle mass reduces. Even people
with a normal weight may have a higher percentage of body fat. The aim of this study is to investigate the association between increased body fat and renal function decline (RFD) in the general elderly population with normal or mildly impaired renal function.
Method: We conducted a prospective study of 615 healthy individuals in the general Korean population aged 60 years who participated in two health screening check-ups separated by a 4-year period. Obesity was defined as the highest sex-specific tertiles of the percentage body fat (PBF). The main outcome was changes of estimated glomerular filtration rate (eGFR) dur-ing the 4 years. Significant RFD was defined as a decrease of eGFR over the upper quartile (-2.1% per year).
Results: The mean age was 67.2±6.6 years. The median value of the absolute decline in the eGFR and the percent change was -3.0 mL/minute/1.73 m2 and -0.87%/year in men
and -3.1 mL/minute/1.73 m2 and -0.89%/year in women, respectively. When stratified by
sex-specific PBF tertiles, pronounced differences were observed in both sexes; those at the highest tertile of PBF showed the greatest decline in eGFR. Even after adjustments for traditional risk
factors of RFD, PBF was independently associated with eGFR changes (β=-0.181; P0.001).
In addition, the harmful effect of a high PBF was consistently found in subjects with a normal weight, too (β=-0.141; P=0.006). Cases of significant RFD occurred in 181 participants (29.4%), and the risk was higher in obese participants as compared with the nonobese participants. The odd ratios (95% confidence interval) for significant RFD were 2.76 (1.28–7.74) in men and 2.02 (1.06–4.43) in women in a whole population and 3.15 (1.03–18.52) in men and 1.44 (1.01–3.28) in women with a normal weight, respectively.
Conclusion: Among the elderly population without comorbidities, increased body fat has a
harmful effect on RFD, irrespective of body weight.
Keywords: body fat, general elderly population, renal function decline, obesity
Introduction
Decreased renal function is a common problem in the elderly population. According to the Korean National Health and Nutrition Examination Survey,1 the prevalence
of chronic kidney disease (CKD) was 15.0% in the 55–64 age group and 31% of those 65 years. Compared to the subjects with estimated glomerular filtration rate (eGFR) 60 mL/minute/1.73 m2 who were usually referred to nephrologists, most
patients with eGFR 60 mL/minute/1.73 m2 are not referred to the renal team, and
little attention has been paid to their renal function unless they have specific risk factors
Journal name: Clinical Interventions in Aging Journal Designation: Original Research Year: 2014
Volume: 9
Running head verso: Kim et al
Running head recto: Increased body fat and renal function decline DOI: http://dx.doi.org/10.2147/CIA.S66714
Clinical Interventions in Aging downloaded from https://www.dovepress.com/ by 118.70.13.36 on 20-Aug-2020
For personal use only.
This article was published in the following Dove Press journal: Clinical Interventions in Aging
6 August 2014
Dovepress
Kim et al
of CKD, such as diabetes or hypertension. Considering that CKD is a long-term condition that can be progressive, the early identification of risk factors is needed in these patients with normal or mildly impaired renal function.
Obesity-related renal disease became known more than 20 years ago, and in the context of the worldwide spread of obesity, it was regarded as an epidemic disease.2
Obesity-induced hemodynamic changes, glomerular deposition of lipids, and various adipokines play important roles in the development of renal disease.3,4 Previous epidemiological
investigations have confirmed that obesity is a significant risk factor for the development and progression of chronic kidney disease (CKD).3,5–7 Although the gold standard
defi-nition of obesity is considered to be the presence of excess body fat,2 obesity is generally diagnosed in clinical practice
using the body mass index (BMI).8,9 BMI is a simple tool to
screen an overweight or obese status; however, significant limitation of BMI is its failure to differentiate between fat and lean body mass, especially in patients with a BMI of 30 kg/m2.10–12 Moreover, there is a subset of patients
who have a normal body weight based on BMI but an elevated percentage of body fat (PBF). Such metabolically obese but normal-weight (normal-weight obesity, [NWO]) patients may be at a much higher risk for cardiometabolic dysregulation, endothelial dysfunction, insulin resistance, and cardiovascular complications.13–15 Therefore, measuring
PBF rather than BMI is a more accurate method to exploring the impact of obesity on health status.
As age-related alterations in body composition occur (lean mass decreases but fat tissue increases), a significant proportion of the general elderly population may be sus-ceptible to adiposity-related medical disease.16 To date,
however, few studies have investigated the association between increased PBF and changes of renal function in a general elderly population with normal or mildly impaired renal function.
Subjects and methods
study subjects
We conducted a prospective study involving 1,025 individuals of the general Korean population aged 60 years who par-ticipated in two health screening check-ups separated by a 4-year period (2008–2012). To avoid changes in renal func-tion due to preexisting medical diseases, 292 subjects with established atherosclerotic vascular disease or the following other confounding risk factors were excluded: a history of diabetes (n=44); hypertension (n=136); previous diagnosis of CKD or undergoing dialysis (n=43); cardiovascular disease
(n=22); malignancy (n=3); and missing data (n=44). Subjects with an eGFR of 60 mL/minute/1.73 m2 and proteinuria
were also excluded (n=17).
In 2012, 101 subjects were lost to follow-up; therefore, the study sample comprised 615 subjects. The present study was conducted according to the Declaration of Helsinki. Written informed consent was obtained from each subject after a full explanation of the purpose and nature of the study. The protocol was approved by the institutional review board/ ethics committee of Hallym University Sacred Heart Hospital, Anyang-si, South Korea.
Data collection
The subjects were asked to describe their smoking habit, alcohol consumption, physical activity, drug history, marital status, socioeconomic status, diet, and previous medical diseases such as diabetes, hypertension, cardiovascular disease, gout, and malignancy. Body weight and height were measured. Systolic and diastolic blood pressure (BP) was measured in the sitting position after resting for at least 5 minutes. Blood samples were collected in the morning after an overnight fast. Serum hemoglobin, glucose, total choles-terol, triglycerides, low-density lipoprotein, high-density lipoprotein (HDL), albumin, and alkaline phosphatase levels were measured. Serum high-sensitivity C-reactive protein (hs-CRP) levels were also checked. For measurement of the renal function, the eGFR was calculated using the CKD Epidemiology Collaboration equations. To detect proteinu-ria or hematuproteinu-ria, a dipstick urinalysis was performed using spontaneously voided fresh urine that was analyzed within a few minutes after collection.
Anthropometric parameters and body
composition measurements
Two trained medical staff members performed anthropomet-ric measurements and body composition analysis following a strict protocol. Waist circumference (WC) was measured to the nearest 0.1 cm in a horizontal plane at the level of the midpoint between the iliac crest and the costal margin and at the end of a normal expiration. Hip circumference (HC) was ascertained at the maximum extension of the buttocks, and the waist-to-hip (WHR) ratio was calculated as the WC divided by the HC. A high WC was defined as 90 cm in men and 80 cm in women. Every measurement was taken twice for a more reliable estimate than a single measurement. The BMI was calculated as the individual’s weight (kg) divided by height squared (m2). Overweight and obese were defined
as a BMI of 25 and 30 kg/m2, respectively.
Clinical Interventions in Aging downloaded from https://www.dovepress.com/ by 118.70.13.36 on 20-Aug-2020
Dovepress Increased body fat and renal function decline
Body composition data were obtained using a multifre-quency bioelectrical impedance analyzer (Zeus 9.9 PLUS; Jawon Medical Co., Ltd., Kungsang Bukdo, South Korea).17
The subjects were asked to avoid eating or drinking anything except water, and the test was performed after full voiding. Using the tetrapolar electrode method (where electrodes are located on both hands, both soles of the feet, and both ankles; frequency, 1, 5, 50, 250, 550, and 1,000 kHz; current, 360 uA), the machine sent a minute electric current and mea-sured the body composition using personal data that had already been saved (height, weight, sex, age, and newly calculated body impedance). We divided the subjects into three groups according to the sex-specific PBF. Among the total participants, the boundaries of the PBF tertiles were 22.1%, 21.2%–25.4%, and 25.5% in men and 27.9%, 28.0%–31.5%, and 31.6% in women.
NWO was defined as a normal weight based on BMI (18.5–24.9 kg/m2) with a high PBF (%), according to
the highest sex-specific tertiles of the PBF. In men with a normal BMI, the three boundaries of the PBF tertiles were: 21.1%; 21.2%–24.0%; and 24.0%. In women, those percentages were: 26.8%; 26.9%–30.3%; and 30.4%.
Outcomes
The main outcome of this study was the changes of renal function during the 4 years. We calculated both the abso-lute decline and the percentage change during the 4 years (%/year) in each subject. Because we could not measure the eGFR serially over the 4 years, (all subjects participated in this study as a part of their health screenings, thereby, all tests are assumed to have been performed at steady state), we did not use the term “rate” or “slope” to describe the eGFR decline. The percent change in the eGFR per year was calculated using Equation 1, and a significant RFD was defined by a change in the eGFR over the upper quartile (-2.1%/year):
Percent change in eGFR/year = [(follow-up eGFR - baseline eGFR)/baseline eGFR] ×100/follow-up year. (1)
statistical analysis
Statistical analyses were performed using SPSS version 20.0 (IBM Corporation, Armonk, NY, USA). All variables are expressed as the mean ± standard deviation or median with interquartile range (IQR) unless otherwise indicated. The Kolmogorov–Smirnov test was used to analyze the normality of distribution, and – for skewed data such as the serum hs-CRP – natural log values were used. Differences between the
two groups were analyzed by an independent Student’s t-test for continuous variables or Fisher’s exact test for categorical data. Differences among three or more groups were analyzed by analysis of variance. Pearson’s correlation analysis was used to clarify the relationships between the baseline clini-cal and anthropometric data, body composition data, and the percent changes in renal function during the 4 years. Multiple logistic regression analysis was performed to evaluate the risk of an increased PBF impacting a significant RFD in both the general population and subjects with a normal weight. Age, sex, smoking, systolic BP, diastolic BP, WC, glucose level, triglycerides level, and HDL level were included in the multivariate model. A P-value of 0.05 was considered statistically significant.
Results
Total participants
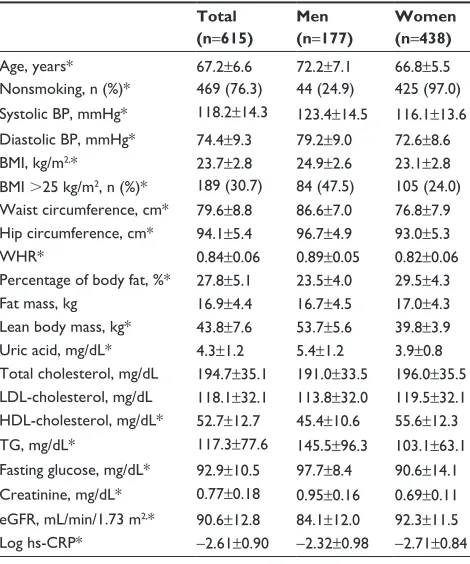
Table 1 shows the sex-specific baseline characteristics of our subjects. The mean subject age was 67.2±6.6 years, and the mean baseline eGFR was 90.6±12.8 mL/minute/1.73 m2. Also,
177 subjects (28.7%) were male, and they were significantly
Table 1 Baseline clinical and anthropometric characteristics of total study participants
Total (n=615)
Men (n=177)
Women (n=438)
Age, years* 67.2±6.6 72.2±7.1 66.8±5.5
nonsmoking, n (%)* 469 (76.3) 44 (24.9) 425 (97.0) systolic BP, mmhg* 118.2±14.3 123.4±14.5 116.1±13.6 Diastolic BP, mmhg* 74.4±9.3 79.2±9.0 72.6±8.6 BMI, kg/m2,* 23.7±2.8 24.9±2.6 23.1±2.8 BMI 25 kg/m2, n (%)* 189 (30.7) 84 (47.5) 105 (24.0) Waist circumference, cm* 79.6±8.8 86.6±7.0 76.8±7.9 hip circumference, cm* 94.1±5.4 96.7±4.9 93.0±5.3
Whr* 0.84±0.06 0.89±0.05 0.82±0.06
Percentage of body fat, %* 27.8±5.1 23.5±4.0 29.5±4.3
Fat mass, kg 16.9±4.4 16.7±4.5 17.0±4.3
lean body mass, kg* 43.8±7.6 53.7±5.6 39.8±3.9 Uric acid, mg/dl* 4.3±1.2 5.4±1.2 3.9±0.8 Total cholesterol, mg/dl 194.7±35.1 191.0±33.5 196.0±35.5 lDl-cholesterol, mg/dl 118.1±32.1 113.8±32.0 119.5±32.1 hDl-cholesterol, mg/dl* 52.7±12.7 45.4±10.6 55.6±12.3 Tg, mg/dl* 117.3±77.6 145.5±96.3 103.1±63.1 Fasting glucose, mg/dl* 92.9±10.5 97.7±8.4 90.6±14.1 Creatinine, mg/dl* 0.77±0.18 0.95±0.16 0.69±0.11 egFr, ml/min/1.73 m2,* 90.6±12.8 84.1±12.0 92.3±11.5 log hs-CrP* -2.61±0.90 -2.32±0.98 -2.71±0.84
Notes: All variables are expressed as mean ± sD. *P0.001.
Abbreviations: BP, blood pressure; BMI, body mass index; Whr, waist-to-hip ratio; lDl, low-density lipoprotein; hDl, high-density lipoprotein; Tg, triglycer-ides; eGFR, estimated glomerular filtration rate; hs-CRP, high-sensitivity C-reactive protein; sD, standard deviation.
Clinical Interventions in Aging downloaded from https://www.dovepress.com/ by 118.70.13.36 on 20-Aug-2020
Dovepress
Kim et al
older and had higher systolic and diastolic BP and a higher prevalence of smoking than did women. The prevalence of an overweight and obese people were 30.7% (47.5% for men; 24.0% for women; P0.001) and 3.6% (6.2% for men; 2.5% for women; P0.001), respectively. According to body com-position analysis, the PBF (%) was higher, but the lean body mass was lower in women than in men.
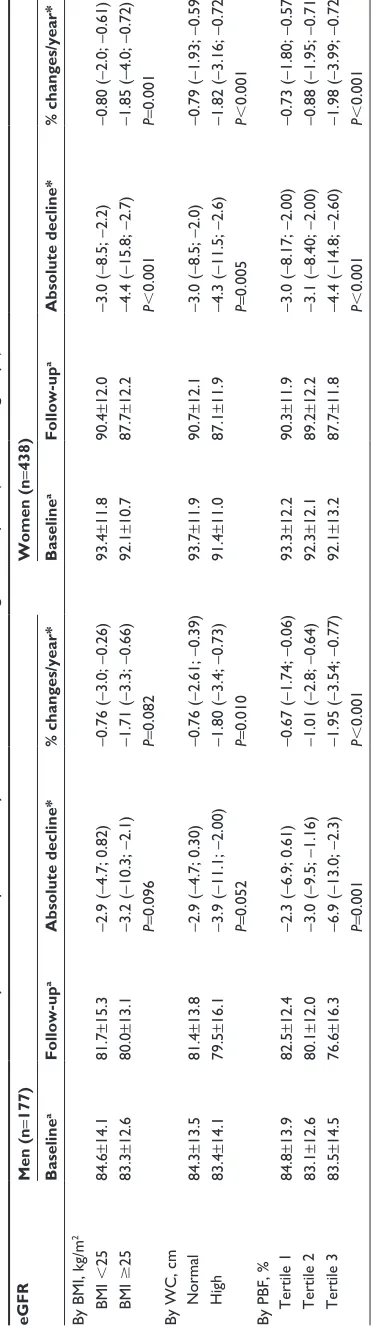
Table 2 shows the baseline and follow-up eGFR among the total participants. The median absolute decline in the eGFR and the percent change over the 4 years were -3.0 mL/minute/1.73 m2 and -0.87%/year in men and
-3.1 mL/minute/1.73 m2 and -0.89%/year in women. There
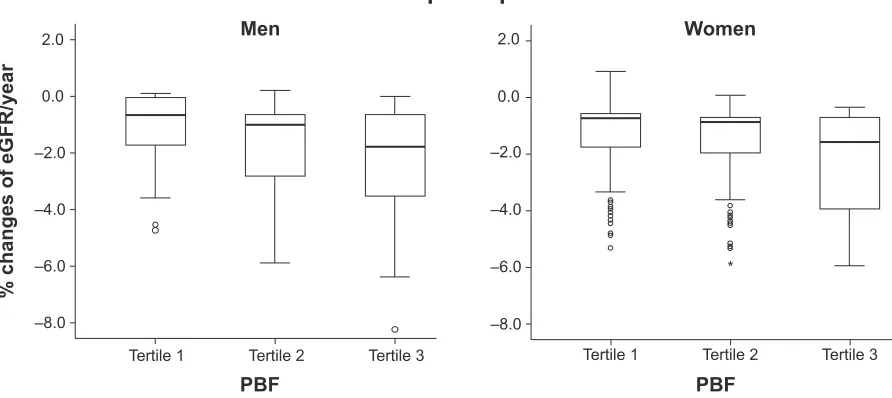
was no significant sex difference in the eGFR change. We compared the absolute difference in the eGFR and percent change according to the BMI, WC, and PBF. When stratified by the BMI, men showed no significant differ-ences in the eGFR change, and when stratified by WC, the differences were marginally significant. When stratified by the tertiles of PBF, pronounced differences in renal function decline were observed; subjects at the highest PBF tertile showed higher eGFR declines (P=0.001) and percent changes per year (P0.001) than did subjects at the middle and lowest PBF tertiles over the 4 years (Figure 1). In women, all three categories were important determinants for differentiating the magnitude of RFD during the 4 years.
Participants with normal weight
In our study, 426 (69.3%) subjects had a normal BMI (93 men; 333 women), and the prevalence of NWO was 34.4% in men and 32.7% in women using the sex-specific tertiles of PBF. Age, BP, anthropometric parameters – such as BMI, WC, WHR, and body fat – and serum HDL levels were all associated with NWO in both sexes. In addition, the serum hs-CRP level increased at higher PBF tertiles (Table 3).
In patients with normal weight, the median absolute decline in the eGFR over the 4 years and the percent change per year were -2.8 mL/minute/1.73 m2 and -0.80%/year
in men and -2.9 mL/minute/1.73 m2 and -0.87%/year in
women (P=0.274; 0.879 between the sexes). Also in these subjects, the magnitude of eGFR decline was closely asso-ciated with PBF tertiles. In particular, NWO individuals showed more prominent decreases in eGFR and percent changes per year during the 4 years than did individu-als with a normal BMI and in the lowest or middle PBF tertiles: -3.6 (IQR: -11.6; -2.3) and -1.36%/year in men (P=0.004); and -3.2 (IQR: -9.7; -2.11) and -1.12%/year in women (P=0.001) (Figure 2). Table 2
Values of eGFR at baseline and at 4-year follow-up, stratified by BMI, WC, and PBF among total subjects (
P between groups) eGFR Men (n = 177) Women (n = 438) Baseline a Follow-up a Absolute decline* % changes/year* Baseline a Follow-up a Absolute decline* % changes/year*
By BMI, kg/m
2 BMI 25 84.6 ± 14.1 81.7 ± 15.3 -2.9 ( -4.7; 0.82) -0.76 ( -3.0; -0.26) 93.4 ± 11.8 90.4 ± 12.0 -3.0 ( -8.5; -2.2) -0.80 ( -2.0; -0.61) BMI 25 83.3 ± 12.6 80.0 ± 13.1 -3.2 ( -10.3; -2.1) -1.71 ( -3.3; -0.66) 92.1 ± 10.7 87.7 ± 12.2 -4.4 ( -15.8; -2.7) -1.85 ( -4.0; -0.72) P = 0.096 P = 0.082 P 0.001 P = 0.001
By WC, cm n
ormal 84.3 ± 13.5 81.4 ± 13.8 -2.9 ( -4.7; 0.30) -0.76 ( -2.61; -0.39) 93.7 ± 11.9 90.7 ± 12.1 -3.0 ( -8.5; -2.0) -0.79 ( -1.93; -0.59) h igh 83.4 ± 14.1 79.5 ± 16.1 -3.9 ( -11.1; -2.00) -1.80 ( -3.4; -0.73) 91.4 ± 11.0 87.1 ± 11.9 -4.3 ( -11.5; -2.6) -1.82 ( -3.16; -0.72) P = 0.052 P = 0.010 P = 0.005 P 0.001
By PBF, % Tertile 1
84.8 ± 13.9 82.5 ± 12.4 -2.3 ( -6.9; 0.61) -0.67 ( -1.74; -0.06) 93.3 ± 12.2 90.3 ± 11.9 -3.0 ( -8.17; -2.00) -0.73 ( -1.80; -0.57) Tertile 2 83.1 ± 12.6 80.1 ± 12.0 -3.0 ( -9.5; -1.16) -1.01 ( -2.8; -0.64) 92.3 ± 12.1 89.2 ± 12.2 -3.1 ( -8.40; -2.00) -0.88 ( -1.95; -0.71) Tertile 3 83.5 ± 14.5 76.6 ± 16.3 -6.9 ( -13.0; -2.3) -1.95 ( -3.54; -0.77) 92.1 ± 13.2 87.7 ± 11.8 -4.4 ( -14.8; -2.60) -1.98 ( -3.99; -0.72) P = 0.001 P 0.001 P 0.001 P 0.001 Notes:
*Median with interquartile range;
P
between groups.
aData presented as mean
±
standard deviation.
Abbreviations:
eGFR, estimated glomerular filtration rate; BMI, body mass index; WC, waist circumference; PBF, percentage of body fat.
Clinical Interventions in Aging downloaded from https://www.dovepress.com/ by 118.70.13.36 on 20-Aug-2020
Dovepress Increased body fat and renal function decline
PBF and changes in renal function
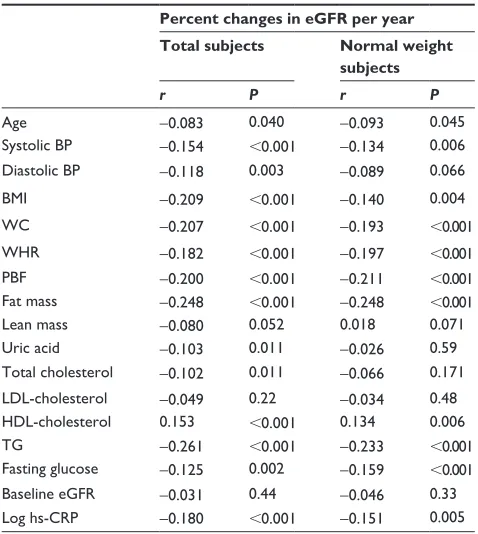
Table 4 displays the clinical, biochemical, and anthropomet-ric parameters associated with RFD over the 4 years. Among the total participants as well as in normal weight participants, old age, high BP, high BMI, high WC, high WHR, higher fat mass, and high PBF had a negative association with RFD. In addition, serum HDL-cholesterol, TG, fasting glucose, and serum hs-CRP levels were also strongly associated with eGFR changes. According to the multivariate regression anal-ysis, systolic BP, low HDL cholesterol, and increased PBF were significant determinants of changes in renal function (Table 5). However, there was no clear association among lean body mass, baseline eGFR, and eGFR changes.
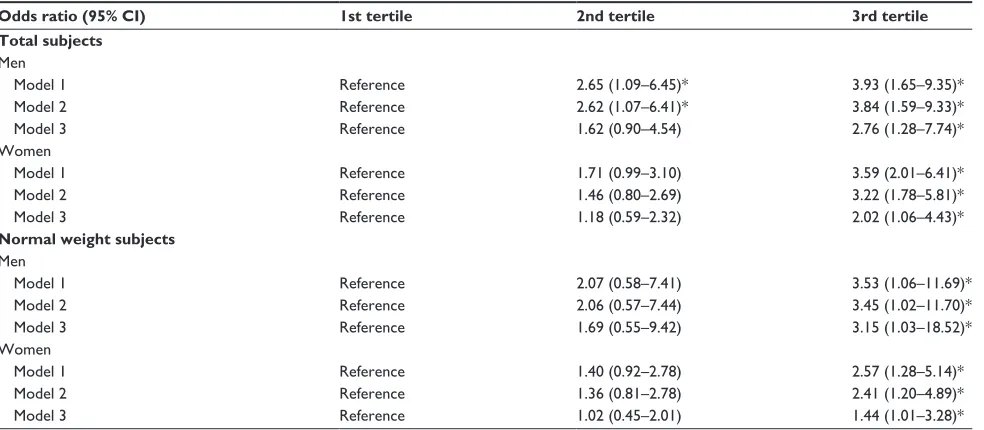
Over the 4 years, a significant RFD was observed in 181 participants (29.4%), and the risk was higher in obese participants, as compared with the nonobese participants. According to the multivariate analysis, in both sexes, the highest tertile of PBF was an important risk factor for a significant RFD, even after adjustment for various risk factors for eGFR changes. The odd ratios (95% confidence interval) for significant RFD were 2.76 (1.28–7.74) in men and 2.02 (1.06–4.43) in women in a whole population and 3.15 (1.03–18.52) in men and 1.44 (1.01–3.28) in women with a normal weight, respectively (Table 6).
Discussion
In this study, we found that increased body fat was a sig-nificant risk factor for a greater eGFR decline in the general elderly population without comorbidities. Interestingly, the
harmful effect of obesity was consistently observed even in subjects with a normal weight; subjects with NWO had a higher risk of a significant RFD by 3.15-fold and 1.44-fold in men and women, respectively. Considering that a decline in kidney function greater than that attributed to normal aging could be a marker of progressive renal disease, measurements of body fat may help to identify individuals who were susceptible to significant RFD. In individuals without known comorbid conditions or intrinsic renal dis-ease, the average rate of eGFR decline is -0.75 to approxi-mately -0.9 mL/minute/1.73 m2/year.18,19 Although aging is
an inevitable factor for RFD, there are modifiable risk factors, such as smoking and obesity, for which adequate manage-ment could slow the progression of GFR decline. Particularly in the context of the worldwide spread of obesity, there has been increasing interest in obesity-related renal disease. According to the previous population-based epidemiologic studies, obesity has been shown to be associated with new-onset CKD and an increased rate of renal progression in individuals with existing primary kidney disease, even after adjustment for confounding comorbidities.5–7 However, the
detrimental effects of obesity on RFD in relatively healthy individuals with a normal or mildly impaired renal function remain unrecognized. Moreover, BMI, a commonly used diagnostic tool for obesity, has a significant limitation it can-not differentiate between fat and lean body mass, especially in patients with a BMI of 30 kg/m2.10,11 Therefore, in this
study, we diagnosed obesity using increased body fat. We used bioelectrical impedance analyzers to measure PBF in
Total participants
% changes of eGFR/year
Men
Tertile 1 Tertile 2
PBF PBF
Tertile 3 Tertile 1 Tertile 2 Tertile 3
Women
–8.0 –6.0 –4.0 –2.0 0.0 2.0
–8.0 –6.0 –4.0 –2.0 0.0 2.0
*
Figure 1 Differences of percent changes of eGFR by sex-specific tertiles of PBF in total participants.
Note: Individualswith higher tertile of PBF had significantly greater changes of eGFR during the 4 years.
Abbreviations: egFr,estimated glomerular filtration rate; PBF, percentage body fat.
Clinical Interventions in Aging downloaded from https://www.dovepress.com/ by 118.70.13.36 on 20-Aug-2020
Dovepress
Kim et al
Table 3
Anthropometric parameters and changes in renal function in subjects with a normal weight by PBF tertiles (n
= 426) Characteristics Men (n = 93), PBF Women (n = 333), PBF
1st tertile (n=
30)
2nd tertile (n=
31)
3rd tertile (n=
32)
P
1st tertile (n=
107)
2nd tertile (n=
117)
3rd tertile (n=
109) P Age, years 68.0 ± 6.6 71.4 ± 6.6 74.2 ± 7.9 0.040 66.1 ± 5.4 69.3 ± 7.2 73.6 ± 7.6 0.001
systolic BP, mm
h g 117.6 ± 12.2 120.6 ± 15.5 125.8 ± 12.7 0.018 109.9 ± 11.2 114.2 ± 13.4 120.0 ± 13.6 0.001
Diastolic BP, mm
h g 74.0 ± 7.4 78.8 ± 9.3 80.0 ± 9.0 0.029 69.3 ± 8.3 72.1 ± 8.4 74.4 ± 8.3 0.001 BMI, kg/m 2 21.9 ± 1.3 23.1 ± 0.7 24.1 ± 1.9 0.001 19.9 ± 1.5 22.3 ± 1.0 23.6 ± 1.6 0.001 WC, cm 78.5 ± 4.8 84.5 ± 4.7 86.4 ± 6.8 0.001 68.9 ± 5.4 74.9 ± 5.2 79.6 ± 6.3 0.001 W hr 0.84 ± 0.04 0.89 ± 0.04 0.90 ± 0.05 0.001 0.77 ± 0.05 0.82 ± 0.06 0.85 ± 0.05 0.001
Body fat, %
17.9 ± 2.1 22.2 ± 1.1 25.8 ± 2.0 0.001 20.0 ± 1.5 23.8 ± 0.9 29.9 ± 2.3 0.001
Body fat, kg
11.1 ± 1.6 14.7 ± 2.2 17.7 ± 2.0 0.001 9.4 ± 1.5 12.2 ± 1.2 16.8 ± 2.5 0.001
lean mass, kg
51.1 ± 5.6 52.7 ± 4.2 50.9 ± 4.9 0.28 37.4 ± 3.3 38.6 ± 4.8 39.3 ± 3.1 0.045
Total cholesterol, mg/d
l 190.1 ± 29.5 181.3 ± 56.7 190.4 ± 36.4 0.60 187.9 ± 25.3 188.4 ± 34.2 194.3 ± 35.1 0.49 h D l, mg/d l 50.0 ± 12.8 47.6 ± 10.9 42.5 ± 7.6 0.022 63.8 ± 11.7 62.3 ± 13.0 54.6 ± 12.0 0.001 lD l, mg/d l 115.7 ± 28.4 117.0 ± 24.8 120.7 ± 28.4 0.13 103.4 ± 18.5 108.9 ± 29.3 117.7 ± 30.7 0.020 T g , mg/d l 105.1 ± 64.4 136.7 ± 77.3 135.4 ± 101.4 0.31 64.2 ± 21.7 70.3 ± 36.2 104.4 ± 56.9 0.001 g lucose, mg/d l 93.9 ± 10.6 98.0 ± 26.3 102.7 ± 28.8 0.39 84.0 ± 8.3 86.2 ± 9.1 91.9 ± 17.0 0.005 log hs-C r P -2.7 ± 1.2 -2.5 ± 1.0 -2.2 ± 0.5 0.005 -3.2 ± 0.6 -2.8 ± 0.8 -2.5 ± 0.6 0.001 eg Fr , m l/minute/1.73 m 2 Baseline 85.4 ± 13.2 83.2 ± 11.3 82.2 ± 19.5 0.45 92.9 ± 12.3 92.6 ± 11.9 91.6 ± 10.2 0.19 Follow-up 83.1 ± 10.1 80.7 ± 13.3 78.6 ± 25.1 0.14 89.9 ± 12.0 89.5 ± 11.0 88.4 ± 12.4 0.075 Absolute decline* -2.3 ( -3.9; 0.81) -2.5 ( -8.60; -0.11) -3.6 ( -11.6; -2.3) 0.022 -3.0 ( -8.0; -1.40) -3.1 ( -9.1; -2.45) -3.2 ( -9.7; -2.11) 0.024 Percent change/year* -0.65 ( -1.05; -0.05) -0.76 ( -2.13; -0.40) -1.36 ( -3.62; -0.71) 0.004 -0.72 ( -1.72; -0.47) -0.88 ( -1.96; -0.71) -1.12 ( -2.81; -0.70) 0.001 Note:
Data presented as mean
±
standard deviation, unless noted otherwise. *Median wit
h IQ r . Abbreviations: PBF, percentage of body fat; BP, blood pressure; WC, waist circumference; W hr , waist-to-hip ratio; BMI, body mass index; h D l, high-density lipoprotein; lD l, low-density lipoprotein; T g , triglycerides; eg Fr , estimated
glomerular filtration rate; hs-CRP, high-sensitivity C-reactive protein; IQR, interquartile range.
Clinical Interventions in Aging downloaded from https://www.dovepress.com/ by 118.70.13.36 on 20-Aug-2020
Dovepress Increased body fat and renal function decline
Figure 2 Differences of % changes of eGFR by sex-specific tertiles of PBF in participants with a normal BMI.
Note: similarto that of the general population, those with higher tertile of PBF had significantly greater changes of eGFR during the 4 years.
Abbreviations: BMI, body mass index; eGFR, estimated glomerular filtration rate; PBF, percentage body fat.
Participants with normal BMI
% changes of eGFR/year
Tertile 1 2.0
0.0
–2.0
–4.0
–6.0
–8.0
2.0
0.0
–2.0
–4.0
–6.0
–8.0 Tertile 2
PBF
Men Women
PBF
Tertile 3 Tertile 1 Tertile 2 Tertile 3 *
Table 4 Clinical or biochemical parameters associated with percent changes in egFr during 4 years
Percent changes in eGFR per year Total subjects Normal weight
subjects
r P r P
Age -0.083 0.040 -0.093 0.045
systolic BP -0.154 0.001 -0.134 0.006
Diastolic BP -0.118 0.003 -0.089 0.066
BMI -0.209 0.001 -0.140 0.004
WC -0.207 0.001 -0.193 0.001
Whr -0.182 0.001 -0.197 0.001
PBF -0.200 0.001 -0.211 0.001
Fat mass -0.248 0.001 -0.248 0.001
lean mass -0.080 0.052 0.018 0.071
Uric acid -0.103 0.011 -0.026 0.59
Total cholesterol -0.102 0.011 -0.066 0.171
lDl-cholesterol -0.049 0.22 -0.034 0.48
hDl-cholesterol 0.153 0.001 0.134 0.006
Tg -0.261 0.001 -0.233 0.001
Fasting glucose -0.125 0.002 -0.159 0.001
Baseline egFr -0.031 0.44 -0.046 0.33
log hs-CrP -0.180 0.001 -0.151 0.005
Abbreviations: eGFR, estimated glomerular filtration rate; BP, blood pressure; BMI, body mass index; WC, waist circumference; Whr, waist-to-hip ratio; PBF, percentage of body fat; lDl, low-density lipoprotein; hDl, high-density lipoprotein; Tg, triglycerides; hs-CrP, high-sensitivity C-reactive protein.
this study. This simple, inexpensive, quick, and noninvasive technique can be easily used in clinical practice.20
In our subjects, the absolute decline in eGFR over the 4 years and the percent change per year were -3.0 mL/minute/
1.73 m2 and -0.87%/year in men and -3.1 mL/minute/1.73 m2
and -0.89%/year in women, similar to previously reported rates. In addition to previously well-established risk factors, such as increasing age and higher systolic BP, an increased fat mass also plays an important role in RFD; men and women in the highest PBF tertile showed a 2.76-fold and 2.02-fold increased risk of a significant RFD, respectively. Supporting our current observation, previous experimental and clinical data have shown that obesity is closely associated with an early onset of proteinuria, indicating the harmful effect of obesity on early changes in renal hemodynamics.21 These findings
could be explained by the crosstalk between adipose tissue and blood vessels.22,23 The adipose tissue in obese individuals
becomes highly inflamed and induces vascular dysfunction by augmented secretion of vasoconstriction factors (such as the major components of the renin–angiotensinogen–aldosterone system and superoxide) and proinflammatory adipokines, which are important contributors to endothelial activation, vascular inflammation, and neointimal formation.24 Not
sur-prisingly, the serum hs-CRP levels in our study increased with increasing PBF tertiles in both sexes.
One more interesting finding in our study is that the detri-mental effect of increased adiposity on renal function was also observed in subjects with a normal weight, too. These meta-bolically obese normal-weight individuals were first described in the late 1990s.25 In our study, 426 (69.3%) subjects had
a normal weight (93 men; 333 women), and the prevalence of NWO was 34.4% in men and 32.7% in women, using sex-specific tertiles of PBF. Similar to other NWO-related
Clinical Interventions in Aging downloaded from https://www.dovepress.com/ by 118.70.13.36 on 20-Aug-2020
Dovepress
Kim et al
Table 5 effect of PBF on changes of renal function: results of multivariate analysis
Variables Percent changes in eGFR per year
B Standard error B β P
Total subjects
Age (per 1 year) -0.002 0.009 -0.012 0.775
systolic BP (per 1 mmhg) -0.010 0.005 -0.095 0.029
PBF (per 1% increase) -0.055 0.012 -0.181 0.001
hDl (per 1 mg/dl increase) 0.012 0.005 0.099 0.019
Fasting glucose (per 1 g/dl increase) -0.004 0.003 -0.050 0.220
Uric acid (per 1 mg/dl increase) -0.059 0.056 -0.045 0.294
normal weight subjects
Age (per 1 year) -0.008 0.010 -0.041 0.425
systolic BP (per 1 mmhg) -0.009 0.006 -0.079 0.132
PBF (per 1% increase) -0.045 0.016 -0.141 0.006
hDl (per 1 mg/dl increase) 0.010 0.006 0.09 0.080
Fasting glucose (per 1 g/dl increase) -0.007 0.004 -0.085 0.087
Uric acid (per 1 mg/dl increase) 0.059 0.073 0.043 0.418
Abbreviations: B, beta coefficient; PBF, percentage of body fat; eGFR,estimated glomerular filtration rate; BP, blood pressure; HDL, high-density lipoprotein; hs-CRP, high-sensitivity C-reactive protein.
Table 6 Risk for significant RFD by PBF tertiles
Odds ratio (95% CI) 1st tertile 2nd tertile 3rd tertile
Total subjects
Men
Model 1 reference 2.65 (1.09–6.45)* 3.93 (1.65–9.35)*
Model 2 reference 2.62 (1.07–6.41)* 3.84 (1.59–9.33)*
Model 3 reference 1.62 (0.90–4.54) 2.76 (1.28–7.74)*
Women
Model 1 reference 1.71 (0.99–3.10) 3.59 (2.01–6.41)*
Model 2 reference 1.46 (0.80–2.69) 3.22 (1.78–5.81)*
Model 3 reference 1.18 (0.59–2.32) 2.02 (1.06–4.43)*
Normal weight subjects
Men
Model 1 reference 2.07 (0.58–7.41) 3.53 (1.06–11.69)*
Model 2 reference 2.06 (0.57–7.44) 3.45 (1.02–11.70)*
Model 3 reference 1.69 (0.55–9.42) 3.15 (1.03–18.52)*
Women
Model 1 reference 1.40 (0.92–2.78) 2.57 (1.28–5.14)*
Model 2 reference 1.36 (0.81–2.78) 2.41 (1.20–4.89)*
Model 3 reference 1.02 (0.45–2.01) 1.44 (1.01–3.28)*
Notes: Model 1 was adjusted for age, smoking. Model 2 was adjusted for: age; sex; smoking; systolic BP; and diastolic blood pressure. Model 3 was adjusted for: age; sex; smoking; systolic BP; diastolic BP; WC; glucose; Tg; high-density lipoprotein; hs-CrP; uric acid; and nsAID use. *P0.001.
Abbreviations: RFD, renal function decline; PBF, percentage body fat; CI, confidence interval; BP, blood pressure; WC, waist circumference; TG, triglycerides; hs-CRP, high-sensitivity C-reactive protein; NSAID, nonsteroidal anti-inflammatory drug.
metabolic complications, the presence of NWO also serves as a main predictor of RFD in the general population even after adjustment for well-established numerous vascular risk factors. These findings provide important insights into under-standing obesity; subjects who would otherwise be considered nonobese based on a normal BMI may actually be at high risk for renal dysfunction. Therefore, the measurement of PBF using bioelectrical impedance analyzers may be a more useful and precise technique with which to identify metabolically obese people, and a reduction in body fat rather than body
weight may be more important to prevent obesity-related medical complications in the general population.
However, contrary to previous data, the lean body mass and baseline renal function had no relationship to GFR changes over the 4 years of our study. In fact, a lower baseline eGFR is a well-established risk factor for a more rapid decline in eGFR. We considered this inconsistency to be caused by the characteristics of our subjects; ie, only subjects with normal or mildly impaired renal function were enrolled, therefore, the baseline eGFR might have no
Clinical Interventions in Aging downloaded from https://www.dovepress.com/ by 118.70.13.36 on 20-Aug-2020
Dovepress Increased body fat and renal function decline
relationship to eGFR changes.26,27 Moreover, although lean
body mass is also associated with renal function, it is usually more relevant in patients with chronic medical problems whose lean body mass is typically reduced. In patients with chronic medical conditions, such as chronic kidney disease, chronic obstructive lung disease, or Alzheimer’s disease, low muscle mass is usually related to malnutri-tion, physical inactivity, and higher chronic inflammation state;28–30 thus, all these factors contribute to rapid RFD. In
this study, however, as relatively healthy individuals were analyzed, lean body mass seems to have no relationship to GFR changes.
This study has several limitations. First, the serum creati-nine level was measured only twice; therefore, we could not calculate the GFR slope or the rate of RFD. Therefore, we calculated the absolute difference in the eGFR and percent changes during the 4 years. Moreover, the possibility of acute kidney injury at the time of the two tests cannot be ruled out. However, all tests are assumed to have been performed at steady state because this examination was part of a health screening check-up. Those with acute illness would not have undergone such a health check-up. Second, although we excluded subjects with preexisting vascular disease or risk factors, such as diabetes and hypertension, subjects with undiagnosed diabetes or hypertension may have been included in this study. Similarly, although we excluded those with proteinuria, there is also a possibility of inclusion of subjects with glomerulonephritis.
In conclusion, among the elderly population without comorbidities, increased body fat has a harmful effect on renal function changes irrespective of body weight.
Acknowledgments
This study was supported by a grant from the Genomic Cohort of Healthy Populations with Regular Health Check-up at Large Hospitals, funded by the Korea Centers for Disease Control and Prevention (2012). The English in this document has been checked by at least two professional editors, both native speakers of English.
Disclosure
The authors report no conflicts of interest in this work.
References
1. Kang HT, Lee J, Linton JA, Park BJ, Lee YJ. Trends in the prevalence of chronic kidney disease in Korean adults: the Korean National Health and Nutrition Examination Survey from 1998 to 2009. Nephrol Dial Transplant. 2013;28(4):927–936.
2. Obesity: preventing and managing the global epidemic. Report of a WHO consultation. World Health Organ Tech Rep Ser. 2000;894: (i–xii):1–253.
3. Eknoyan G. Obesity and chronic kidney disease. Nefrologia. 2011;31(4):397–403.
4. Chertow GM, Hsu CY, Johansen KL. The enlarging body of evi-dence: obesity and chronic kidney disease. J Am Soc Nephrol. 2006;17(6):1501–1502.
5. Wang Y, Chen X, Song Y, Caballero B, Cheskin LJ. Association between obesity and kidney disease: a systematic review and meta-analysis. Kidney Int. 2008;73(1):19–33.
6. Praga M. Obesity – a neglected culprit in renal disease. Nephrol Dial Transplant. 2002;17(7):1157–1159.
7. Ejerblad E, Fored CM, Lindblad P, Fryzek J, McLaughlin JK, Nyrén O. Obesity and risk for chronic renal failure. J Am Soc Neprhol. 2006;17(6): 1695–1702.
8. Romero-Corral A, Somers VK, Sierra-Johnson J, et al. Accuracy of body mass index in diagnosing obesity in the adult general population.
Int J Obes (Lond). 2008;32(6):959–966.
9. Prospective Studies Collaboration; Whitlock G, Lewington S, Sherliker P, et al. Body-mass index and cause-specific mortality in 900 000 adults: collaborative analyses of 57 prospective studies. Lancet. 2009; 373(9669):1083–1096.
10. Franzosi MG. Should we continue to use BMI as a cardiovascular risk factor? Lancet. 2006;368(9536):624–625.
11. Poirier P. Adiposity and cardiovascular disease: are we using the right definition of obesity? Eur Heart J. 2007;28(17):2047–2048. 12. Lopez-Jimenez F. Speakable and unspeakable facts about BMI and
mortality. Lancet. 2009;373(9669):1055–1056.
13. Romero-Corral A, Somers VK, Sierra-Johnson J, et al. Normal weight obesity: a risk factor for cardiometabolic dysregulation and cardiovas-cular mortality. Eur Heart J. 2010;31(6):737–746.
14. De Lorenzo A, Martinoli R, Vaia F, Di Renzo L. Normal weight obese (NWO) women: an evaluation of a candidate new syndrome. Nutr Metab Cardiovasc Dis. 2006;16(8):513–523.
15. De Lorenzo A, Del Gobbo V, Premrov MG, Bigioni M, Galvano F, Di Renzo L. Normal-weight obese syndrome: early inflammation? Am J Clin Nutr. 2007;85(1):40–45.
16. Baumgartner RN, Stauber PM, McHugh D, Koehler KM, Garry PJ. Cross-sectional age differences in body composition in persons 60+ years of age. J Gerontol A Biol Sci Med Sci. 1995;50(6):M307–M316. 17. Zhu W, Cai D, Wang Y, et al. Calcium plus vitamin D3
supplementa-tion facilitated fat loss in overweight and obese college students with very-low calcium consumption: a randomized controlled trial. Nutr J. 2013;12:8.
18. Lindeman RD, Tobin J, Shock NW. Longitudinal studies on the rate of decline in renal function with age. J Am Geriatr Soc. 1985;33(4): 278–285.
19. Eriksen BO, Ingebretsen OC. The progression of chronic kidney dis-ease: a 10-year population-based study of the effects of gender and age.
Kidney Int. 2006;69(2):375–382.
20. Snijder MB, van Dam RM, Visser M, Seidell JC. What aspects of body fat are particularly hazardous and how do we measure them? Int J Epidemiol. 2006;35(1):83–92.
21. Henegar JR, Bigler SA, Henegar LK, Tyagi SC, Hall JE. Functional and structural changes in the kidney in the early stages of obesity. J Am Soc Neprhol. 2001;12(6):1211–1217.
22. Gu P, Xu A. Interplay between adipose tissue and blood vessels in obesity and vascular dysfunction. Rev Endocr Metab Disord. 2013;14(1):49–58. 23. Li FY, Cheng KK, Lam KS, Vanhoutte PM, Xu A. Cross-talk between
adipose tissue and vasculature: role of adiponectin. Acta Physiol (Oxf).
2011;203(1):167–180.
24. Xu A, Vanhoutte PM. Adiponectin and adipocyte fatty acid binding protein in the pathogenesis of cardiovascular disease. Am J Physiol Heart Circ Physiol. 2012;302(6):H1231–H1240.
25. Ruderman N, Chisholm D, Pi-Sunyer X, Schneider S. The metaboli-cally obese, normal-weight individual revisited. Diabetes. 1998;47(5): 699–713.
26. Imai E, Horio M, Yamagata K, et al. Slower decline of glomerular filtration rate in the Japanese general population: a longitudinal 10-year follow-up study. Hypertens Res. 2008;31(3):433–441.
Clinical Interventions in Aging downloaded from https://www.dovepress.com/ by 118.70.13.36 on 20-Aug-2020
Clinical Interventions in Aging
Publish your work in this journal
Submit your manuscript here: http://www.dovepress.com/clinical-interventions-in-aging-journal
Dovepress
Clinical Interventions in Aging is an international, peer-reviewed journal focusing on evidence-based reports on the value or lack thereof of treatments intended to prevent or delay the onset of maladaptive correlates of aging in human beings. This journal is indexed on PubMed Central, MedLine,
CAS, Scopus and the Elsevier Bibliographic databases. The manuscript management system is completely online and includes a very quick and fair peer-review system, which is all easy to use. Visit http://www.dovepress. com/testimonials.php to read real quotes from published authors.
Dovepress
Kim et al
27. Ishani A, Grandits GA, Grimm RH, et al. Association of single measurements of dipstick proteinuria, estimated glomerular filtration rate, and hematocrit with 25-year incidence of end-stage renal dis-ease in the multiple risk factor intervention trial. J Am Soc Neprhol. 2006;17(5):1444–1452.
28. Baxmann AC, Ahmed MS, Marques NC, et al. Influence of muscle mass and physical activity on serum and urinary creatinine and serum cystatin C. Clin J Am Soc Neprhol. 2008;3(2):348–354.
29. Ezzell L, Jensen GL. Malnutrition in chronic obstructive pulmonary disease. Am J Clin Nutr. 2000;72(6):1415–1416.
30. Poehlman ET, Dvorak RV. Energy expenditure, energy intake, and weight loss in Alzheimer disease. Am J Clin Nutr. 2000;71(2):650S–655S.
Clinical Interventions in Aging downloaded from https://www.dovepress.com/ by 118.70.13.36 on 20-Aug-2020