Study of the La
0.2235Pr
0.2235Nd
0.2235Sr
0.33MnO
3ceramic by X
ray diffraction and impedance spectroscopy
F. I. H. Rhouma1a, A. Dhahri1, N. Farhat1, J. Dhahri1 and K. Khirouni2
1
Unity of Search for Physics of solids, Faculty of Science of Monastir, Departement of Physics, 5019 Monastir, Tunisia.
2
Laboratory of physics of Materials and the Nanostructures applied to the environment, Faculty of Science of Gabès.
Abstract. .The La0.2235 Pr0.2235 Nd0.2235 Sr0.33 MnO3 (LPNSM) ceramic has been obtained
from oxides by sintering in air. The electrical properties of this material have been studied using ac impedance spectroscopy technique over a wide range of temperatures and frequency. Furthermore, a detailed analysis of the impedance spectrum suggested that the electrical properties of the material are strongly temperature dependent and have a good correlation with the sample microstructure in different temperature ranges.
1 Introduction
Over the past a few years, the manganites with the form of Ln1-x AxMnO3 (Ln = trivalent rare earth,
A = divalent alkaline earth) have been attracted much attention due to their extraordinary magnetic and electric properties and their promise for the future technological applications [1-3]. Electrical conduction in these materials has contributions from grains (bulk), grain boundaries, and electrode specimen interface [4, 5]. In order to understand the conduction behavior, it is necessary to separate the various contributions to the total observed resistance. Complex Plane Impedance Analysis (CPIA) technique is very useful in solid state electronic systems [6, 7]. The present paper aims at analyzing the effect of the A-site cation in perovskite related materials on the electrical properties in order to elaborate new lead-free ceramic with formulaLa0.2235 Pr0.2235 Nd0.2235 Sr0.33 MnO3. Impedance
analysis approach has been used to separate the real and imaginary components of electrical reponse and estimate the relaxation τm at different temperatures.
2. Experimental
2. 1 Synthesis of LPNSM ceramic
Powders perovskite La0.2235 Pr0.2235 Nd0.2235 Sr0.33 MnO3 were prepared by a conventional solid-state
reaction. The precursors La2O3, Pr6O11, Nd2O3, MnO2 and SrCO3 of high purity (more than 99.9%)
powders were mixed in stoichiometric proportions. Mixtures were first calcined at 1173K for 24 h in air to achieve decarbonation. After grinding, they were heated at 1200K for 24h and reground again
a
e-mail : [email protected]
DOI: 10.1051/
C
Owned by the authors, published by EDP Sciences, 2012
to ensure homogenization. The powders were pressed into pellets and sintered at 1623K for 24h in air with several grinding and repelleting. Finally, these pellets were rapidly quenched to room temperature.
2. 2 Characterizations
Phase purity and structure of bulk sample were identified by X-ray diffraction at room temperature using a Siemens D5000 X-ray diffractometer with a graphite monochromatized Cuk radiation (λCuKα= 1.54056Ǻ).The structure refinement was carried out by the Rietveld analysis of the X-ray powder diffraction data with FULLPROF software (version 1.9-Mars 2006-LLB-JRC) [8]. Data for the Rietveld were collected in the 2θ range 20-120° with a step size of 0.02° and a counting time of 18 steps. For electrical measurements, two indium plots separated by a distance of 5 mm were deposited on the pellet to ensure ohmic contact. An agilent 4294 impedance analyzer was used to collect impedance measurements over a wide frequency range.
3. Results and discussion
3.1 X-ray diffraction
The X-ray diffraction pattern of the sample was recorded at room temperature and based on this pattern, its crystal structure was refined by Rietveld’s profile fitting. An ordinary (observed) XRD pattern ofLPNSM sample along with its Rietveld refined one and a curve showing the difference between both patterns are shown in Figure 1.
Fig.1. Rietveld plot of XRD data polycrystallineLPNSM pellet at 300K.
We can see from this figure, that the sample is a single phase and can be indexed in a rhombohedral structure at room temperature with the lattice parameters: a=b=5.483 Ǻ and c= 13.343 Ǻ. No traces of secondary phases were detectable, within the sensitivity limits of the experiment (a few percent). The perovskite structure is a network oxide with the general formula ABO3. In
LPNSMsystem A-site is occupied La3+=1.216 Ǻ, Pr3+ = 1.178Ǻ, Nd3+ = 1.163 Ǻ, Sr2+ = 1.31 Ǻ and Mn3+ = 0.71 Ǻ, Mn4+ = 0.51 Ǻ ion occupied by the B-site of the perovskite. A simple description of the geometric packing within perovskite structure can be characterized by tolerance factor TG, which
is defined by the following equation [9], TG=(rO+rA)/(21/2(<rO>+<rB>)),where rA, rB and rO are ionic
radii of A-site cation, B-site cation and anion respectively. The value of TG= 0.91 has been estimated
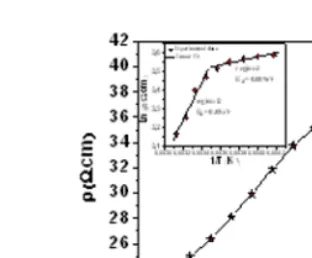
Fig.2. Temperature dependence of the resistivity in zero magnetic appliedfor LPNSM.
First, at low temperature (T < 240 K), the resistivity ρ increases when increasing temperature. Then, for temperature high than 240 K, the plot shows a decrease of ρ. As known, the decrease of the resistivity when increasing temperature indicates the presence of semiconductor behavior where the conduction is thermally activated. To confirm this idea, we have plotted the variation of Ln (ρ) versus 1/T (inset of Figure 2). At low temperature, a linear variation was observed, which proves that the conduction, for the sample, is thermally activated can be expressed by ρ (T)=A exp(Ea/kBT), here T is the absolute temperature, kB is the Boltzmann temperature, A is the pre-exponential factor and
Ea is the activation energy. The activation energies are found to be 0.08eV and 0.009 eV.
3. 2 Electrical properties
3.2.1 Electric conduction mechanism
The values of the conductivity were calculated from the complex impedance data using σ= e/S (Z’/ (Z’2+Z’’2)) where, S is the cross-sectional area of the flat surface of the pellet and e is its thickness. Figure 3 shows the frequency-dependent spectra of electric conductivity for LPNSM at a few selected temperatures.
Fig.3. Variation of electrical conductivity of LPNSMas a function of frequency
A plateau is observed in the plots in the low frequency region, i.e. where σ is frequency independent. It is the region of dc conductivity, σdc. The plateau region extends to higher frequencies
materials. The characteristic features of conductivity spectra can be explained using Jonscher’s law [10]:
σ=σdc+Aωn (1)
Where ω is the angular frequency of measurement, A and n are fitting parameters, which are, principally, temperature dependent. The exponent n is related to the interaction of the transferring charge entities with the matrix and A depends on the material. In order to calculate the dc conductivity (σdc), frequency exponent (n), hopping frequency (ωp), mobility (µ) and carrier
concentration (N), the non linear fitting was done on the basis of Jonscher’s power law for all the conductivity graphs (Figure 3) and in addition on the following equations are also used for the calculations:
ωp=(dc/A)1/n (2)
N= dcT/ωp (3)
µ=dc/Ne (4)
The calculated values and the representative nonlinear fitting curves are given in Table 1 and Figure 3 respectively. It is seen that the fitting was perfectly matched with the measured values.
Table.1 Conductivity parameters
T (K) ωp x106(Hz) Nx 10-6(S.m-1Hz-1) µx 1023(m2V/s) 80 140 160 200 240 260 280 6.47 6.30 5.66 5.37 5.12 5.12 5.05 5.16 7.88 9.42 11.01 13.02 14.36 16.40 5.05 2.81 2.21 1.67 1.33 1.23 1.12
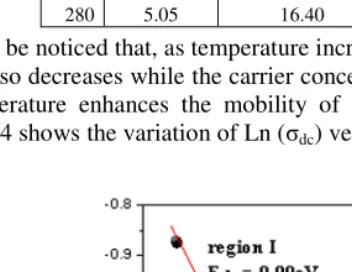
From this table, it can be noticed that, as temperature increases, the hopping frequency decreases and the carrier mobility also decreases while the carrier concentration increases. It can be concluded that the increase in temperature enhances the mobility of the charge carriers as well as the carrier concentration. Figure 4 shows the variation of Ln (σdc) versus 1/T.
Fig. 4 Temperature dependence of Ln(dc)
This plot is explained by an Arrhenius type relation: σdc= Bexp(-Edc/kBT) [11], here B is the pre exponential factor and Edc is the thermal activation energy for the ion migration. The change of the
3.2.2 Impedance studies
In order to carry out more detailed analyses of dielectric properties and its temperature dependence, impedance spectroscopy [12]
was employed. Figure 5 shows the Nyquist plots for the LPNSM ceramic measured at different temperatures.
Fig.5 Complex impedance spectrum as a function of temperature with electrical equivalent circuit (inset).
The impedance spectrum is characterized by the appearance of the semicircle arcs whose pattern changes, but not its shape, when the temperature is increased. Such pattern tells us about the electrical process occurring within the sample and their correlation with sample microstructure, when modeled in terms of an equivalent circuit [13, 14]. The equivalent circuit configuration for the impedance is Rg+ Rgb//Cgb shown in the inset of Figure 5. The intercept with real axis of the
semicircle at low frequencies is ascribed to the total resistance RT. On the other hand, the impedance
response of grain dominates at high frequencies and the resistances of grain Rg can be deduced from
the left intersect of the semicircle with real axis. The intercept of the semicircle with the real axis (Z’) at low frequencies represents the sum of the resistance of grains and grain boundaries, while the intercept at high frequency represents the resistance of the grain only. Deduced values of Rg, Rgb and
Cgb for different temperatures are listed in Table 2.
Table.2 Values of electrical parameters deduced from the complex diagram for LPNSM. T (K) Rg (Ω) Rgb (Ω) Cgb (nF)
80 140 180 220 240 280 320 17.74 16.81 14.91 13.37 12.71 13.29 15.29 29.60 39.07 48.59 56.62 59.08 53.80 32.13 10.39 8.59 7.21 6.90 6.82 7.65 11.30
The expression of real (Z’) and imaginary (Z’’) components of impedance related to the equivalent circuit is:
Z’= Rg + (Rgb/1+Rgb
2
Cgb 2
ω2) (5)
Z’’= Rgb2Cgb2ω/ (1+Rgb 2
Cgb 2
ω2) (6)
Where ω= 2πf and f is the frequency, Rg is the resistance of the grain while Rgb and Cgb are that of
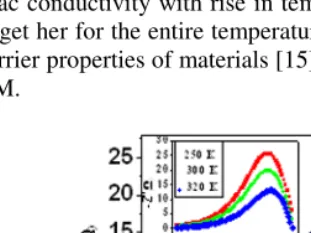
Fig.6 Real complex spectrum (Z’ versus frequency plot f) of LPNSM.
Here the magnitude of Z’ decreases with the increase in both frequency as well as temperature; indicate an increase in ac conductivity with rise in temperature and frequency. At higher frequency all the curves merge to get her for the entire temperature. This may be due to the release charge as a result of lowering of barrier properties of materials [15]. Figure 7 represents the variation of Z’’ with frequency of the LPNSM.
Fig.7 Imaginary complex spectrum (Z’’versus frequency plot f) of LPNSM at different temperatures.
The nature of the pattern is characterized by (i) a decrease in the height of the peaks with rise in temperature, (ii) significant broadening of the peaks with rise in temperature, (iii) marked asymmetry in the peak pattern, and (iv) merger of the spectrum at higher frequencies irrespective of temperature. Broadening of the peaks with a rise in temperature suggests the presence of temperature dependant relaxation process in the material. The asymmetric broadening of the peaks suggests the presence of electrical processes in the material with spread of relaxation time (indicated by peak width) with two equilibrium portions. The relaxation species may possibly be electrons /oxygen ion vacancies among available localized sites. In relaxation system, one can determine the most probable relaxation time τ from the position of peaks in the Z’’ versus frequency plots according to the relation τ= 1/ω= 1/2πfr
(fr -relaxation frequency). The nature of variation of τ with temperature for the sample is shown in
Figure 8. The value of activation energies evaluated from the slope of Ln(τ) versus 1/T are respectively 0.007eV and 0.04 eV. It is worth noticing that the activation energies Erelax are equal to
the activation energies Edc, which means that the relaxation process and the electrical conductivity
Fig.8 Typical variation of relaxation time τ as a function of temperature for LPNSM
4. Conclusion
The electrical properties of the material, investigated reveal both the bulk and grain boundary contribution, which are dependent strongly on temperature. The Jonscher’s power law was used to analyze ac conductivity data and determined the dc conductivity and the hopping frequency. Analysis confirms that electrical relaxation and conduction arise out of the similar type of charge carriers.
References
1. K. F. Wang, F. Yuan, S. Dong, D. Li, Z. D. Hang, Z. F. Ren,J. M. Li, Appl. Phys. Lett. 89 222505 (2006)
2. L. Li, K. Nishimura, M. Fujii, K. Mori, Solid State Commun. 144, 10-14 (2007)
3. J. Dhahri, A. Dhahri, M. Oumezzine, E. Dhahri, M. Said, H. Vincent, J. Alloys Comp. 467, 44-47 (2009)
4. I. M. Hodge, M. D. Ingram, A. R. West, J. Electroanal. Chem. 74, 125 (1976).
5. C. Y. Hsu, Hsiung Cjou, B. Y. Liao, J. C. A. Huang, Appl. Phys. Lett. 89, 262501(2006). 6. H. S. Maiti, R. N. Basu, Mater. Res. Bull. 21, 1107 (1987).
7. M. Nadeem, M. J. Akhtar, M. N. Haque, Solid State communications 145, 263-266 (2008) 8. H. M. Rietveld, J. Appl. Crystallogr. 2, 65(1969).
9. Naratip Vttayaokom, Gobwute Rujijanagul and Tawee Tunakasri, J. Mater. Res, 18, 12 (2003) 10.A. K. Jonscher, Nature 267, 673 (1977)
11.K. S. Rao, P. M. Krishna, D. M. Prasad, J. H. Lee, J. S. Kim, J. Alloys Compd.464, 497,(2008) 12.J. Rossac Donald, Impedance spectroscopy (1987).
13.D. K. Pradhan, B. K. Samantary, R. N. P.
14.Chaudhary, A. K. Thakur, Mater. Sci. Eng.B 116, 7(2005)