Article
1
Evolution of the Material Microstructures and
2
Mechanical Properties of A1100 Aluminum Alloy
3
within a Complex Porthole Die during Extrusion
4
Ding Tang1,2, Wenli Fang1,2, Xiaohui Fan1,2, Tianxia Zou1,2, Zihan Li1,2, Huamiao Wang1,2,
*,
5
Dayong Li1,2, Yinghong Peng1,2, Peidong Wu3
6
1 State Key Laboratory of Mechanical System and Vibration, Shanghai Jiao Tong University, Shanghai,
7
200240, China;
8
2 School of Mechanical Engineering, Shanghai Jiao Tong University, Shanghai, 200240, China;
9
3 Department of Mechanical Engineering, McMaster University, Hamilton, ON, L4S 4L7, Canada;
10
* Correspondence: Dr. Huamiao Wang, Tel.: +86-21-34206770, E-mail: [email protected]
11
12
Abstract: Micro channel tube (MCT) is widely employed in industry due to its excellent efficiency
13
in heat transfer. An MCT is commonly produced through extrusion within a porthole die, where
14
severe plastic deformation is inevitably involved. Moreover, the plastic deformation, which
15
dramatically affects the final property of the MCT, varies significantly from location to location. In
16
order to understand the development of the microstructure and its effect on the final property of
17
the MCT, the viscoplastic self-consistent (VPSC) model, together with the finite element analysis
18
and the flow line model, is employed in the current study. The flow line model is used to reproduce
19
the local velocity gradient within the complex porthole die, while VPSC model is employed to
20
predict the evolution of the microstructure accordingly. In addition, electron backscatter diffraction
21
(EBSD) measurement and mechanical tests are used to characterize the evolution of the
22
microstructure and the property of the MCT. The simulation results agree well with the
23
corresponding experimental ones. The influence of the material’s flow line on the evolution of the
24
orientation and morphology of the grains, and the property of the produced MCT are discussed in
25
detail.
26
Keywords: Micro channel tube (MCT); Extrusion; Porthole die; Microstructure evolution; VPSC
27
model; Flow line model
28
29
1. Introduction
30
Multi-port extrusion (MPE) tubes are widely applied in industry to transfer the substances of
31
liquid, gas or slurries etc. As one of the MPE tubes, micro channel tube (MCT) exhibits excellent
32
performance in heat transfer and have been employed more and more in heat exchangers. An MCT
33
is commonly produced through a processing chain of extrusion, rolling and brazing [1-4]. The
34
extrusion process, which involves severe plastic deformation, affects the final microstructure the
35
most, though both rolling and brazing are important as well. The microstructure of aluminum alloys
36
under thermal-mechanical loading have been extensively investigated [1-6], which eventually
37
governs the mechanical properties of the MCTs. However, the MCT is produced by the porthole
38
extrusion die with the specially designed mandrel [7]. The large extrusion ratio and the existence of
39
the mandrel lead to assorted flow and severe deformation of the base material, and complicated
40
evolution of the microstructure. The features of the microstructure developed under extrusion are
41
inherited by the final products and affect their properties significantly. The authors’ group
42
experimentally studied the development of the microstructure of aluminum MCTs during the
43
porthole die extrusion [8]. We characterized the grain morphology and orientation in terms of
44
electron backscattered diffraction (EBSD) and optical microscope (OM), where significant grain
45
refinement and texture development were observed because of the severe plastic deformation.
46
Moreover, remarkable variation of the microstructure along the through-thickness direction was
47
obtained. We also realized that the quantitative interpretation of the development of the
48
microstructure is hardly accomplished by merely experimental techniques.
49
With the aid of constitutive modeling, it is believed that the underlying mechanisms associated
50
with the development of the microstructure can be understood better. In recent years, the crystal
51
plasticity methods have been extensively applied to understand physical mechanisms associated
52
with large deformation [9-15]. Therefore, the viscoplastic self-consistent (VPSC) model, which is one
53
of the most popular crystal plasticity models, is employed in the current work. The challenge of using
54
VPSC model is that the material point will experience different deformation history at different
55
location within the porthole die. Mayama et al. [16] found that the shear strain of the material is small
56
around the central line, while that becomes relatively large at locations apart from the central line.
57
The developed texture of AZ31 alloy under extrusion was also found to be different from location to
58
location by Gall et al. [17].
59
As a consequence, in order to investigate the variation of microstructure of the material during
60
manufacturing, the flow line method developed by Arruffat-Massion et al. [18] is employed in the
61
current work to track the deformation history within the die. Experiments have demonstrated that
62
the deformation history is more reasonably described by the metal flow line than a simple shear
63
assumption [19, 20]. The combination of the flow line method and the VPSC model enables the
64
tracking of the evolution of the microstructure of aluminum alloy within the porthole die under
65
extrusion. Reasonable agreement is obtained through the comparison between the simulations and
66
experiments. The influence of strain paths on the inhomogeneity of microstructure is discussed in
67
detail.
68
2. Experiments
69
2.1 Material
70
The material used in this study was an AA1100 commercial-purity aluminum alloy because of
71
its excellent workability, weldability and corrosion resistance. The chemical composition of the alloy
72
is given in Table 1.
73
Table 1. Chemical composition of the aluminum alloy (AA1100).
74
Al Si Fe Cu Mn Zn Others
99.39 0.09 0.23 0.18 0.0005 0.0035 0.106
2.2 Extrusion
75
76
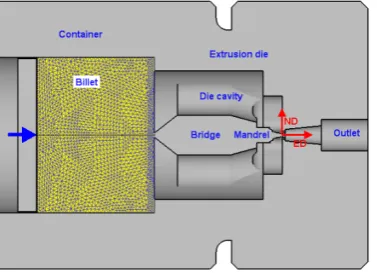
Figure 1. Schematic representations of (a) the regular die, (b) the porthole die, and (c) the mandrel
77
The extrusion experiment is performed using the porthole die shown in Fig. 1b. Compared to a
79
die for regular tubes (Fig. 1a), porthole die has much more complicated flow pattern (Fig. 1b). The
80
structure of the mandrel and the produced tube are shown in Fig. 1c. The aluminum alloy is divided
81
by the porthole bridge into two nearly symmetrical material flows. The two material flows rejoin in
82
the welding chamber and seam welded as they go through the mandrel teeth. The MCT is then
83
formed when the material is pushed out of the die. The billet of 95mm in diameter was lubricated
84
with MoS2 paste and preheated to 400°C, and then extruded with a ram speed of 2mm/s.
85
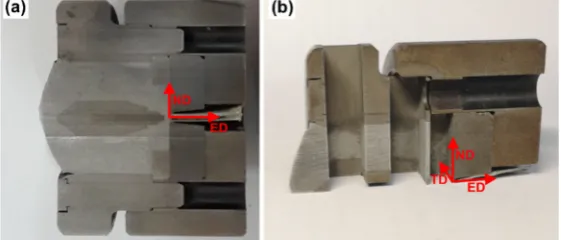
2.3 Microstructure observation
86
In order to observe the development of the microstructure within the porthole die, the extrusion
87
butt together with the die is quenched immediately after extrusion to preserve the grain structure
88
during extrusion. The extrusion butt, together with the die, is cut into two halves through the
ED-89
ND plane (Fig. 2a). The ED-ND surface is prepared to characterize the microstructure on the
90
longitudinal section. One half is further cut to obtain samples to characterize the microstructures in
91
cross section (TD-ND plane, Fig. 2b). The obtained surfaces are further ground and polished using
92
aluminum suspension and 0.02 um colloidal silica suspension, then etched with modified Keller’s
93
etchant for OM observation. For EBSD mapping, the surface is ground and polished by 2000# SiC
94
paper, and then electropolished by LectroPol 5 with electrolyte A2. EBSD examination is carried out
95
by NOVA NanoSEM 230 with Aztec HKL Max System. Along the metal flow line, seven typical
96
positions of the extrusion butt are carefully scanned by EBSD.
97
98
Figure 2. The observation section of the metal flow: (a) longitudinal section, and (b) cross section.
99
2.4 Mechanical tests
100
In order to evaluate the influence of the microstructure on the mechanical behavior of the MCT
101
tube, specimens at different location of the tube are prepared for tensile tests. Corresponding tensile
102
tests are conducted by an MTS CMT6103 testing equipment.
103
3. Numerical procedures
104
As shown in Fig. 1, due to the geometry of the porthole die, the deformation gradient of the
105
material is different from location to location. The numerical procedure is as following: 1) extrusion
106
process was simulated by using finite element (FE) method to obtain the flow lines of the material; 2)
107
the velocity gradient during the extrusion process is obtained by the flow line model [18]; and 3) the
108
evolution of the microstructure is simulated by the VPSC model based on the obtained velocity
109
gradient [8, 10].
110
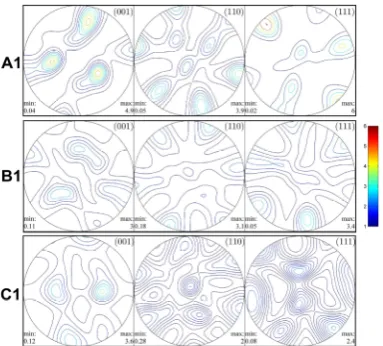
3.1 Finite Element Analysis
111
The extrusion process is modeled in the commercial finite element (FE) software Deform 3D,
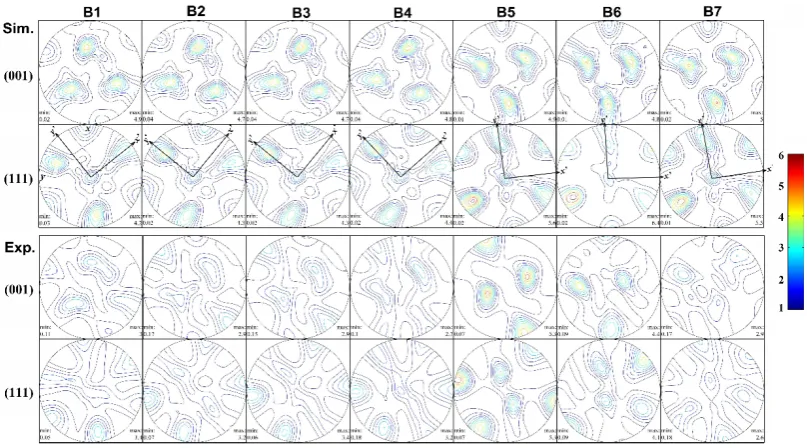
112
which is widely used in simulation of hot extrusion process. The geometrical model associated with
113
the porthole die is illustrated in Fig. 3. The boundary conditions and material properties are chosen
114
the die is accounted for in terms of the friction coefficient. The velocity field was extracted from FE
116
simulation results, which is used to determine the velocity field of the material within the die.
117
118
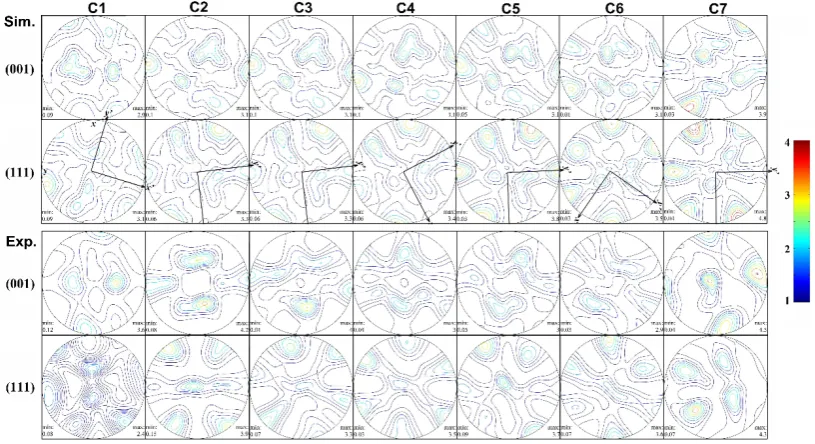
Figure 3. The finite element model generated by Deform 3D.
119
3.2 Flow line model
120
The flow line method has been proven to be an alternative effective method to quantitatively
121
evaluate deformation histories in extrusion processes by directly describing flow paths of the material
122
[19, 23]. In the present work, an orthogonal Cartesian coordinate system is established with x, y, and
123
z-axes along ED, ND and TD, respectively. Since the die dimension along TD is not changing, the
124
material flow within the die (at the plane of 𝑧 = 0) can be described by a flow function:
125
𝜙(𝑥, 𝑦) = 𝑦 − 𝑓(𝑥) = 0 (1)
126
An incompressible velocity field can be defined from the flow function 𝜙 as follows:
127
𝑣 = 𝜆
𝑣 = −𝜆 (2)
128
where 𝑣 and 𝑣 are the velocity components along ED and ND. 𝜆 is determined by the
129
incoming velocity of the material 𝑣 . Once the velocity field is obtained, the velocity gradient can be
130
obtained by
131
⎩ ⎪ ⎪ ⎨ ⎪ ⎪
⎧ 𝐿 = = 𝜆
𝐿 = = 𝜆
𝐿 = = −𝜆
𝐿 = = −𝜆
(3)
132
3.3 VPSC model
133
Once the velocity gradient is determined, the VPSC model is employed to simulate the
134
evolution of the microstructure accordingly. In the VPSC framework. the material is consisted of
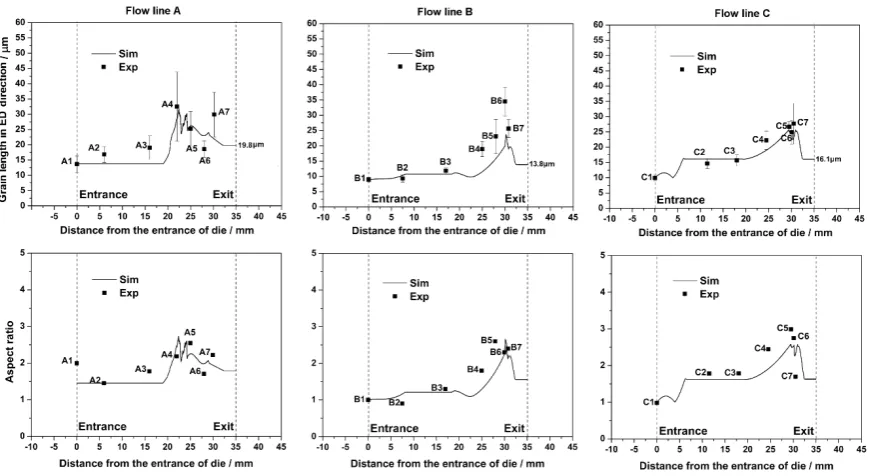
135
many grains. The aggregate of the grains is assumed as a homogenous equivalent medium (HEM),
136
where each grain is an embedded ellipsoidal inclusion. The interaction between the HEM and the
137
inclusion can be obtained by the Eshelby’s solution [24]. The (plastic) strain rate (𝜀 ) of each grain is
138
accommodated by shear rate (𝛾 ) on the slip system 𝛼,
139
𝜀 = ∑ 𝛾 (𝑠 𝑚 + 𝑚 𝑠 ) 2⁄ (4)
140
where 𝑠 and 𝑚 are respectively the slip direction of normal of the slip plane, respectively. The
141
shear strain rate of each slip system 𝛾 follows the power law:
142
𝛾 = 𝛾 𝑠𝑔𝑛(𝜏 ) (5)
143
where 𝛾 is the reference shear rate, 𝑛 is the rate sensitivity parameter, 𝜏 = 𝑠 𝜎 𝑚 is the
144
resolved shear stress (RSS), and 𝑔 is the threshold stress. The evolution of 𝑔 is given by
145
𝑔 = ∑ 𝑞 𝛾 (6)
where 𝑞 is the matrix describing the latent hardening of the crystal and all populated by 1. 𝜏̂ is
147
defined by an extended Voce law:
148
𝜏̂ = 𝜏 + (𝜏 + ℎ Γ) 1 − exp − 𝛤 (7)
149
where 𝜏 and 𝜏 + 𝜏 , are the initial and back-extrapolated threshold stresses, ℎ , and ℎ are the
150
initial and asymptotic hardening rates, respectively.
151
The grain refinement is considered in the VPSC model to crucially simulate the recrystallization.
152
The shape of the ellipsoidal inclusion is characterized by three principal axes 𝑎, 𝑏, 𝑐 with 𝑎 ≥ 𝑏 ≥ 𝑐,
153
which evolve with deformation. When the length ratio of 𝑎 𝑐⁄ the ellipsoidal grain reaches a critical
154
value 𝑅, the grain will be refined to two grains with the dimension of 𝑎/2, 𝑏, 𝑐. The crystallographic
155
orientation of the two grains remain the same as prior to refinement.
156
4. Results and discussion
157
4.1 Velocity gradient determination
158
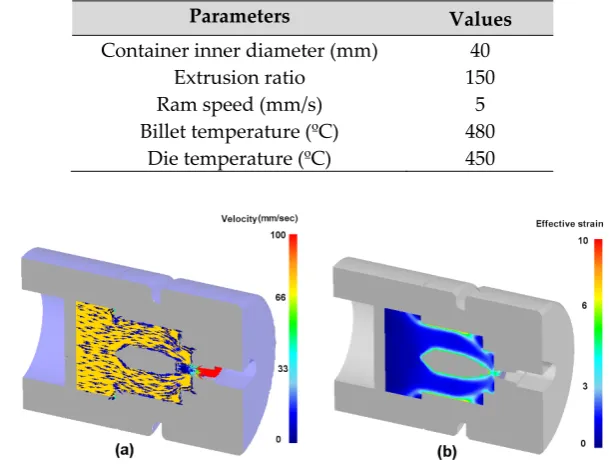
Table 2.
Billet material property and processing parameters in extrusion process.
159
Parameters Values
Container inner diameter (mm) 40 Extrusion ratio 150 Ram speed (mm/s) 5 Billet temperature (ºC) 480
Die temperature (ºC) 450
160
161
Figure 4. FE simulation results: (a) velocity field and (b) effective strain field.
162
The extrusion process is simulated by pushing the base material through the die. The model
163
parameters are listed in Table 2. The velocity field and the effective strain field simulated by the
164
Deform 3D are shown in Fig. 4. As expected, heterogenous deformation, especially strong gradient
165
along ND has been obtained. Three flow lines are extracted from the velocity field at locations close
166
to the bridge, close to the top surface of the die, and in between. The extracted flow lines are plotted
167
together with the strain rate field in Fig. 5a. Again, strong heterogenous strain rate field is gained.
168
We found that the flow lines extracted from the FE analysis can be well described by 4 sectioned
169
polynomial functions with maximum degree of 4. Therefore, the function 𝑓(𝑥) in Eq. (1) can be
170
expressed as:
171
𝑓 (𝑥) = ∑ 𝑎 𝑥 𝑥 ∈ [𝑥 , 𝑥 ] (8)
172
where 𝑎 is the polynomial coefficient of the sectional function within the ith zone of [𝑥 , 𝑥 ].
173
The entire x range of the porthole die is composed of the four zones (i.e., i=1, 2, 3 and 4). The
174
polynomial fittings are shown in Fig. 5b and the obtained polynomial coefficients are listed in Table
175
177
Figure 5. Flow lines of the aluminum alloy under extrusion within the porthole die: (a) FE simulation;
178
(b) Extracted flow lines and polynomial fitting.
179
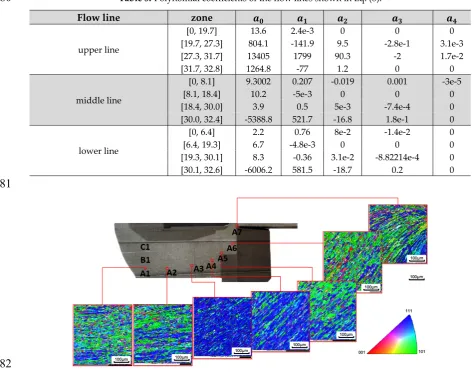
Table 3.
Polynomial coefficients of the flow lines shown in Eq. (8).
180
Flow line zone 𝒂𝟎 𝒂𝟏 𝒂𝟐 𝒂𝟑 𝒂𝟒
upper line
[0, 19.7] 13.6 2.4e-3 0 0 0
[19.7, 27.3] 804.1 -141.9 9.5 -2.8e-1 3.1e-3
[27.3, 31.7] 13405 1799 90.3 -2 1.7e-2
[31.7, 32.8] 1264.8 -77 1.2 0 0
middle line
[0, 8.1] 9.3002 0.207 -0.019 0.001 -3e-5
[8.1, 18.4] 10.2 -5e-3 0 0 0
[18.4, 30.0] 3.9 0.5 5e-3 -7.4e-4 0
[30.0, 32.4] -5388.8 521.7 -16.8 1.8e-1 0
lower line
[0, 6.4] 2.2 0.76 8e-2 -1.4e-2 0
[6.4, 19.3] 6.7 -4.8e-3 0 0 0
[19.3, 30.1] 8.3 -0.36 3.1e-2 -8.82214e-4 0 [30.1, 32.6] -6006.2 581.5 -18.7 0.2 0
181
182
Figure 6. Microstructure evolution in the longitudinal section along the flow line A characterized by
183
EBSD.
184
Figure 6 shows the variations of the grain size and orientation along the flow direction in the
185
porthole extrusion die. In the inlet section, most of the grains are equiaxed. It also can be seen that
186
the material undergoes shear deformation because of the difference of the flow speed from the center
187
of the metal flow to the boundaries. As the metal enters the seam welding chamber, owing to the
188
narrowed die channel, the shearing deformation becomes more significant. The grains are elongated
189
and align towards the material flow line. Together with the grain topology evolution, the orientations
190
(A6 and A7) along the extrusion direction show clear flow lines composed of similar orientation of
192
textures.
193
Figure 7 shows the variations of the microstructure of the cross section (ND-TD plane) at points
194
A2, A4 and A6 within the porthole extrusion die (Fig. 6). Obviously, equiaxed grains are observed in
195
the three observation sections, which reflects that the deformation is not varying significantly within
196
the ED-TD plane.
197
198
Figure 7. Microstructure evolution in the cross section (ND-TD plane) characterized by EBSD: (a)
199
point A2; (b) point A4 ; (c) point A6.
200
4.2 Parameters calibration
201
202
Figure 8. Initial textures obtained by EBSD at the beginning of the three flow lines.
203
The initial texture at positions of A1, B1 and C1 for corresponding flow lines are depicted in Fig.
204
8. The obtained initial textures are discretized into 1000 grains for the VPSC simulations. Uniaxial
205
compression test at temperature of 450°C is performed to characterize the mechanical behavior of
206
AA1100. The experimental stress strain curves at strain rates of 0.1, 1 and 10 /s are fitted by the VPSC
207
model to determine the model parameters. The fitting is shown in Fig. 9, where good agreement is
208
obtained, and the obtained parameters are listed in Table 4.
209
210
Table 4
Voce hardening parameters
212
𝝉𝟎 𝝉𝟏 𝜽𝟎 𝜽𝟏 n R
10 5.9 39 0 8.5 5
4.3 Texture evolution
213
With previous flow line model and calibrated hardening parameters, the texture evolution of
214
aluminum, grain size and morphology development along the extrusion flow line are simulated,
215
which can be used for analyzing rotation of grain orientation and mechanism of grain refinement in
216
a sophisticated path.
217
218
Figure 10. Experimental and Simulated {0 0 1} and {1 1 1} pole figures along the flow line A.
219
220
Figure 11. Experimental and Simulated {0 0 1} and {1 1 1} pole figures along the flow line B.
221
The velocity gradient from eq. (3) can be decomposed into symmetric and asymmetric parts.
222
The asymmetric part governs the rigid rotation of the material point within the die. Correspondingly,
223
a co-rotational coordinate is established following the path of flowing particles to eliminate the
224
influence of rigid rotation and better understand the effect of shear strain on texture evolution. The
225
textures with respect to different positions along the extrusion direction are calculated and
227
transformed onto corresponding normal plane of the flow lines. Figs. 10-12 presents the textures at
228
seven positions along each flow line to illustrate the evolution of the texture.
229
230
Figure 12. Experimental and Simulated {0 0 1} and {1 1 1} pole figures along the flow line C.
231
Figure 9 shows the experimental and simulated (0 0 1) and (1 1 1) pole figures evolution on flow
232
line A which is the outermost flow line. As can be seen, shear is not obvious in steady state
233
deformation zone from A1 to A3, and shear plane doesn’t rotate significantly. However, the rotation
234
of shear plane x'-y' becomes relatively large during aluminum flows from A3 to A4, which can be
235
attributed to the change of friction in aluminum flow since the first dead zone appear. The difference
236
in friction relationship between the flowing material and the die, as well as between the flowing
237
material and the stationary material in dead zone, results in counterclockwise rotation of the shear
238
plane. Slight clockwise rotation happens in shear plane from A4 to A5. While, shear plane rotates
239
counterclockwise again because of obstruction of aluminum in the second dead zone from A5 to A6.
240
Clockwise rotation takes place from A6 to A7. Contrast to experiment result on flow line A, slight
241
deviation between the experimental and numerical results can be found. The deviation takes place in
242
position A3 and A5, where the interaction between flowing aluminum and stationary material in
243
dead zone begins to occur. Because grain size of stationary material in dead zone is far greater than
244
that in flowing aluminum, the obstruction between stationary material in dead zone and flowing
245
aluminum is greater than the adhesive friction between die and aluminum, which results in clockwise
246
rotation of the shear plane.
247
Compared with the results in line A, shear is not obvious in steady state deformation zone from
248
B2 to B3 in line B (Fig. 11). Shear plane x'-y' rotates clock wisely when aluminum flows from position
249
B1 to B2, B3 to B4, B4 to B5, and B5 to B6. Finally, at the die export position B7, slight counterclockwise
250
rotation takes place. Material points on flow line B are furthest from the bridge and the external die,
251
which makes the influence of friction negligible.
252
Figure 12 shows (0 0 1) and (1 1 1) pole figures evolution on flow line C, which is the innermost
253
flow line. Because of 120°corner transition design on die diversion bridge, shear plane x'-y' rotate
254
clockwise when aluminum flows from position C1 to C2. The shear plane is nearly not rotating in
255
steady state deformation zone from C2 to C3. Counterclockwise rotation in shear plane takes place
256
when aluminum flows into severe shear deformation zone from C3 to C4. However, shear plane
257
rotates clockwise from C4 to C5 and C6 in severe shear deformation zone. Shear plane rotates
258
counterclockwise from C6 to C7 in seam-welding chamber. In contrast to the experimental results,
259
position C7, due to the joining of the two material flows, the status with high hydrostatic pressure
261
produces a cubic orientation, which is not accounted for by the VPSC model.
262
Through analysis for rotation law of shear plane above, the magnitude of shear on flow lines A,
263
B, and C is different from each other. The main reasons are as follows: on flow line B, the essential
264
factor for texture orientation change is the plastic flow of material; on flow line A, the change of shear
265
plane is affected by dead zone; on flow line C, the rotation of shear plane is restrained by the bridge
266
structure. Therefore, the methodology of combining the flow line model and the VPSC model can
267
accurately describe the development of grain orientation in complex material flow process.
268
4.4 Grain shape and size development
269
270
Figure 13. Experiment and simulation of the grain morphology in terms of grain size and aspect ratio
271
associated with the flow lines.
272
The influences of deformation history on microstructure evolution are investigated. The
273
microstructures at different extruded positions are examined by EBSD and the average grain size is
274
calculated. Fig. 13 shows that the evolutions of grain size and morphology on flow lines A, B and C.
275
The position (i.e., deformation history) shows a significant effect on the microstructure evolution.
276
From position of A3 to A4 in line A, a dramatic increase in the long axis of grains is observed.
277
The reason is the severe shear, which is caused by the strong friction between the material and the
278
die, makes grains severely stretched. Grain are further stretched and refined repeatedly from position
279
A4 to A5, which results in a fluctuation of grain size. The rotation of shear plane makes grain further
280
refined from position A5 to A6. Short axis of grain reaches saturated value because of the nearly
281
uniform deformation. The aspect ratio shares a similar law with long axis, where dramatic fluctuation
282
is also obtained from position A4 to A7.
283
Grain size and morphology development on flow line B is different from flow line A. Grain
284
morphology has not changed much in steady state deformation zone. At stage of severe plastic
285
deformation (B4 to B5), grain refinement doesn’t occur because the gradient of the deformation across
286
thickness is relatively low.
287
For the flow line C, grain size and morphology keep basically the same in steady state
288
deformation zone and only shows slight increasing. Grain size decrease dramatically before reaching
289
position C6, where a relatively large shear deformation makes significant grain refinement.
290
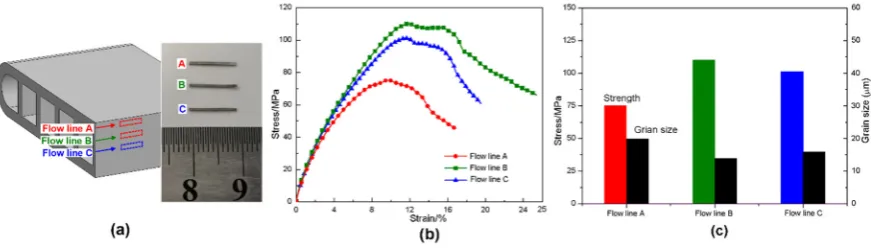
4.5 Mechanical Property Across the Thickness of MCT
The specimens were prepared at different regions with respect to the three flow lines in the
292
longitude section of the MCT tube, with the dimension of 0.2mm*0.2mmm*10mm (Fig. 14(a)). The
293
measured results are compared in Fig.14(b), where the specimen at flow line B has the highest stress
294
strain curve, the one at flow line A has the lowest, while the one at flow line C is in between. These
295
different mechanical behaviors are associated with both the developed textures and grain
296
morphology shown in Figs. 10-13. Fig.14(c) plots the ultimate strength together with the average
297
grain size, where specimen with finer grains exhibits higher ultimate strength. This finding agrees
298
well with Hall-Petch effect of the grain size strengthening.
299
300
Figure 14. Tensile tests on specimens at different flow lines: (a) sampling position; (b) Engineering
301
stress-strain curves; and (c) ultimate strength.
302
In summary, by analysis of grain size and morphology development on different flow line, it is
303
found that the position of grain refinement and degree of grain morphology evolution have a close
304
relationship with the rotation of shear plane. The way of shear change decides the position where
305
grain is stretched and refined. All these evolutions are well captured by current model.
306
5. Conclusions
307
In the current work, the VPSC model with grain refinement is employed, based on the
308
calculated strain rates from the flow line model, to examine the evolution and distribution of texture
309
and grain size within the extrusion die. Results of the simulation agree well with EBSD observations.
310
The influence of flow lines on the evolution of texture and grain morphology is discussed. Based on
311
both the experimental and numerical results, the following conclusions can be drawn:
312
(1) Large deformation is occurred under extrusion with a porthole die. Both the velocity and
313
effective strain fields reveal that the base material undergoes very heterogenous and severe
314
deformation.
315
(2) The FE simulation can accurately reproduce the flow line of the material within the porthole die.
316
The velocity gradient within the die can be obtained by the flow line model. In conjunction with
317
the crystal plasticity model of VPSC, the evolution of the microstructure can be well reproduced.
318
(3) The rotation of shear plane causes the texture change during material flow. The different
319
rotation of shear plane attributes to the difference of texture evolution law on three flow lines.
320
Because of mold structure and change of friction condition, the rotation of shear plane in
321
deformation process performs alternation of clockwise and counterclockwise on flow line A and
322
C. For flow line B, in dramatic plastic deformation zone, the shear plane keeps clockwise rotation,
323
except counterclockwise rotation at the exit of mold.
324
(4) There is a close relationship between grain refinement and shear effect. The grain refinement
325
characteristics vary with different shear effect of aluminum on different flow line.
326
Polycrystalline plasticity model predicts the trend of grain size and morphology development
327
on different flow line, especially the process that grain is stretched and, to a certain extent,
328
refined under severe deformation.
329
(5) Because of the different microstructure developed, aluminum alloys in the produced tube
330
exhibit different mechanical behaviors across the thickness from location to location. Good
331
generally shows higher strength.
333
334
Author Contributions: D.T., H.W., D.L., Y.P. and P.W. conceived this study. W.F., T.Z. and Z.L. performed the
335
simulations. X.F. performed the experiments. D.T. and H.W. prepared the first version of this manuscript. All
336
authors participated the discussion and revision of this manuscript.
337
Funding: This research was funded by National Natural Science Foundation of China (No.: 51575346), Shanghai
338
Pujiang Program (18PJ1405000) and the Foundation of State Ley Laboratory of Solidification Processing
339
(SKLSP201810).
340
Conflicts of Interest: The authors declare no conflict of interest.
341
References
342
1. D. Tang, X. Fan, W. Fang, D. Li, Y. Peng, H. Wang, Microstructure and mechanical properties development
343
of micro channel tubes in extrusion, rolling and brazing, Materials Characterization 142(2018) 449-457
344
2. R.D. Doherty, D.A. Hughes, F.J. Humphreys, J.J. Jonas, D.J. Jensen, M.E. Kassner, W.E.Kingg,
345
T.R.McNelleyh, H.J.McQueeni, A.D.Rollettj Current issues in recrystallization: a review, Mater. Sci. Eng. A
346
238 (1997) 219-274.
347
3. S. Gourdet, F. Montheillet, An experimental study of the recrystallization mechanism during hot
348
deformation of aluminium, Mater. Sci. Eng. A 283 (2000) 274-288.
349
4. M.R. Barnett, F. Montheillet, The gerneration of new high-angle boundaries in aluminum during hot
350
torsion, Acta Mater. 50 (2002) 2285-2296.
351
5. H.J. McQueeni, Development of dynamic recrystallization theory, Mater. Sci. Eng. A 387-389 (2004)
203-352
208.
353
6. S. Gourdet, F. Montheillet, A model of continuous dynamic recrystallization, Acta Mater. 51 (2003)
2685-354
2699.
355
7. F. Gagliardi, T. Citrea, G. Ambrogio, L.Filice, Influence of the process setup on the microstructure and
356
mechanical properties evolution in porthole die extrusion. Mater. Des. 60(2014), 274-281.
357
8. X. Fan, D. Tang, W. Fang, D. Li, Y. Peng, Microstructure development and texture evolution of aluminum
358
multi-port extrusion tube during the porthole die extrusion, Materials Characterization 118(2016)468-480
359
9. A. Molinari, G.R. Canova, S. Ahzi, A self-consistent approach of the large deformation polycrystal
360
viscoplasticity. Acta Metall. 35(1987), 2983-2994.
361
10. R.A. Lebensohn, C.N. Tomé, A self-consistent anisotropic approach for the simulation of plastic
362
deformation and texture development of polycrystals: application to zirconium alloys, Acta Metallurgica
363
et Materialia 41 (1993), 2611-2624.
364
11. H. Wang, P.D. Wu, C.N. Tomé, Y. Huang, A finite strain elastic–viscoplastic self-consistent model for
365
polycrystalline materials, Journal of the Mechanics and Physics of Solids 58 (2010), 594-612;
366
12. H. Wang, P.D. Wu, C.N. Tomé, J. Wang, A constitutive model of twinning and detwinning for hexagonal
367
close packed polycrystals, Materials Science and Engineering A 555(2012), 93-98
368
13. H. Wang, P.D. Wu, J. Wang, C.N. Tomé, A crystal plasticity model for hexagonal close packed (HCP)
369
crystals including twinning and de-twinning mechanisms, International Journal of Plasticity 49(2013)
36-370
52;
371
14. H. Wang, L. Capolungo, B. Clausen, C.N. Tomé, A crystal plasticity model based on transition state theory,
372
International Journal of Plasticity 93(2017) 251-268
373
15. H. Wang, P.D. Wu, S. Kurukuri, M.J. Worswick, Y.H. Peng, D. Tang, D.Y. Li, 2018. Strain rate sensitivities
374
of deformation mechanisms in magnesium alloys. International Journal of Plasticity 107, 207-222.
375
16. T. Mayama, M. Noda, R. Chiba, M. Kuroda, Crystal plasticity analysis of texture development in
376
magnesium alloy during extrusion, International Journal of Plasticity 27 (2011) 1916-1935
377
17. S. Gall, S. Müller, W. Reimers, Microstructure and mechanical properties of magnesium AZ31 sheets
378
produced by extrusion, International Journal of Material Forming 6 (2013) 187-197
379
18. R. Arruffat-Massion, L.S. Tóth, J.P. Mathieu, Modeling of deformation and texture development of copper
380
in a 120° ECAE die, Scripta Materialia, 54(2012) 1667-1672.
381
19. I. Flitta, T. Sheppard, Nature of friction in extrusion process and its effect on material flow, Materials
382
20. J. Zhou, L. Li, J. Duszczyk, 3D FEM simulation of the whole cycle of aluminium extrusion throughout the
384
transient state and the steady state using the updated Lagrangian approach, Journal of Materials Processing
385
Technology 134 (2003) 383-397.
386
21. M. Knezevic, R.J. Mccabe, R.A. Lebensohn, et al., Integration of self-consistent polycrystal plasticity with
387
dislocation density based hardening laws within an implicit finite element framework: Application to
low-388
symmetry metals, Journal of the Mechanics & Physics of Solids 61(2013) 2034-2046.
389
22. D.Tang, Q. Zhang, D. Li, et al., A physical simulation of longitudinal seam welding in microchannel tube
390
extrusion. Journal of Materials Processing Technology 2014, 214: 2777-2783
391
23. L.S.Tóth, Modelling of strain hardening and microstructural evolution in equal channel angular extrusion.
392
Computational Materials Science, 32(2005) 568-576.
393
24. J.D. Eshelby, The determination of the elastic field of an ellipsoidal inclusion, and related problems. Proc.