Abstract
Clustering analysis is used to explore the classification for large dataset and Canberra distance is generalized so that it can process the data with categorical attributes. Based on the generalized Canberra distance definition, an instance of constraint-based clustering is introduced. Meanwhile, the nearest neighbor classification is improved. Class-labeled clusters are regarded as classifying models used for classifying data. The proposed classification method can discover the data of big difference from the instances in training data, which may mean a new data type. The generalize Canberra distance for continuous numerical attributes data to mixed attributes data, and use clustering analysis technique to squash existing instances, improve the classical nearest neighbor classification method.
Index Terms—Clustering; Canberra Distance; Classification; Nearest Neighbor Classification
1. EXISTING SYSTEM
Classification is a form of data analysis that can be used to extract models describing important data classes. For example, a classification model may be built to categorize bank loan applications as either safe or risky. Many classification methods have been proposed by researchers in machine, expert systems, statistics, and neurobiology. These methods include decision tree induction, Bayesian classification and Bayesian belief networks, neural networks, k-nearest neighbor classification, and instance-based reasoning. Differences in terms of performance among many classification methods have been compared in literatures. Traditional nearest neighbor classifications are instanced-based learning or lazy learning in that they store all of the training samples and do not build a classifier until a new sample needs to be classified as in Fig 1. The key idea of nearest neighbor classifier is
International Journal of Computer Science and Mobile Computing
A Monthly Journal of Computer Science and Information Technology
ISSN 2320–088X
IJCSMC, Vol. 3, Issue. 1, January 2014, pg.319 – 324
RESEARCH ARTICLE
EFFICIENT CLASSIFICATION METHOD
FOR LARGE DATASET BY ASSIGNING
THE KEY VALUE IN CLUSTERING
Dr. B Rosiline Jeetha
Associate Professor, Department of MCA,
1.1. DISADVANTAGES
1. Time complexity is too high and scalability is poor. The efficiency of time isn’t satisfactory for large dataset.
2. Some methods can only deal with categorical attributes and other can only deal with numerical attributes. However, in practical data often feature with mixed attributes, thus sometimes the type of some attributes need to be transformed.
3. In some fields, data may exist evolving phenomena, may appear new type with time, for example, in the field of intrusion detection, type of attack may increase by degrees.
Fig: 1 Nearest Nieghbor Classification
2. PROPOSED SYSTEM
Clustering is a process of partitioning data into groups of similar objects, and an unsupervised learning process of hidden data. The goal of clustering is that the intra-cluster
Similarity is maximized while the inter-cluster similarity is minimized. A new classification method, which is composed of two stages: training model and detecting model. We set up model by constraint-based clustering algorithm and classify data by INN (Improved Nearest Neighbor) method.
3. MODULES 3.1.CANBERRA DISTANCE
Distance (similarity) measure is the basis of clustering analysis, and will influence the quality of clustering. Canberra distance for numerical attributes data has two good characteristics, it isn’t infected by measurement unit and it is robust to missing data. suppose that dataset D is featured by m attributes ( C m categorical and N m continuous) where i D is the i-th attribute. For the sake of simplicity, set categorical attributes before continuous attributes. To reduce the infection of varied measurement units, it is necessary to standardize numerical attributes.
3.2.TRAINING MODEL
The training model presents a constraint-based clustering algorithm and usethe least distance principle to divide dataset into hyper spheres with almost the same radius, each hyper sphere consists of only one type objects, finally, the clusters with class-labeled are regarded as classification models.
Classification
Select the Data Set: C:\Data
Set\WBC.txt
No. of Cluster : 5
Mean Value : 25.4
MEAN VALUE
3.3.DETECTING MODEL
We improve the nearest neighbor classification method and classify data according to the same idea of training model, obtain an improved nearest neighbor (INN) method. INN considers not only the candidate classified object and its nearest neighbor in model, but also the size of distance between them.
3.4.TIME COMPLEXITY
Training model processing, the clustering algorithm scans training dataset one pass. The time complexity of the clustering, the first step of setting up model, depend on the size of training set (N1), the number of attributes (m), the number of the CSIs and the size of every CSI. To simplify the analysis, we assume the final number of the clusters is k, categorical attribute i D possess of distinct values i n. In the worst case, we can get that the clustering algorithm has time complexity
4. EXPERIMENTAL RESULT
A comprehensive performance study is conducted to evaluate our algorithm. We test our algorithm on some real-life datasets (Wisconsin Breast Cancer dataset, Thyroid-Gland dataset, KDDCUP99 dataset) obtained from the UCI Machine Learning Repository, and demonstrate the effectiveness of our method against other algorithms. In this paper, we use detection rate (DR) to measure performance of classification method. The detection rate is defined as the ratio of the right classified records to the total records.
4.1. MEDICAL DIAGNOSIS DATASETS
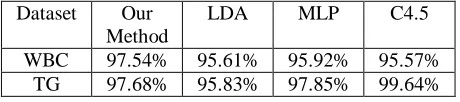
We choose 2 medical diagnosis datasets: Wisconsin Breast Cancer and Thyroid-Gland, and use holdout method to evaluate classifier accuracy. The Wisconsin Breast Cancer (WBC) dataset has 699 records with 9 numerical attributes. Each record is labeled as benign (458 records) or malignant (241 records). We randomly partition WBC into two independent sets, a training set (contain 60% records) and a testing set. The Thyroid-Gland (TG) dataset is the UCI ann-train dataset contributed by R.Werner. The problem is to determine whether or not a patient is hyperthyroid. There are three classes (normal, hyper function, and subnormal functioning), six numerical attributes, and fifteen binary attributes. The training set consists of 3772 records and the test set has 3428 records. The error rates are estimated from the test set. Table 1 shows the performance comparison among our method and LDA algorithm, MLP algorithm, C4.5 algorithm in terms of average detection rate. From the experimental results, we can see that our method outperforms the three algorithms on Wisconsin Breast Cancer dataset and is not as good as MLP algorithm and C4.5 algorithm on Thyroid-Gland dataset.
Table 1. The contrast results for different classification algorithm
Dataset Our
Method
LDA MLP C4.5
WBC 97.54% 95.61% 95.92% 95.57%
TG 97.68% 95.83% 97.85% 99.64%
The experimental results on dataset KDDCUP99 show that our method can detect the unknown types which don’t exist in training dataset, this special property is important to discover new behavior type for detecting new attack.
Fig: 2 Clustering Results
4.2. KDDCUP99DATASET
KDDCUP99 dataset contains around 4,900,000 simulated network records with 41 attributes (34 continuous attributes and 7 categorical attributes). These records fell in normal or one of the following four categories attack: DOS, R2L, U2R, and PROBE. It seems that the whole dataset is too large. However, generally, only 10% subset is used to evaluate the algorithm performance. We randomly divide the 10% subset into ten subsets P1~P10 and use 10-fold cross-validation to estimate classifier accuracy. The experimental results show that in terms of detection rate our method is superior to Elkan’s method for attack and is little inferior to Elkan’s method for normal. The average time for training model and detecting model are respectively 1590 seconds and 320 seconds, our classification method is effective for large dataset.
5. CONCLUSION
In this paper, we investigate the issue of classifying large dataset. First we generalize Canberra distance to mixed attributes data and present a constrained clustering algorithm.
Fig: 3 Classification Results
Clustering is a process of partitioning data into groups of similar objects, and an unsupervised learning process of hidden data. The goal of clustering is that the intra-cluster
Similarity is maximized while the inter-cluster similarity is minimized. A new classification method, which is composed of two stages: training model and detecting model. We set up model by constraint-based clustering algorithm and classify data by INN (Improved Nearest Neighbor) method as given in Fig 2 and Fig 3.
The experimental results demonstrate that our method is promising. By assuming the final number of clusters is k, the number of clusters is formed based on the k value so that the data may appear and store in the defined number of classes.
ACKNOWLEDGEMENT
First, I would like to thank Almighty for His blessings towards the successful completion of this survey paper. I would like to extend my thanks to my Research Guide Dr. (Mrs.) M. Punithavalli, Dean, Dept. of Computer Science, Sri Rama Krishna College for Women, Coimbatore for her valuable assistance, help and guidance during the research process. I also would like to extend my heartfelt gratitude to my Beloved Husband Mr. M. S. RajaSekaran for his moral support and co-operation.
REFERENCES
[1] Guido Bologna. A Study on Rule Extraction from Neural Networks Applied to Medical Databases. The 4th European Conference on Principles and Practice of Knowledge Discovery (PKDD2000), Lyon, France, Sept 2000.
[2] Schiffmann W, Joost M, Werner R. Optimization of the Backpropagation Algorithm for Training Multilayer Perceptrons. Technical report (1994). University Koblenz, Institute of Physics.
[5] Leake D B. CBR in context: The present and future. In Leake D B, editor, Cased-Based Reasoning: Experience, Lessons, and Future Direction. Menlo Park: AAAI Press, 1996:3-30.
[6] Shengyi Jiang, Xiaoyu Song, etc. A clustering-based method for unsupervised intrusion detections. Pattern Recognition Letters. 2006 (27):802-810
[7] Charles Elkan. Results of the KDD'99 Classifier Learning Contest. URL:
http://www.cs.ucsd.edu/users/elkan/clresults.html.
[8] S.T. Teoh and K. Ma, “PaintingClass: interactive construction, visualization and exploration of decision trees,” Proceedings of the ninth ACM SIGKDD international conference on Knowledge discovery and data mining, Washington, D.C.: ACM, 2003, pp. 667-672.
[9] M. Ankerst, C. Elsen, M. Ester, and H. Kriegel, “Visual classification: an interactive approach to decision tree construction,” Proceedings of the fifth ACM SIGKDD international conference on Knowledge discovery and data mining, ACM, 1999, pp. 392-396.
[10] Q. Cui and J. Yang, “Measuring Data Abstraction Quality in Multiresolution Visualizations,” IEEE Transactions on Visualization and Computer Graphics, vol. 12, 2006, pp. 709-716.
[11] D. Yang, Z. Xie, E.A. Rundensteiner, and M.O. Ward, “Managing discoveries in the visual analytics process,” SIGKDD Explor. Newsl., vol. 9, 2007, pp. 22-29.
[12] G. Ellis and A. Dix, “Density control through random sampling: an architectural perspective,” Information Visualisation, IV 2002., 2002, pp. 82–90.
[13] E. Bertini and G. Santucci, “Give chance a chance: modeling density to enhance scatter plot quality through random data sampling,” Information Visualization, vol. 5, 2006, pp. 95–110.
[14] R.A. Amar, “Knowledge Precepts for Design and Evaluation of Information Visualizations,” IEEE Transactions on Visualization and Computer Graphics, vol. 11, 2005, pp. 432-442.