Cancer Management and Research 2018:10 2871–2881
Cancer Management and Research
Dove
press
submit your manuscript | www.dovepress.com 2871
O R I G I N A L R E S E A R C H
open access to scientific and medical research
Open Access Full Text Article
Differences in clinical characteristics and
mutational pattern between synchronous and
metachronous colorectal liver metastases
Peng Zheng* Li Ren*
Qingyang Feng* Dexiang Zhu* Wenju Chang Guodong He Meiling Ji Mi Jian Qi Lin Tuo Yi Ye Wei Jianmin Xu
Department of General Surgery, Zhongshan Hospital, Fudan University, Shanghai, People’s Republic of China *These authors contributed equally to this work
Purpose: To investigate differences in clinical characteristics and mutational patterns between synchronous and metachronous colorectal liver metastases (CLMs).
Patients and methods: From June 2008 to December 2014, patients with RAS wild-type CLMs treated at Zhongshan Hospital, Fudan University were included. DNA extracted from formalin-fixed paraffin-embedded tissue of primary tumors was sequenced with next-generation sequencing for single-nucleotide polymorphism of 96 genes according to custom panel. Muta-tions were compared between synchronous and metachronous liver metastases and correlated with clinical characteristics.
Results: A total of 161 patients were included: 93 patients with synchronous CLM and 68
patients with metachronous CLM. Patients with metachronous CLM were obviously elder. For pathology of primary tumors, synchronous CLMs were larger in size, poorly differentiated, and more frequently local advanced and lymph node positive. For evaluation of liver metastases, synchronous CLM had more and larger metastatic lesions. The median number of mutations in synchronous CLMs was significantly higher than in metachronous group (22 vs. 18, p<0.001). EGFR rs2227983 is the most prevalent mutation in both groups and only a part of prevalent mutations is shared in both groups. Prevalent mutations were correlated with many clinical characteristics. EGFR rs2227983, RBMXL3 rs12399211, and PTCH1 rs357564 were prognostic for latency of metachronous CLM.
Conclusion: Clinically, synchronous CLMs, compared with metachronous CLMs, were younger and showed heavier tumor burden for both primaries and liver metastases. Genetically, we identi-fied different mutational patterns between synchronous and metachronous CLMs and several correlations between mutations and clinical characteristics. Further researches were needed to confirm these potential key mutations of CLMs.
Keywords: colorectal liver metastases, next-generation sequencing, metachronous, synchronous
Introduction
Colorectal cancer (CRC) is the most common malignancy throughout the world,1 and
liver metastases are the major cause of death in CRC patients. Unfortunately, 40%–50% of CRC patients would develop colorectal liver metastases (CLMs). They are either synchronous or metachronous in presentation with approximately equal incidence.2,3
Compared with synchronous metastases, patients with metachronous metastases show differences in terms of clinicopathologic characteristics and better prognosis after metastases resections.4–6 However, in previous studies, synchronous and metachronous
liver metastases were usually lumped together, neglecting their clinical and biologic
Correspondence: Jianmin Xu Department of General Surgery, Zhongshan Hospital, Fudan University, 180 Fenglin Road, Shanghai 200032, People’s Republic of China Tel +86 021 6404 1990 ext 3449 Email [email protected]
Journal name: Cancer Management and Research Article Designation: ORIGINAL RESEARCH Year: 2018
Volume: 10
Running head verso: Zheng et al
Running head recto: Comparison of synchronous and metachronous colorectal liver metastases DOI: http://dx.doi.org/10.2147/CMAR.S161392
Cancer Management and Research downloaded from https://www.dovepress.com/ by 118.70.13.36 on 20-Aug-2020
For personal use only.
Dovepress
Zheng et al
differences. It is critical to improve our understanding of the biology of liver metastases, which may help to develop more effective therapeutic strategies.
Biologic differences between synchronous and metachro-nous CLMs had been studied previously but showed conflict-ing results.2,7–11 Available evidence indicated that majority of
gene alterations in the primary tumor were maintained in the CLMs, whereas a limited number of studies compared the primary tumors of synchronous and metachronous groups and generally demonstrated no differences in biomarker expression. In consideration of limited number of studies and limited number of biomarkers investigated, it is still not reasonable to deny the hypothesis that the biology of synchro-nous and metachrosynchro-nous CLMs would be different in view of the known clinicopathologic differences that exist between them. Thus, more comprehensive researches are needed. The use of next-generation sequencing (NGS) for high-throughput genomic analysis has accelerated our understanding of the molecular characteristics of CRC12–14 and may also serve us
an insight on this topic.
Therefore, we conducted NGS of primary tumors of synchronous or metachronous CLM to investigate mutational patterns between them. We also expected to find prognostic or predictive biomarkers among mutations sequenced.
Patients and methods
Study population
This study retrospectively included patients with CRC treated at General Surgery Department of Zhongshan Hospital, Fudan University (Shanghai, China) during June 2008 to December 2014. The inclusion criteria were as fol-lows: colorectal adenocarcinoma determined by pathologic evidence; wild-type RAS; liver metastases determined by radiologic and/or pathologic evidence; radical resections of primary tumors; enough formalin-fixed paraffin-embedded (FFPE) tissue of primary tumors; no exposure to any treat-ment (chemotherapy, targeted therapy, radiotherapy, or interventional therapy) before primary tumor resections. Patients with liver metastases accompanied with other distant metastases were permitted. Adjuvant chemotherapy after primary tumor resection was permitted. Target therapy and interventional therapy were permitted only after the occurrence of liver metastases. All patients provided writ-ten and oral informed consent. This study was approved by the ethics committee of Zhongshan Hospital, Fudan University.
Two groups were established in this study: the synchro-nous-metastases group and the metachrosynchro-nous-metastases
group. The synchronous-metastases group consisted of patients with liver metastases diagnosed together with or within a 6-month interval of the diagnosis of the primary colorectal tumor. The metachronous-metastases group con-sisted of patients with liver metastases diagnosed >6 months after primary tumor resection. This study was approved by the local ethics committees and all patients provided written and oral informed consent, including research on tumor tissue.
In addition, 10 patients were selected for whole-exome sequencing (WES). All 10 patients were diagnosed with CLM and underwent resection of both primary and metastatic tumors. Exclusion criteria included previous exposure to any treatment for metastatic CRC, family history of CRC, and evidence of a mismatch repair deficiency.
Study procedure
To investigate mutational pattern of different liver metastases, we examined biomarkers (single-nucleotide polymorphism, SNP) through genome-wide exploration using NGS. To pre-liminarily select genes to construct a custom panel for target capture sequencing, we performed WES for 10 triplets, each comprising primary colorectal tumor and normal colorectal mucosa and matched liver metastases. Genomic DNA from fresh tissue was samples sequenced on an Ion™ Proton (Life Technologies, Carlsbad, CA, USA) platform according to the manufacturer’s instructions. Normal colorectal mucosa was sequenced to exclude germline variants. The read align-ments and variant analyses were performed according to the predefined workflow.
We constructed a custom panel of 96 genes selected based on driver mutations identified using WES and Tumor Muta-tion Hotspots Panel version 2 (Life Technologies, Carlsbad, CA, USA). Genomic DNA from FFPE tissue samples of patients in both cohorts was subsequently sequenced for SNPs using an Ion™ Torrent Personal Genome Machine (PGM) according to the manufacturer’s instructions. For a given gene loci, the fraction of mutant alleles was calculated by diving the number of mutant reads by the number of total reads. A 5% cutoff value was employed. A sample was con-sidered wild-type for a given gene when all sequenced loci harbored <5% mutant alleles.
Whole-exome sequencing
DNA was extracted from fresh tumor samples using the MELT™ Total Nucleic Acid Isolation Kit (Life Technolo-gies). Quantity and quality were assessed using Qubit 2.0 (Life Technologies). Fifty to hundred nanograms of DNA
Cancer Management and Research downloaded from https://www.dovepress.com/ by 118.70.13.36 on 20-Aug-2020
Dovepress Comparison of synchronous and metachronous colorectal liver metastases
for each sample was used for exome capture and library preparation with Ion AmpliSeq™ Exome Kit 4xDuo (Life Technologies) following the manufacturer’s instructions. Then libraries were bar-coded with Ion Xpress™ Barcode Adapters Kit (Life Technologies). The concentration of each library was determined by PCR with the Ion Library™ Quantization Kit (Life Technologies). According to the manufacturer’s instructions, all libraries were diluted to 100 pM working solutions and then pooled as needed to perform the template preparation with Ion PI™ Template OT2 200 kit v2 (Life Technologies) on Ion One Touch™ 2 System. Qual-ity and quantQual-ity were determined with Qubit Ion Sphere™ Quality Control Kit (Life Technologies) for the obtained ion sphere particles. WES was performed on Ion Proton™ platform, using the Ion PI™ Sequencing 200 kit v2 and Ion PI™ Chip kit v2. Sequencing data were analyzed with the Torrent Suite™ Software v4.0 (Life Technologies) using default parameters setting.
Processing of WES data
The primary WES data were analyzed for single-nucleotide variants (SNVs) following the procedures indicated below.
1. Variants with SNV quality (QUAL) ≤20 were excluded. QUAL was calculated using Torrent Suite™ software. 2. Variants of normal mucosa were considered background
variants. Primary or metastatic tumor samples were fil-tered using background variants, and the variants were rejected as germline variants or sequencing artifacts when present in the corresponding normal samples.
3. Primary or metastatic tumor-specific SNVs were analyzed using the SeattleSeq SNP Annotation.15 Known germline
mutations from the Exome Sequencing Project16 and
dbSNP databases (build 140)17 were also excluded. We
selected nonsilent mutations, including missense muta-tions and InDels.
4. Nonsilent mutations were predicted to affect gene func-tion when any of the following criteria were fulfilled: 1) functional impact score of SIFT18≤0.05;19 2) functional
impact score of PolyPhen-220 >0.45;21 3) functional
impact label of Mutation Assessor22 was “medium” or
“high”;23 4) Condel24 label was “deleterious”;25 and 5)
functional impact score of FATHMM26<0.27
5. The transFIC analysis was performed as previously described.28 Mutations were considered cancer driver
mutations when the outcome of the transFIC analysis was of “high impact”.
Construction of custom panel
To prepare for target capture sequencing, we constructed a custom panel based on WES data and Tumor Mutation Hotspots Panel version 2. When selecting genes from WES data, genes that were essential for cancer progression, particu-larly liver metastasis, were considered with priority. On one hand, we searched all mutations in the GeneRIF database29
using key words “cancer/tumor/carcinoma” and “metasta-/ invasion/invade/invasive/migrate”. On the other hand, we focused on mutations of universal genes in primary tumors and corresponding liver metastases. In addition, most genes in the Tumor Mutation Hotspots Panel version 2 were included. The mutation information for these genes was acquired from the Catalog of Somatic Mutations in Cancer (COSMIC) database,30 and we employed the most frequent mutations
to build the panel.
Target capture sequencing
DNA was extracted from FFPE tumor samples using the RecoverAll™ Total Nucleic Acid Isolation Kit (Life Tech-nologies) according to the manufacturer’s instructions. Quantity and quality were assessed using Qubit 2.0 (Life Technologies). Ten nanograms of DNA for each sample was used for library construction and template preparation with same procedures described above in the “Whole-exome sequencing” section. Target capture sequencing was carried out with customized panel using the Ion PGM™ platform (Life Technologies) according to the manufacturer’s instruc-tions. The panel consisted of two separate PCR primer pools covering recurrent mutations in 96 genes with 1500X sequence coverage on Ion™ 318 chip. Sequencing data were analyzed with Ion Reporter™ software v4.4 (Life Technolo-gies) using default parameters setting.
Statistical analysis
The statistical analysis plan was established before the genotyping results were available. Differences in categori-cal parameters were categori-calculated using a chi-square test or Fisher’s exact test. Survival curves were generated using the Kaplan–Meier method and compared using a log-rank test. Hazard ratios and 95% CIs were calculated using the Cox proportional hazards model. For univariate and multivariate analyses of latency of metachronous liver metastases, the Cox proportional hazards model was used. All statistical analyses were conducted using the statistical software SPSS version 18.0 (SPSS Inc., Chicago, IL, USA). A p-value <0.05 was considered statistically significant.
Cancer Management and Research downloaded from https://www.dovepress.com/ by 118.70.13.36 on 20-Aug-2020
Dovepress
Zheng et al
Results
Patients and clinical characteristics
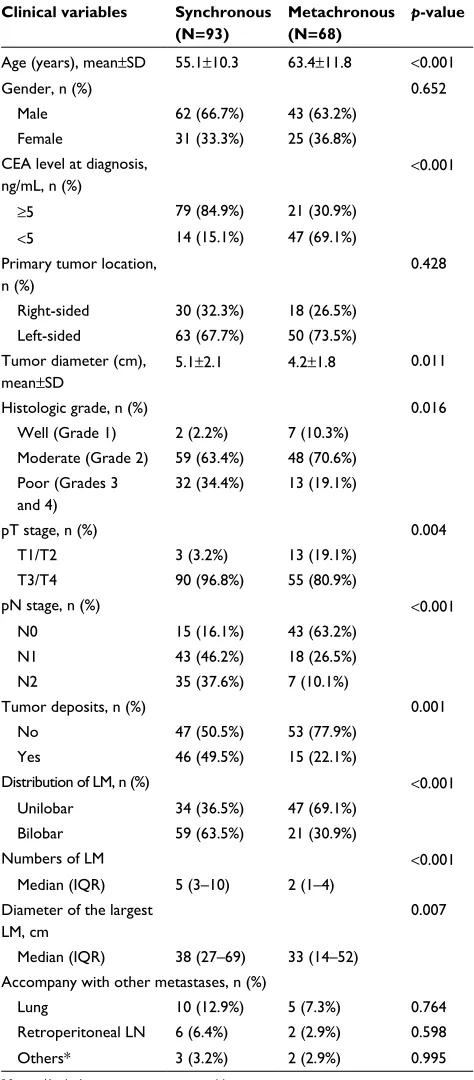
A total of 161 patients were included and sequenced. According to the metastatic type, 93 patients were in synchronous-metastases group and 68 patients in meta-chronous-metastases group. Several differences in clinical characteristics were observed between groups (Table 1). Patients with metachronous CLMs were obviously elder. With regard to pathology of primary tumors, synchronous CLMs were larger in size, poorly differentiated, and more frequently local advanced and lymph node positive. As to evaluation of liver metastases, synchronous CLMs result in more and larger metastatic lesions.
Summary of WES and target capture
sequence
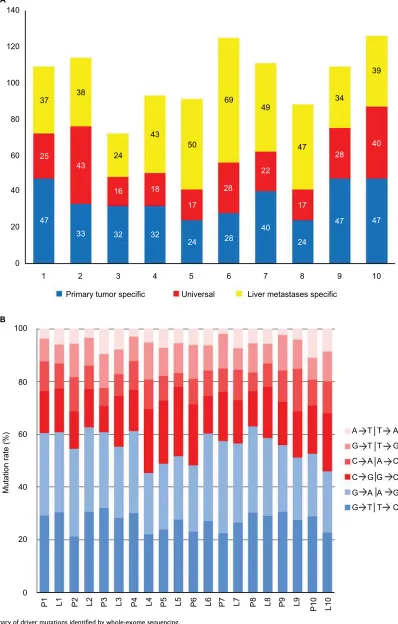
Ten triplets were sequenced with WES for preliminarily data to construct custom panel. Overall, we identified 608 potential somatic driver mutations in 511 genes in primary colorectal tumors and 694 potential somatic driver mutations in 638 genes in liver metastases. The number of somatic mutations in 10 primary colorectal tumor ranged from 41 to 87, with a mean of 60 (Figure 1A), which was not signifi-cantly different from that of the non-hypermutated CRCs reported in The Cancer Genome Atlas.31 When comparing
mutations between tumors, 230 mutations in 219 genes were universal in the primary tumor and corresponding liver metastases. In addition, mutations observed in 10 patients were predominated by the C/G>T/A transition (Figure 1B) consistent with the results of previous CRC genomics studies.31,32
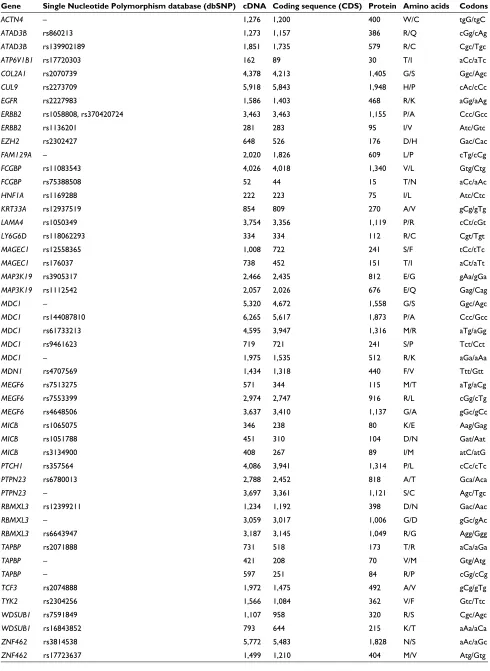
According to the custom panel, 161 patients were sequenced with target capture sequence for recurrent muta-tions of 96 genes. Mutamuta-tions with mutational frequencies
>10% and <90% were further investigated for stability. Finally, 48 mutations in 27 genes were included in following analysis (Table 2). Among these mutations, 40 were already documented in dbSNP databases (build 140).
Correlation between clinical
characteristics and mutations
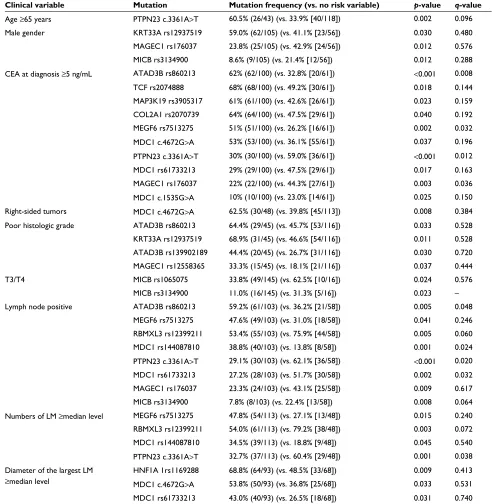
Univariate analysis identified that 18 mutations in 12 genes were correlated with clinical variables (Table 3). MDC1 was associated with the most number of clinical variables, including T stage, N stage, tumor location of primary, and size and number of liver metastases. Mutations of ATAD3B, MAGEC1, and MICB were only associated with pathologic
Table 1 Clinical characteristics of synchronous and metachronous groups
Clinical variables Synchronous (N=93)
Metachronous (N=68)
p-value
Age (years), mean±SD 55.1±10.3 63.4±11.8 <0.001
Gender, n (%) 0.652
Male 62 (66.7%) 43 (63.2%)
Female 31 (33.3%) 25 (36.8%)
CEA level at diagnosis, ng/mL, n (%)
<0.001
≥5 79 (84.9%) 21 (30.9%)
<5 14 (15.1%) 47 (69.1%)
Primary tumor location, n (%)
0.428 Right-sided 30 (32.3%) 18 (26.5%)
Left-sided 63 (67.7%) 50 (73.5%) Tumor diameter (cm),
mean±SD
5.1±2.1 4.2±1.8 0.011
Histologic grade, n (%) 0.016
Well (Grade 1) 2 (2.2%) 7 (10.3%) Moderate (Grade 2) 59 (63.4%) 48 (70.6%) Poor (Grades 3
and 4)
32 (34.4%) 13 (19.1%)
pT stage, n (%) 0.004
T1/T2 3 (3.2%) 13 (19.1%)
T3/T4 90 (96.8%) 55 (80.9%)
pN stage, n (%) <0.001
N0 15 (16.1%) 43 (63.2%)
N1 43 (46.2%) 18 (26.5%)
N2 35 (37.6%) 7 (10.1%)
Tumor deposits, n (%) 0.001
No 47 (50.5%) 53 (77.9%)
Yes 46 (49.5%) 15 (22.1%)
Distribution of LM, n (%) <0.001
Unilobar 34 (36.5%) 47 (69.1%)
Bilobar 59 (63.5%) 21 (30.9%)
Numbers of LM <0.001
Median (IQR) 5 (3–10) 2 (1–4) Diameter of the largest
LM, cm
0.007 Median (IQR) 38 (27–69) 33 (14–52)
Accompany with other metastases, n (%)
Lung 10 (12.9%) 5 (7.3%) 0.764
Retroperitoneal LN 6 (6.4%) 2 (2.9%) 0.598
Others* 3 (3.2%) 2 (2.9%) 0.995
Note: *Includes omentum, ovary, and brain.
Abbreviations: CEA, carcinoembryonic antigen; IQR, interquartile range; LM, liver metastases; LN, lymph node.
variables of primary tumor. Most of the mutations associated with variables of liver metastases were also associated with lymph node metastases. Ten correlations with preoperative
Cancer Management and Research downloaded from https://www.dovepress.com/ by 118.70.13.36 on 20-Aug-2020
Dovepress Comparison of synchronous and metachronous colorectal liver metastases
140
A
B
120
37
25
47
33 43
16
32
24
43
18
32
24 17
50
69
49
22
28
40
24 17
47
34
39
40
47 28
47 28
38 100
80
60
40
20
0
1 2
Primary tumor specific Universal Liver metastases specific
3 4 5 6 7 8 9 10
100
80
60
40
Mutation rate (%
)
20
0
P1 L1 P2 L2 P3 L3 P4 L4 P5 L5 P6 L6 P7 L7 P8 L8 P9 L9 P10 L10
A T T A
G T T G
C A A C
C G G C
G A A G
G T T C
Figure 1 Summary of driver mutations identified by whole-exome sequencing.
Notes: (A) Distribution of driver mutations in primary tumor and liver metastases. (B) Distribution of transitions and transversions.
Abbreviations: L, liver metastases; P, primary tumor.
Cancer Management and Research downloaded from https://www.dovepress.com/ by 118.70.13.36 on 20-Aug-2020
Dovepress
Zheng et al
Table 2 List of mutations analyzed
Gene Single Nucleotide Polymorphism database (dbSNP) cDNA Coding sequence (CDS) Protein Amino acids Codons
ACTN4 – 1,276 1,200 400 W/C tgG/tgC
ATAD3B rs860213 1,273 1,157 386 R/Q cGg/cAg
ATAD3B rs139902189 1,851 1,735 579 R/C Cgc/Tgc
ATP6V1B1 rs17720303 162 89 30 T/I aCc/aTc
COL2A1 rs2070739 4,378 4,213 1,405 G/S Ggc/Agc
CUL9 rs2273709 5,918 5,843 1,948 H/P cAc/cCc
EGFR rs2227983 1,586 1,403 468 R/K aGg/aAg
ERBB2 rs1058808, rs370420724 3,463 3,463 1,155 P/A Ccc/Gcc
ERBB2 rs1136201 281 283 95 I/V Atc/Gtc
EZH2 rs2302427 648 526 176 D/H Gac/Cac
FAM129A – 2,020 1,826 609 L/P cTg/cCg
FCGBP rs11083543 4,026 4,018 1,340 V/L Gtg/Ctg
FCGBP rs75388508 52 44 15 T/N aCc/aAc
HNF1A rs1169288 222 223 75 I/L Atc/Ctc
KRT33A rs12937519 854 809 270 A/V gCg/gTg
LAMA4 rs1050349 3,754 3,356 1,119 P/R cCt/cGt
LY6G6D rs118062293 334 334 112 R/C Cgt/Tgt
MAGEC1 rs12558365 1,008 722 241 S/F tCc/tTc
MAGEC1 rs176037 738 452 151 T/I aCt/aTt
MAP3K19 rs3905317 2,466 2,435 812 E/G gAa/gGa
MAP3K19 rs1112542 2,057 2,026 676 E/Q Gag/Cag
MDC1 – 5,320 4,672 1,558 G/S Ggc/Agc
MDC1 rs144087810 6,265 5,617 1,873 P/A Ccc/Gcc
MDC1 rs61733213 4,595 3,947 1,316 M/R aTg/aGg
MDC1 rs9461623 719 721 241 S/P Tct/Cct
MDC1 – 1,975 1,535 512 R/K aGa/aAa
MDN1 rs4707569 1,434 1,318 440 F/V Ttt/Gtt
MEGF6 rs7513275 571 344 115 M/T aTg/aCg
MEGF6 rs7553399 2,974 2,747 916 R/L cGg/cTg
MEGF6 rs4648506 3,637 3,410 1,137 G/A gGc/gCc
MICB rs1065075 346 238 80 K/E Aag/Gag
MICB rs1051788 451 310 104 D/N Gat/Aat
MICB rs3134900 408 267 89 I/M atC/atG
PTCH1 rs357564 4,086 3,941 1,314 P/L cCc/cTc
PTPN23 rs6780013 2,788 2,452 818 A/T Gca/Aca
PTPN23 – 3,697 3,361 1,121 S/C Agc/Tgc
RBMXL3 rs12399211 1,234 1,192 398 D/N Gac/Aac
RBMXL3 – 3,059 3,017 1,006 G/D gGc/gAc
RBMXL3 rs6643947 3,187 3,145 1,049 R/G Agg/Ggg
TAPBP rs2071888 731 518 173 T/R aCa/aGa
TAPBP – 421 208 70 V/M Gtg/Atg
TAPBP – 597 251 84 R/P cGg/cCg
TCF3 rs2074888 1,972 1,475 492 A/V gCg/gTg
TYK2 rs2304256 1,566 1,084 362 V/F Gtc/Ttc
WDSUB1 rs7591849 1,107 958 320 R/S Cgc/Agc
WDSUB1 rs16843852 793 644 215 K/T aAa/aCa
ZNF462 rs3814538 5,772 5,483 1,828 N/S aAc/aGc
ZNF462 rs17723637 1,499 1,210 404 M/V Atg/Gtg
Cancer Management and Research downloaded from https://www.dovepress.com/ by 118.70.13.36 on 20-Aug-2020
Dovepress Comparison of synchronous and metachronous colorectal liver metastases Table 3 Clinical variables associated with gene mutations
Clinical variable Mutation Mutation frequency (vs. no risk variable) p-value q-value
Age ≥65 years PTPN23 c.3361A>T 60.5% (26/43) (vs. 33.9% [40/118]) 0.002 0.096
Male gender KRT33A rs12937519 59.0% (62/105) (vs. 41.1% [23/56]) 0.030 0.480
MAGEC1 rs176037 23.8% (25/105) (vs. 42.9% [24/56]) 0.012 0.576
MICB rs3134900 8.6% (9/105) (vs. 21.4% [12/56]) 0.012 0.288
CEA at diagnosis ≥5 ng/mL ATAD3B rs860213 62% (62/100) (vs. 32.8% [20/61]) <0.001 0.008
TCF rs2074888 68% (68/100) (vs. 49.2% [30/61]) 0.018 0.144
MAP3K19 rs3905317 61% (61/100) (vs. 42.6% [26/61]) 0.023 0.159
COL2A1 rs2070739 64% (64/100) (vs. 47.5% [29/61]) 0.040 0.192
MEGF6 rs7513275 51% (51/100) (vs. 26.2% [16/61]) 0.002 0.032
MDC1 c.4672G>A 53% (53/100) (vs. 36.1% [55/61]) 0.037 0.196 PTPN23 c.3361A>T 30% (30/100) (vs. 59.0% [36/61]) <0.001 0.012
MDC1 rs61733213 29% (29/100) (vs. 47.5% [29/61]) 0.017 0.163
MAGEC1 rs176037 22% (22/100) (vs. 44.3% [27/61]) 0.003 0.036
MDC1 c.1535G>A 10% (10/100) (vs. 23.0% [14/61]) 0.025 0.150 Right-sided tumors MDC1 c.4672G>A 62.5% (30/48) (vs. 39.8% [45/113]) 0.008 0.384
Poor histologic grade ATAD3B rs860213 64.4% (29/45) (vs. 45.7% [53/116]) 0.033 0.528
KRT33A rs12937519 68.9% (31/45) (vs. 46.6% [54/116]) 0.011 0.528 ATAD3B rs139902189 44.4% (20/45) (vs. 26.7% [31/116]) 0.030 0.720 MAGEC1 rs12558365 33.3% (15/45) (vs. 18.1% [21/116]) 0.037 0.444
T3/T4 MICB rs1065075 33.8% (49/145) (vs. 62.5% [10/16]) 0.024 0.576
MICB rs3134900 11.0% (16/145) (vs. 31.3% [5/16]) 0.023 –
Lymph node positive ATAD3B rs860213 59.2% (61/103) (vs. 36.2% [21/58]) 0.005 0.048
MEGF6 rs7513275 47.6% (49/103) (vs. 31.0% [18/58]) 0.041 0.246 RBMXL3 rs12399211 53.4% (55/103) (vs. 75.9% [44/58]) 0.005 0.060 MDC1 rs144087810 38.8% (40/103) (vs. 13.8% [8/58]) 0.001 0.024 PTPN23 c.3361A>T 29.1% (30/103) (vs. 62.1% [36/58]) <0.001 0.020 MDC1 rs61733213 27.2% (28/103) (vs. 51.7% [30/58]) 0.002 0.032 MAGEC1 rs176037 23.3% (24/103) (vs. 43.1% [25/58]) 0.009 0.617
MICB rs3134900 7.8% (8/103) (vs. 22.4% [13/58]) 0.008 0.064
Numbers of LM ≥median level MEGF6 rs7513275 47.8% (54/113) (vs. 27.1% [13/48]) 0.015 0.240 RBMXL3 rs12399211 54.0% (61/113) (vs. 79.2% [38/48]) 0.003 0.072 MDC1 rs144087810 34.5% (39/113) (vs. 18.8% [9/48]) 0.045 0.540 PTPN23 c.3361A>T 32.7% (37/113) (vs. 60.4% [29/48]) 0.001 0.038 Diameter of the largest LM
≥median level
HNF1A 1rs1169288 68.8% (64/93) (vs. 48.5% [33/68]) 0.009 0.413 MDC1 c.4672G>A 53.8% (50/93) (vs. 36.8% [25/68]) 0.033 0.531
MDC1 rs61733213 43.0% (40/93) (vs. 26.5% [18/68]) 0.031 0.740
Note:q-value for adjusted p-value with false discovery rate (Benjamini–Hochberg procedure).
Abbreviations: CEA, carcinoembryonic antigen; LM, liver metastases.
CEA level, lymph node metastases, and number of LMs remained significant with false discovery rate <0.05.
Mutational pattern of synchronous and
metachronous liver metastases
The median number of mutations in the synchronous group was 22 (range from 2 to 32), which was significantly higher than 18 (range from 2 to 28) in the metachronous
group (p<0.001). Mutation frequency of the synchronous group, compared with the metachronous group, was signifi-cantly higher in 12 mutations and lower in five mutations (Figure 2). For most other mutations, the frequency was numerically higher in the synchronous group. In addition, only half of the most prevalent mutations in the synchro-nous group were in common with that in the metachrosynchro-nous group (Table 4).
Cancer Management and Research downloaded from https://www.dovepress.com/ by 118.70.13.36 on 20-Aug-2020
Dovepress
Zheng et al
Mutations and survival of metachronous
liver metastases
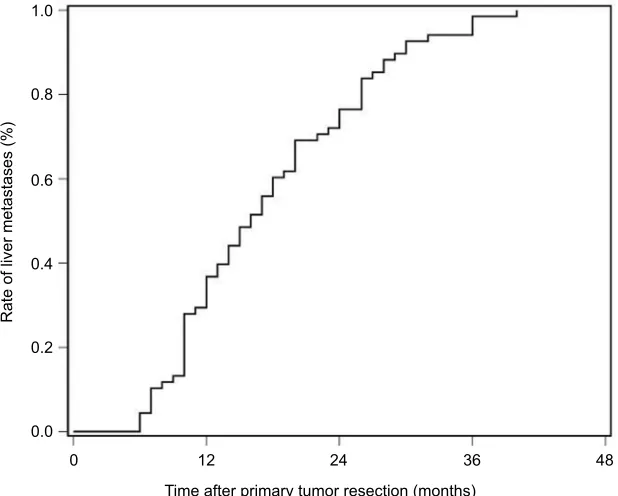
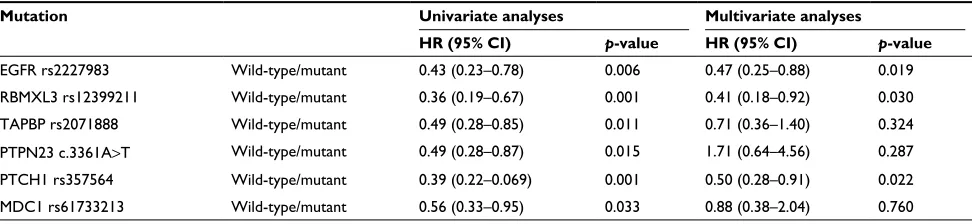
The latency of metachronous CLMs is summarized in Figure 3. Half of all metachronous CLMs occurred within 15 months, and 75% occurred within 24 months. For patients with metachronous CLMs, the latency was significantly associated with prevalent mutations in metachronous CLMs, including EGFR rs2227983, RBMXL3 rs12399211, TAPBP rs2071888, PTPN23 c.3361A>T, PTCH1 rs357564, and MDC1 rs61733213. In multivariate analysis, correlation between
latency and EGFR rs2227983, RBMXL3 rs12399211, and PTCH1 rs357564 remained significant (Table 5).
Discussion
In this study, we conducted NGS in primary tumors of synchronous or metachronous CLM and identified several differences in terms of clinical characteristics and mutational patterns.
For clinicopathologic characteristics, our results were broadly consistent with previous studies.2,5 Patients from
30
25
20
Number of patients
15
10
5
0
0–2 3–5 6–8 9–11 12–14 15–17 18–20
Number of mutations
21–23 24–26 27–29 30–32 >32
0
EGFR rs222
7983
ATAD3B rs8 60213 TAPB P rs2 0718 88 ZNF462 rs381 4538 TCF3 rs207 4888 MAP3K1 9 rs3 9053 17 CUL9 rs227 3709 MAP3 K19 rs 11125 42 HNF 1A rs
11692 88
COL2 A1 rs2
0707 39
PTCH1 rs 35764 TYK2 rs230 4256 LAMA4 rs105 0349 ACTN4 C.1200 G>C MEGG 6 rs7 5132 75 KRT3 3A rs
129375 19 MDC1 c.4672G>A RBMXL3 rs123 9921 1 MEGF 6 rs7 5533 99 PTPN 23 rs7 80013 ERBB2 rs 10588 08 FCGB P rs11
0835 43 MICB rs1 0650 75 MICB rs1 0517 88 MDC1 rs1 440878 10
ATAD3B rs1 399021
89
WDSU B1 rs7
5918 49
ATP6V1B1 rs 177203 03 MDN 1 rs4 7075 69 WDSUB1 rs 168438 52 TAPBP c.208G>A MAGEC1 rs 125583 65 EZH2 rs230 2427 MEGF 6 rs4 6485 06
LY6G6D rs 1180 62293 ERBB2 rs 11362 01 ZNF4 62 rs 177236 37 PTPN23 c.3361 A>T PTPN 23 c.33
61A>T >C MDC1 rs 617332 13 FCGB P rs753
88508 MDC1 rs946 1623 MAGE C1 rs1 76037 RBMXL3 c.3017G>A RBMXL3 rs664 3947 TAPBP c.251 G>C MDC1 c.1535G >A MICB rs3 1349 00 20 40
Mutational frequency (%
)
60 80 p<0.001
p <0.001 p <0.001 p =0.019 p
<0.001 p=0.014
p =0.018 p =0.007 p =0.009 p =0.004 p =0.025 p
=0.017 p=0.042
p <0.001 p <0.001 p <0.001 p =0.002 100 A B Synchronous Metachronous Synchronous Metachronous
Figure 2 Mutation frequencies of synchronous and metachronous CLMs.
Notes: (A) Mutation frequency of most sequenced genes were different between synchronous and metachronous CLMs, and 17 of them were statistically signifcant. (B)
Synchronous CLMs carried significantly more mutations than metachronous CLMs (median number, 22 vs 18, p<0.001).
Abbreviation: CLMs, colorectal liver metastases.
Cancer Management and Research downloaded from https://www.dovepress.com/ by 118.70.13.36 on 20-Aug-2020
Dovepress Comparison of synchronous and metachronous colorectal liver metastases
the synchronous group were younger than those from the metachronous group. Compared to the metachronous group, patients in the synchronous group showed heavier tumor burden for both primaries and liver metastases. Furthermore,
the synchronous group, more frequently characterized by adverse prognostic factors, had inferior overall survival than the metachronous group (median time 26 vs. 36 months, p=0.001). These results indicated that synchronous CLM may represent a more aggressive tumor subtype than metachronous CLM. All these issues highlight the need for understanding of differences in molecular biology, which results in and keeps the different manifestations between synchronous and metachronous CLMs.
Based on the understanding of the mechanisms of metas-tases, we extracted our efforts to identify biologic differences between synchronous and metachronous CLMs. In contrast to previous studies focusing on limited gene alterations,2,8,9,33
we used a multivariable approach, including genome-wide exploration using WES, panel construction based on bioin-formatics, and selection of significant biomarkers according to clinical outcomes. The advantage of this multivariable approach is that it is unbiased by biologic assumptions and thereby may find correlations between distinct gene mutations and liver metastases.
Finally, we included and analyzed 48 mutations in 27 genes. The synchronous group harbored significantly more mutations than the metachronous group, representing a more heterogeneous and advanced subgroup of CLM. For the synchronous group, about half of the prevalent muta-tions were in common with the metachronous group, and the most prevalent was EGFR rs2227983. These mutations
Table 4 Prevalent mutations in synchronous and metachronous groups
Prevalent mutations in synchronous group
Prevalent mutations in metachronous group Mutation Frequency (vs.
metachronous group) (%)
Mutation Frequency (vs. synchronous group) (%)
EGFR rs2227983
79.5 (vs. 72.1) EGFR rs2227983
72.1 (vs. 79.6)
ATAD3B rs860213
78.4** (vs. 13.2) RBMXL3 rs12399211
72.1** (vs. 53.8)
TAPBP rs2071888
7.84 (vs. 70.6) TAPBP rs2071888
70.6 (vs. 78.5)
ZNF462 rs3814538
71.0 (vs. 67.6) ZNF462 rs3814538
67.6 (vs. 71.0)
TCF3 rs2074888
71.0* (vs. 47.1) PTPN23 c.3361A>T
67.6** (vs. 21.5)
MAP3K19 rs3905317
68.8* (vs. 33.8) PTCH1 rs357564
66.2 (vs. 63.4)
CUL9 rs2273709
66.7 (vs. 61.7) CUL9 rs2273709
61.7 (vs. 66.7)
MAP3K19 rs1112542
66.7** (vs. 33.8) MDC1 rs61733213
60.3** (vs. 18.3)
Notes: *p<0.05; **p<0.001.
1.0
0.8
0.6
0.4
0.2
Rate of liver metastases (%
)
0.0
0 12
Time after primary tumor resection (months)
24 36 48
Figure 3 Timing of metachronous metastases.
Note: Half of all metachronous colorectal liver metastases occurred within 15 months, and 75% occurred within 24 months.
Cancer Management and Research downloaded from https://www.dovepress.com/ by 118.70.13.36 on 20-Aug-2020
Dovepress
Zheng et al
were potential key mutations of liver metastases and further research was needed. Another half of the prevalent mutations were private in the synchronous group and were significantly more frequently mutant than the metachronous group. In addition, prevalent mutations private in the metachronous group showed similar trend. Furthermore, these mutations, including RBMXL3 rs12399211, PTPN23 c.3361A>T, PTCH1 rs357564, and MDC1 rs61733213, partly explained the latency of metachronous liver metastases. All these results indicated that the synchronous and the metachronous groups showed different mutational patterns, and these mutations were correlated with several clinical characteristics. Differ-ent mutations may be potDiffer-ential key mutations and further researches were needed.
In previous studies on this topic, the majority found differences in molecular marker expression between CLMs and their respective primaries in both the synchronous and metachronous groups. Limited comparison was done between LMs or primaries between the synchronous and the metachronous groups. Pantaleo et al8 compared the
expres-sion signature with reverse transcriptase PCR and enzyme-linked immunosorbent assay and indicated that EGFR and COX-2 are overexpressed in metachronous and synchronous metastases, respectively. van der Wal et al2 reported that liver
parenchyma adjacent to the LMs provides a highly prosperous angiogenic environment in the synchronous group compared to the metachronous groups. However, there were also many studies with negative findings.34,35 Our results added
evi-dences for the hypothesis that synchronous and metachronous CLMs were biologically different.
According to previous studies, both synchronous and metachronous CLMs would evolve different biologic alterations to their corresponding primaries.11,32,33,36 Thus,
examination of metastatic tissue is crucial as it could help choose optimal treatment according to current biologic status. Simultaneously, studies also demonstrated that the majority
of biologic alterations, especially key alterations, in primaries were maintained in CLMs.11,32,35 If these key alterations of
liver metastases could be detected in primaries, it could have important clinical implications for prediction of occurrence, even timing of liver metastases. Under consideration of the evidence mentioned above, we selected and examined tissue of primary tumors. If only corresponding metastatic tissue were examined, our study may provide more information.
This was a retrospective exploratory study and there were several limitations: first, we sequenced single type of gene alteration in a highly selected cohort. Only SNPs of primary tumors with wild-type RAS were sequenced. Thus, this study provided an incomplete and partial view on differences between different CLMs; second, many correlations were observed between clinical parameters and mutations, but relevant biologic evidences were still limited. More studies were needed to confirm the clinical meanings and explore the underlying mechanism. Third, the influences of tumor heterogeneity and differences between LMs and their respec-tive primaries were not taken into consideration in the study.
Conclusion
Synchronous CLMs, compared to metachronous CLMs, were younger and showed heavier tumor burden for both primaries and liver metastases. NGS identified different mutational patterns between synchronous and metachronous CLMs. Further researches were needed to confirm the correlation between differences in clinical characteristics and mutational patterns and the mechanism inside.
Acknowledgment
This work was supported by National Natural Science Foun-dation of China (grant number: 81472228).
Disclosure
The authors report no conflicts of interest in this work.
Table 5 Univariate and multivariate analyses of latency of metachronous colorectal liver metastases
Mutation Univariate analyses Multivariate analyses
HR (95% CI) p-value HR (95% CI) p-value
EGFR rs2227983 Wild-type/mutant 0.43 (0.23–0.78) 0.006 0.47 (0.25–0.88) 0.019
RBMXL3 rs12399211 Wild-type/mutant 0.36 (0.19–0.67) 0.001 0.41 (0.18–0.92) 0.030
TAPBP rs2071888 Wild-type/mutant 0.49 (0.28–0.85) 0.011 0.71 (0.36–1.40) 0.324
PTPN23 c.3361A>T Wild-type/mutant 0.49 (0.28–0.87) 0.015 1.71 (0.64–4.56) 0.287
PTCH1 rs357564 Wild-type/mutant 0.39 (0.22–0.069) 0.001 0.50 (0.28–0.91) 0.022
MDC1 rs61733213 Wild-type/mutant 0.56 (0.33–0.95) 0.033 0.88 (0.38–2.04) 0.760
Abbreviation: HR, hazard ratio.
Cancer Management and Research downloaded from https://www.dovepress.com/ by 118.70.13.36 on 20-Aug-2020
Dovepress
Cancer Management and Research
Publish your work in this journal
Submit your manuscript here: https://www.dovepress.com/cancer-management-and-research-journal
Cancer Management and Research is an international, peer-reviewed open access journal focusing on cancer research and the optimal use of preventative and integrated treatment interventions to achieve improved outcomes, enhanced survival and quality of life for the cancer patient. The manuscript management system is completely online and includes
a very quick and fair peer-review system, which is all easy to use. Visit http://www.dovepress.com/testimonials.php to read real quotes from published authors.
Dove
press
Comparison of synchronous and metachronous colorectal liver metastases
References
1. Torre LA, Bray F, Siegel RL, Ferlay J, Lortet-Tieulent J, Jemal A. Global cancer statistics, 2012. CA Cancer J Clin. 2015;65(2):87–108. 2. van der Wal GE, Gouw AS, Kamps JA, et al. Angiogenesis in
syn-chronous and metasyn-chronous colorectal liver metastases: the liver as a permissive soil. Ann Surg. 2012;255(1):86–94.
3. Van Cutsem E, Nordlinger B, Adam R, et al; European Colorectal Metastases Treatment Group. Towards a pan-European consensus on the treatment of patients with colorectal liver metastases. Eur J Cancer. 2006;42(14):2212–2221.
4. de Jong MC, Pulitano C, Ribero D, et al. Rates and patterns of recur-rence following curative intent surgery for colorectal liver metastasis: an international multi-institutional analysis of 1669 patients. Ann Surg. 2009;250(3):440–448.
5. Tsai MS, Su YH, Ho MC, et al. Clinicopathological features and prognosis in resectable synchronous and metachronous colorectal liver metastasis. Ann Surg Oncol. 2007;14(2):786–794.
6. Dexiang Z, Li R, Ye W, et al. Outcome of patients with colorectal liver metastasis: analysis of 1,613 consecutive cases. Ann Surg Oncol. 2012;19(9):2860–2868.
7. Watanabe T, Kobunai T, Yamamoto Y, et al. Prediction of liver metastasis after colorectal cancer using reverse transcription-polymerase chain reaction analysis of 10 genes. Eur J Cancer. 2010;46(11):2119–2126. 8. Pantaleo MA, Astolfi A, Nannini M, et al. Gene expression profiling of
liver metastases from colorectal cancer as potential basis for treatment choice. Br J Cancer. 2008;99(10):1729–1734.
9. Chen J, Li Q, Wang C, Wu J, Zhao G. Prognostic significance of c-erbB-2 and vascular endothelial growth factor in colorectal liver metastases.
Ann Surg Oncol. 2010;17(6):1555–1563.
10. Nanashima A, Shibata K, Nakayama T, et al. Clinical significance of microvessel count in patients with metastatic liver cancer originating from colorectal carcinoma. Ann Surg Oncol. 2009;16(8):2130–2137. 11. Slesser AA, Georgiou P, Brown G, Mudan S, Goldin R, Tekkis P. The
tumour biology of synchronous and metachronous colorectal liver metas-tases: a systematic review. Clin Exp Metastasis. 2013;30(4):457–470. 12. Yu J, Wu WK, Li X, et al. Novel recurrently mutated genes and a prog-nostic mutation signature in colorectal cancer. Gut. 2015;64(4):636–645. 13. Helman E, Lawrence MS, Stewart C, Sougnez C, Getz G, Meyerson M. Somatic retrotransposition in human cancer revealed by whole-genome and exome sequencing. Genome Res. 2014;24(7):1053–1063. 14. Sadanandam A, Lyssiotis CA, Homicsko K, et al. A colorectal cancer
classification system that associates cellular phenotype and responses to therapy. Nat Med. 2013;19(5):619–625.
15. The SeattleSeq Annotation server. Available from: http://snp. gs.washington.edu/SeattleSeqAnnotation138/. Accessed September, 2014.
16. NHLBI Exome Sequencing Project: Exome Variant Server. Available from: http://evs.gs.washington.edu/EVS/. Accessed September, 2014. 17. dbSNP databases. Available from: http://www.ncbi.nlm.nih.gov/
projects/SNP/. Accessed September, 2014.
18. Kumar P, Henikoff S, Ng PC. Predicting the effects of coding non-synonymous variants on protein function using the SIFT algorithm.
Nat Protoc. 2009;4(7):1073–1081.
19. SIFT database. Available from: http://www.jcvi.org/. Accessed Sep-tember, 2014.
20. Adzhubei I, Jordan DM, Sunyaev SR. Predicting functional effect of human missense mutations using PolyPhen-2. Curr Protoc Hum Genet. 2013; Chapter 7: Unit 7.20.
21. PolyPhen-2 (Polymorphism Phenotyping v2). Available from: http:// genetics.bwh.harvard.edu/pph2/. Accessed September, 2014. 22. Reva B, Antipin Y, Sander C. Predicting the functional impact of
protein mutations: application to cancer genomics. Nucleic Acids Res. 2011;39(17):e118.
23. Mutationassessor.org (release 3). Available from: http://mutationas-sessor.org/r3/. Accessed September, 2014.
24. Gonzalez-Perez A, Lopez-Bigas N. Improving the assessment of the outcome of nonsynonymous SNVs with a consensus deleteriousness score, Condel. Am J Hum Genet. 2011;88(4):440–449.
25. FannsDB database: Condel. Available from: http://bbglab.irbbarcelona. org/fannsdb/. Accessed September, 2014.
26. Shihab HA, Gough J, Cooper DN, et al. Predicting the functional, molecular, and phenotypic consequences of amino acid substitutions using hidden Markov models. Hum Mutat. 2013;34(1):57–65. 27. Fathmm (Functional Analysis through Hidden Markov Models
v2.3). Available from: http://fathmm.biocompute.org.uk/. Accessed September, 2014.
28. Gonzalez-Perez A, Deu-Pons J, Lopez-Bigas N. Improving the predic-tion of the funcpredic-tional impact of cancer mutapredic-tions by baseline tolerance transformation. Genome Med. 2012;4(11):89.
29. GeneRIF (Gene Reference Into Function). Available from: http://www. ncbi.nlm.nih.gov/gene/submit-generif. Accessed November, 2014. 30. COSMIC (Catalog of Somatic Mutations in Cancer). Available from:
https://cancer.sanger.ac.uk/cosmic. Accessed November, 2014. 31. Comprehensive molecular characterization of human colon and rectal
cancer. Nature. 2012;487(7407):330–337.
32. Kim TM, Jung SH, An CH, et al. Subclonal genomic architectures of primary and metastatic colorectal cancer based on intratumoral genetic heterogeneity. Clin Cancer Res. 2015;21(19):4461–4472.
33. Kuramochi H, Nakajima G, Kaneko Y, et al. Amphiregulin and epiregu-lin mRNA expression in primary colorectal cancer and corresponding liver metastases. BMC Cancer. 2012;12:88.
34. Nakamoto RH, Uetake H, Iida S, et al. Correlations between cyclo-oxygenase-2 expression and angiogenic factors in primary tumors and liver metastases in colorectal cancer. Jpn J Clin Oncol. 2007;37(9): 679–685.
35. Kim KP, Kim JE, Hong YS, et al. Paired primary and metastatic tumor analysis of somatic mutations in synchronous and metachronous colorectal cancer. Cancer Res Treat. 2017;49(1):161–167.
36. Bird NC, Mangnall D, Majeed AW. Biology of colorectal liver metas-tases: a review. J Surg Oncol. 2006;94(1):68–80.
Cancer Management and Research downloaded from https://www.dovepress.com/ by 118.70.13.36 on 20-Aug-2020